PIPPIN rips higher on negative funding and rising open interest | Credit: Hameem Sarwar
Share
Key Takeaways
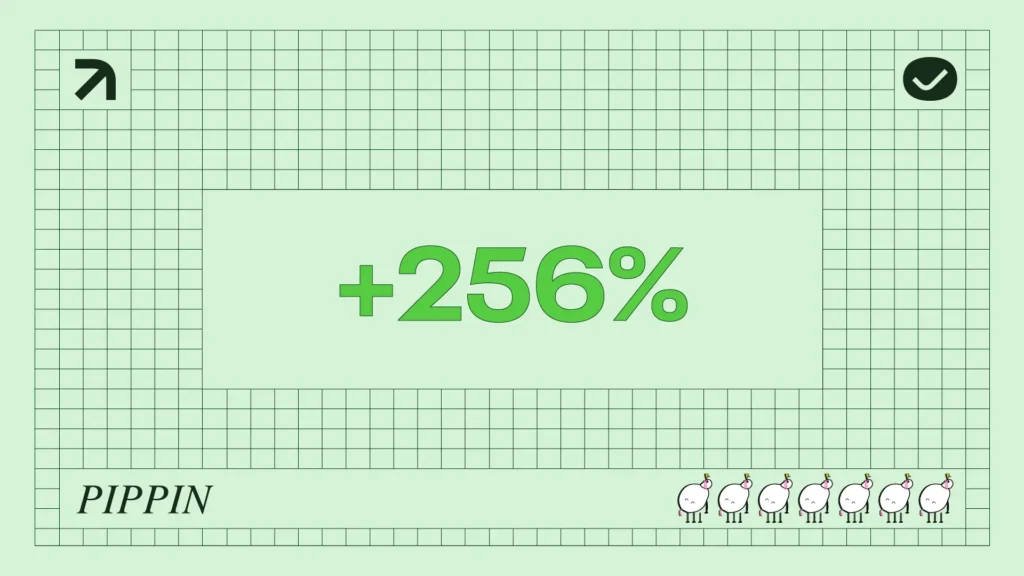
PIPPIN ripped 60% to $0.51 after breaking out of a multi-week downtrend.
The spike was amplified by a short squeeze and a 62% jump in OI.
If PIPPIN holds above the $0.38 breakout, the next target could be $0.65.
Solana-based memecoin PIPPIN is staging one of its strongest comebacks in weeks.
Today, the token has broken out of a prolonged downtrend with an explosive move, thrusting the memecoin back into the spotlight.
Notably, PIPPIN’s price is trading around $0.51, rising more than 60% over the past 24 hours.
The sudden surge has caught many traders off guard, fueling speculation that a short squeeze may have triggered it.
In this analysis, CCN breaks down how the memecoin surged. We also evaluate what lies ahead for PIPPIN’s price.
Buyers Push PIPPIN Higher
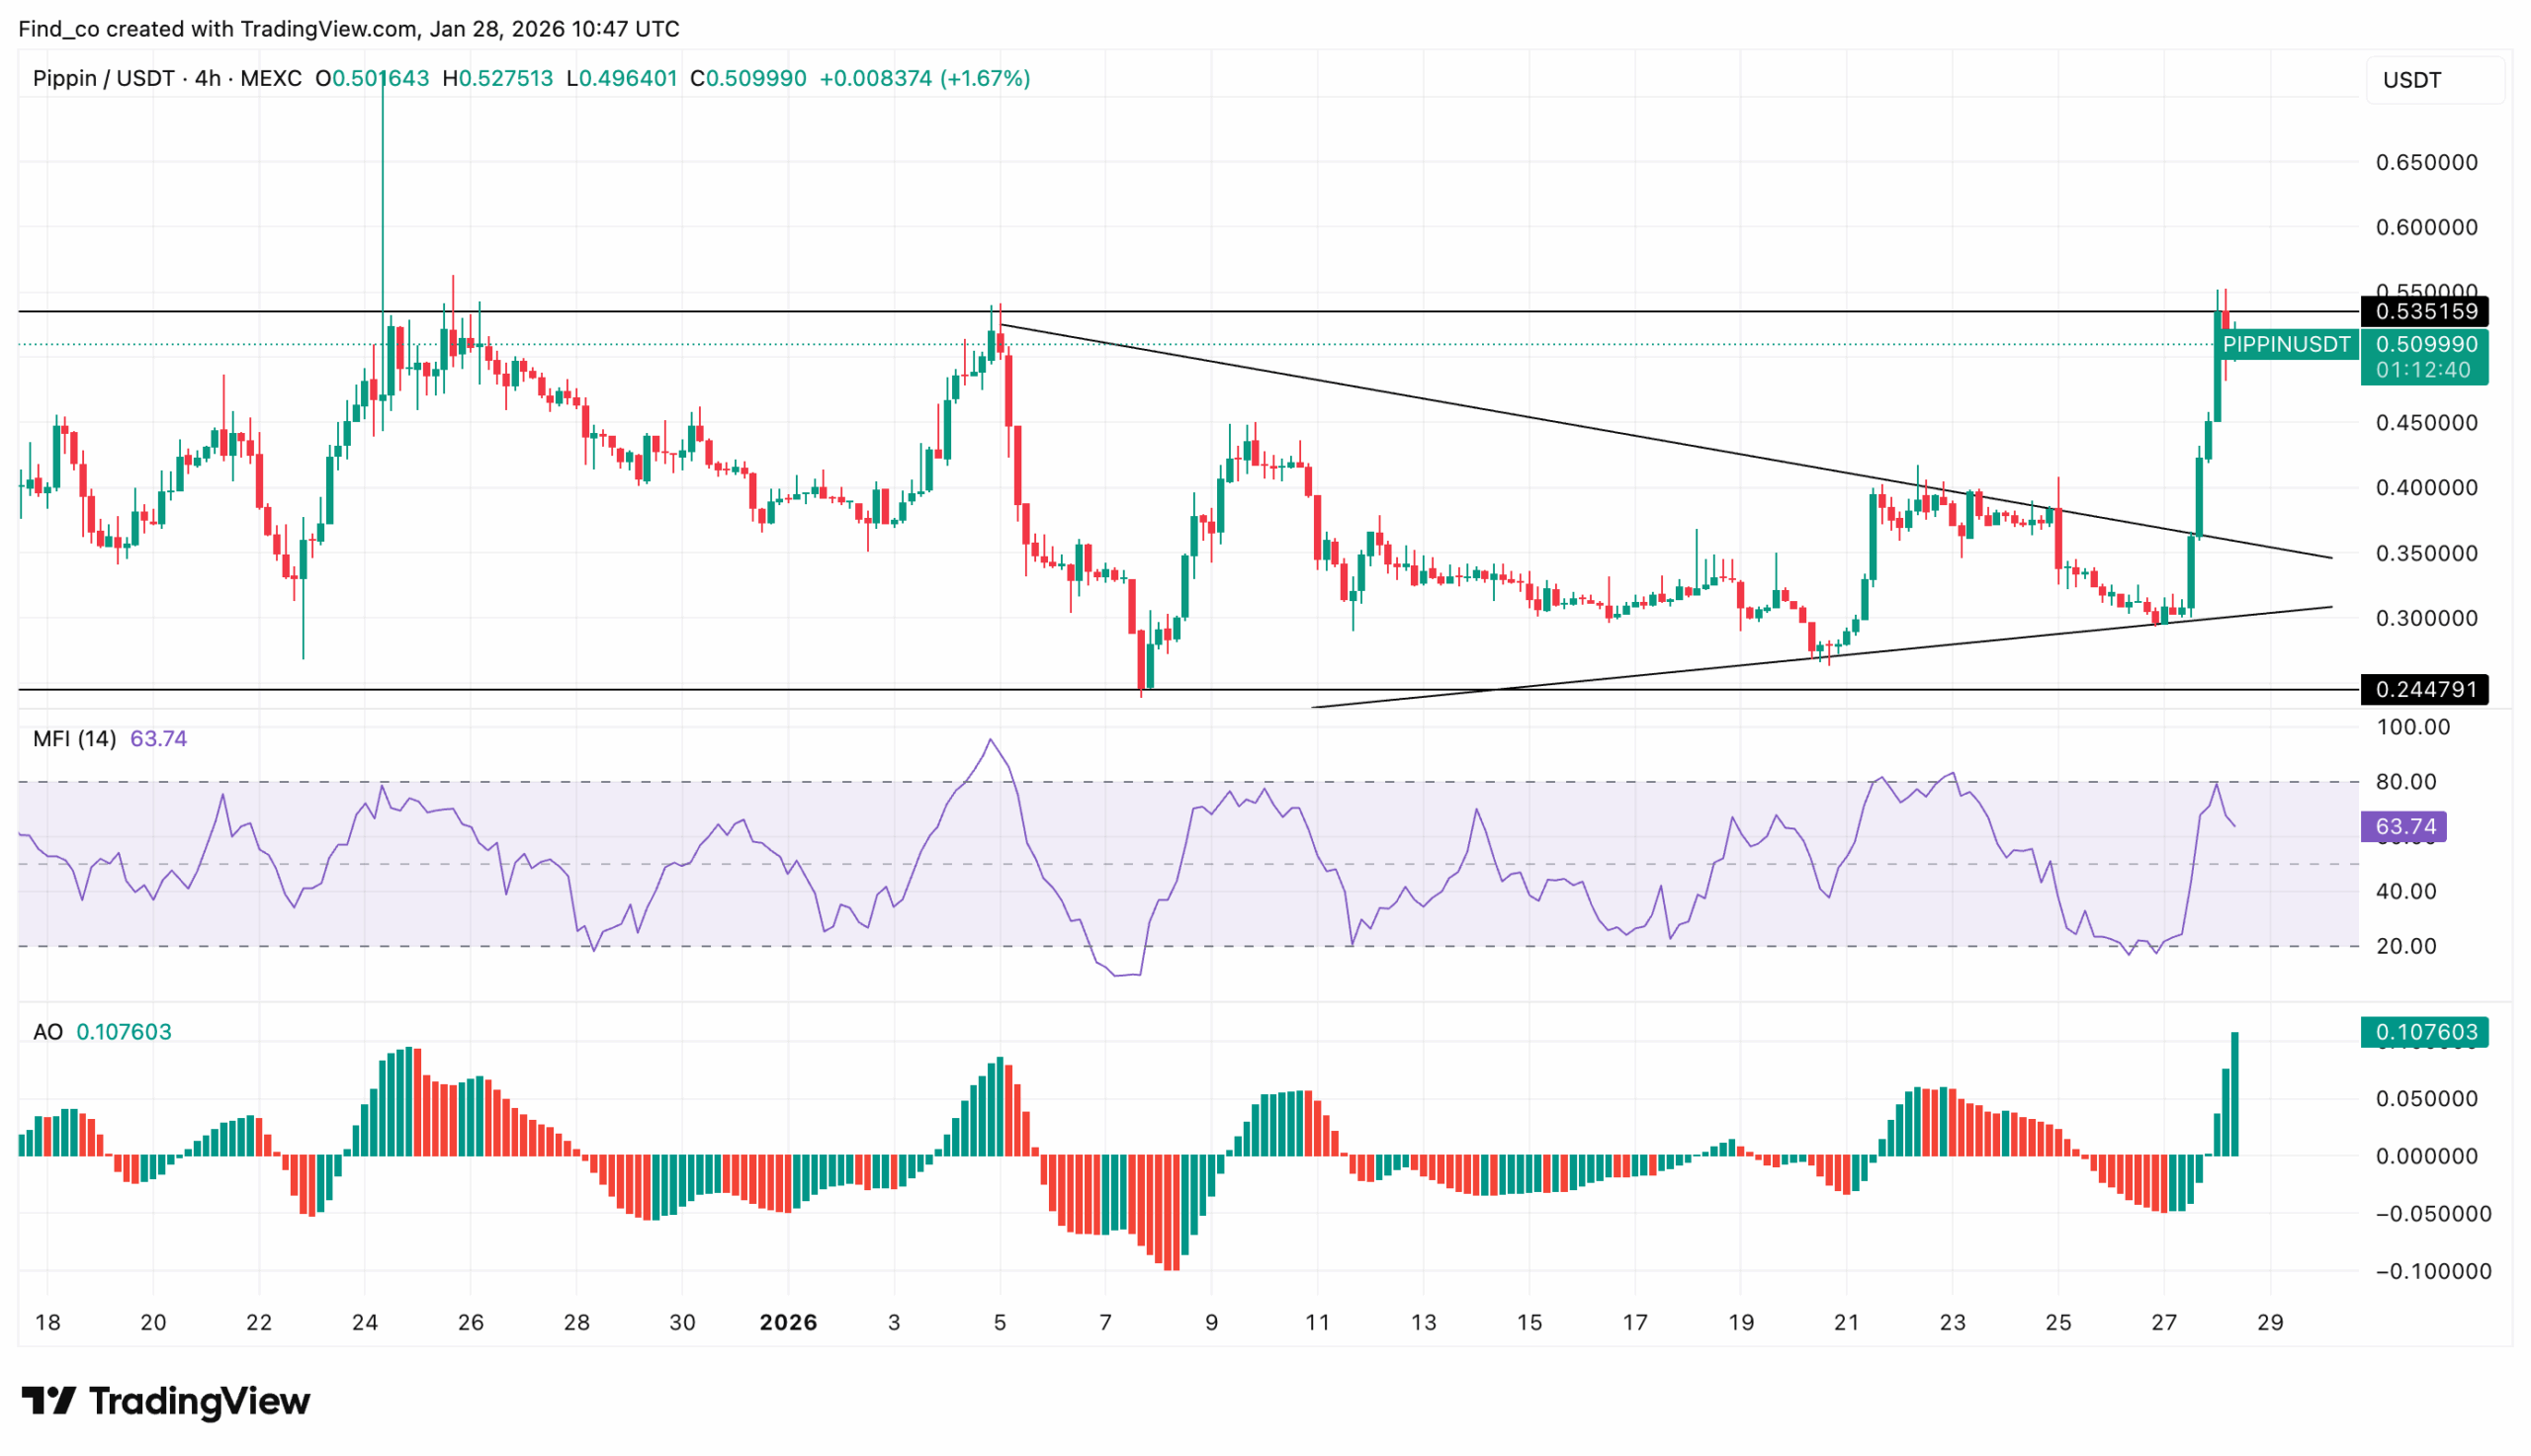
PIPPIN’s price delivered a bullish breakout on the 4-hour chart. This occurred after the memecoin reclaimed the upper boundary of the symmetrical triangle wedge that had confined the price since early January.
A shown below, the PIPPIN token validated the move after bouncing off the rising lower trendline. Furthermore, the Money Flow Index (MFI) has moved higher, indicating healthy inflows.
Likewise, the Awesome Oscillator (AO) has flipped positive, with expanding green bars, signaling accelerating bullish momentum.
From a technical standpoint, the former wedge resistance around $0.38 now acts as key support, and holding above it keeps upside continuation in play toward $0.55 and potentially the prior highs near $0.65.
Failure to hold above the breakout level would suggest a false move. If that happens, it could open the door for a pullback toward the $0.32 demand zone.
But as it stands, PIPPIN’s price will likely remain above the resistance line.
Short Squeeze Fuels PIPPIN Rally
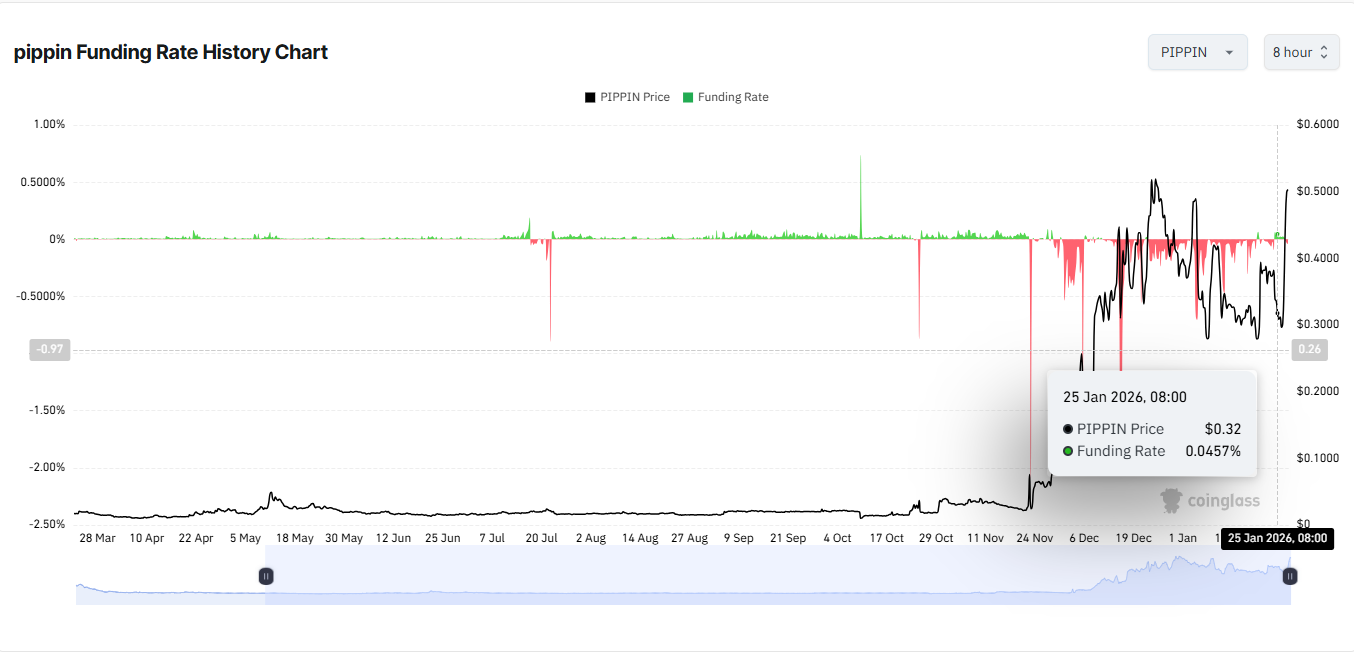
Furthermore, the rally accelerated as a short squeeze formed under persistently negative funding. With shorts no longer getting paid to stay bearish, the risk–reward flipped against them.
As PIPPIN’s price rose, short sellers were forced to cover, and that buying pressure drove the price even higher.
In effect, bearish positioning turned into a trap. Late exits followed, and many traders ended up chasing the move instead of fading it.
At the same time, Open Interest (OI) jumped 62%, signaling a notable rise in participation. Importantly, this points to fresh positions entering the market, not just shorts closing.
When price climbs alongside rising OI, it often supports continuation because new money is still flowing in. However, if momentum cools, crowded leverage can magnify swings.
For now, the flow still favors bulls. Yet, the setup is becoming more leverage-heavy, which means volatility risk is rising even as upside momentum holds.
PIPPIN Price Forecast: Bullish
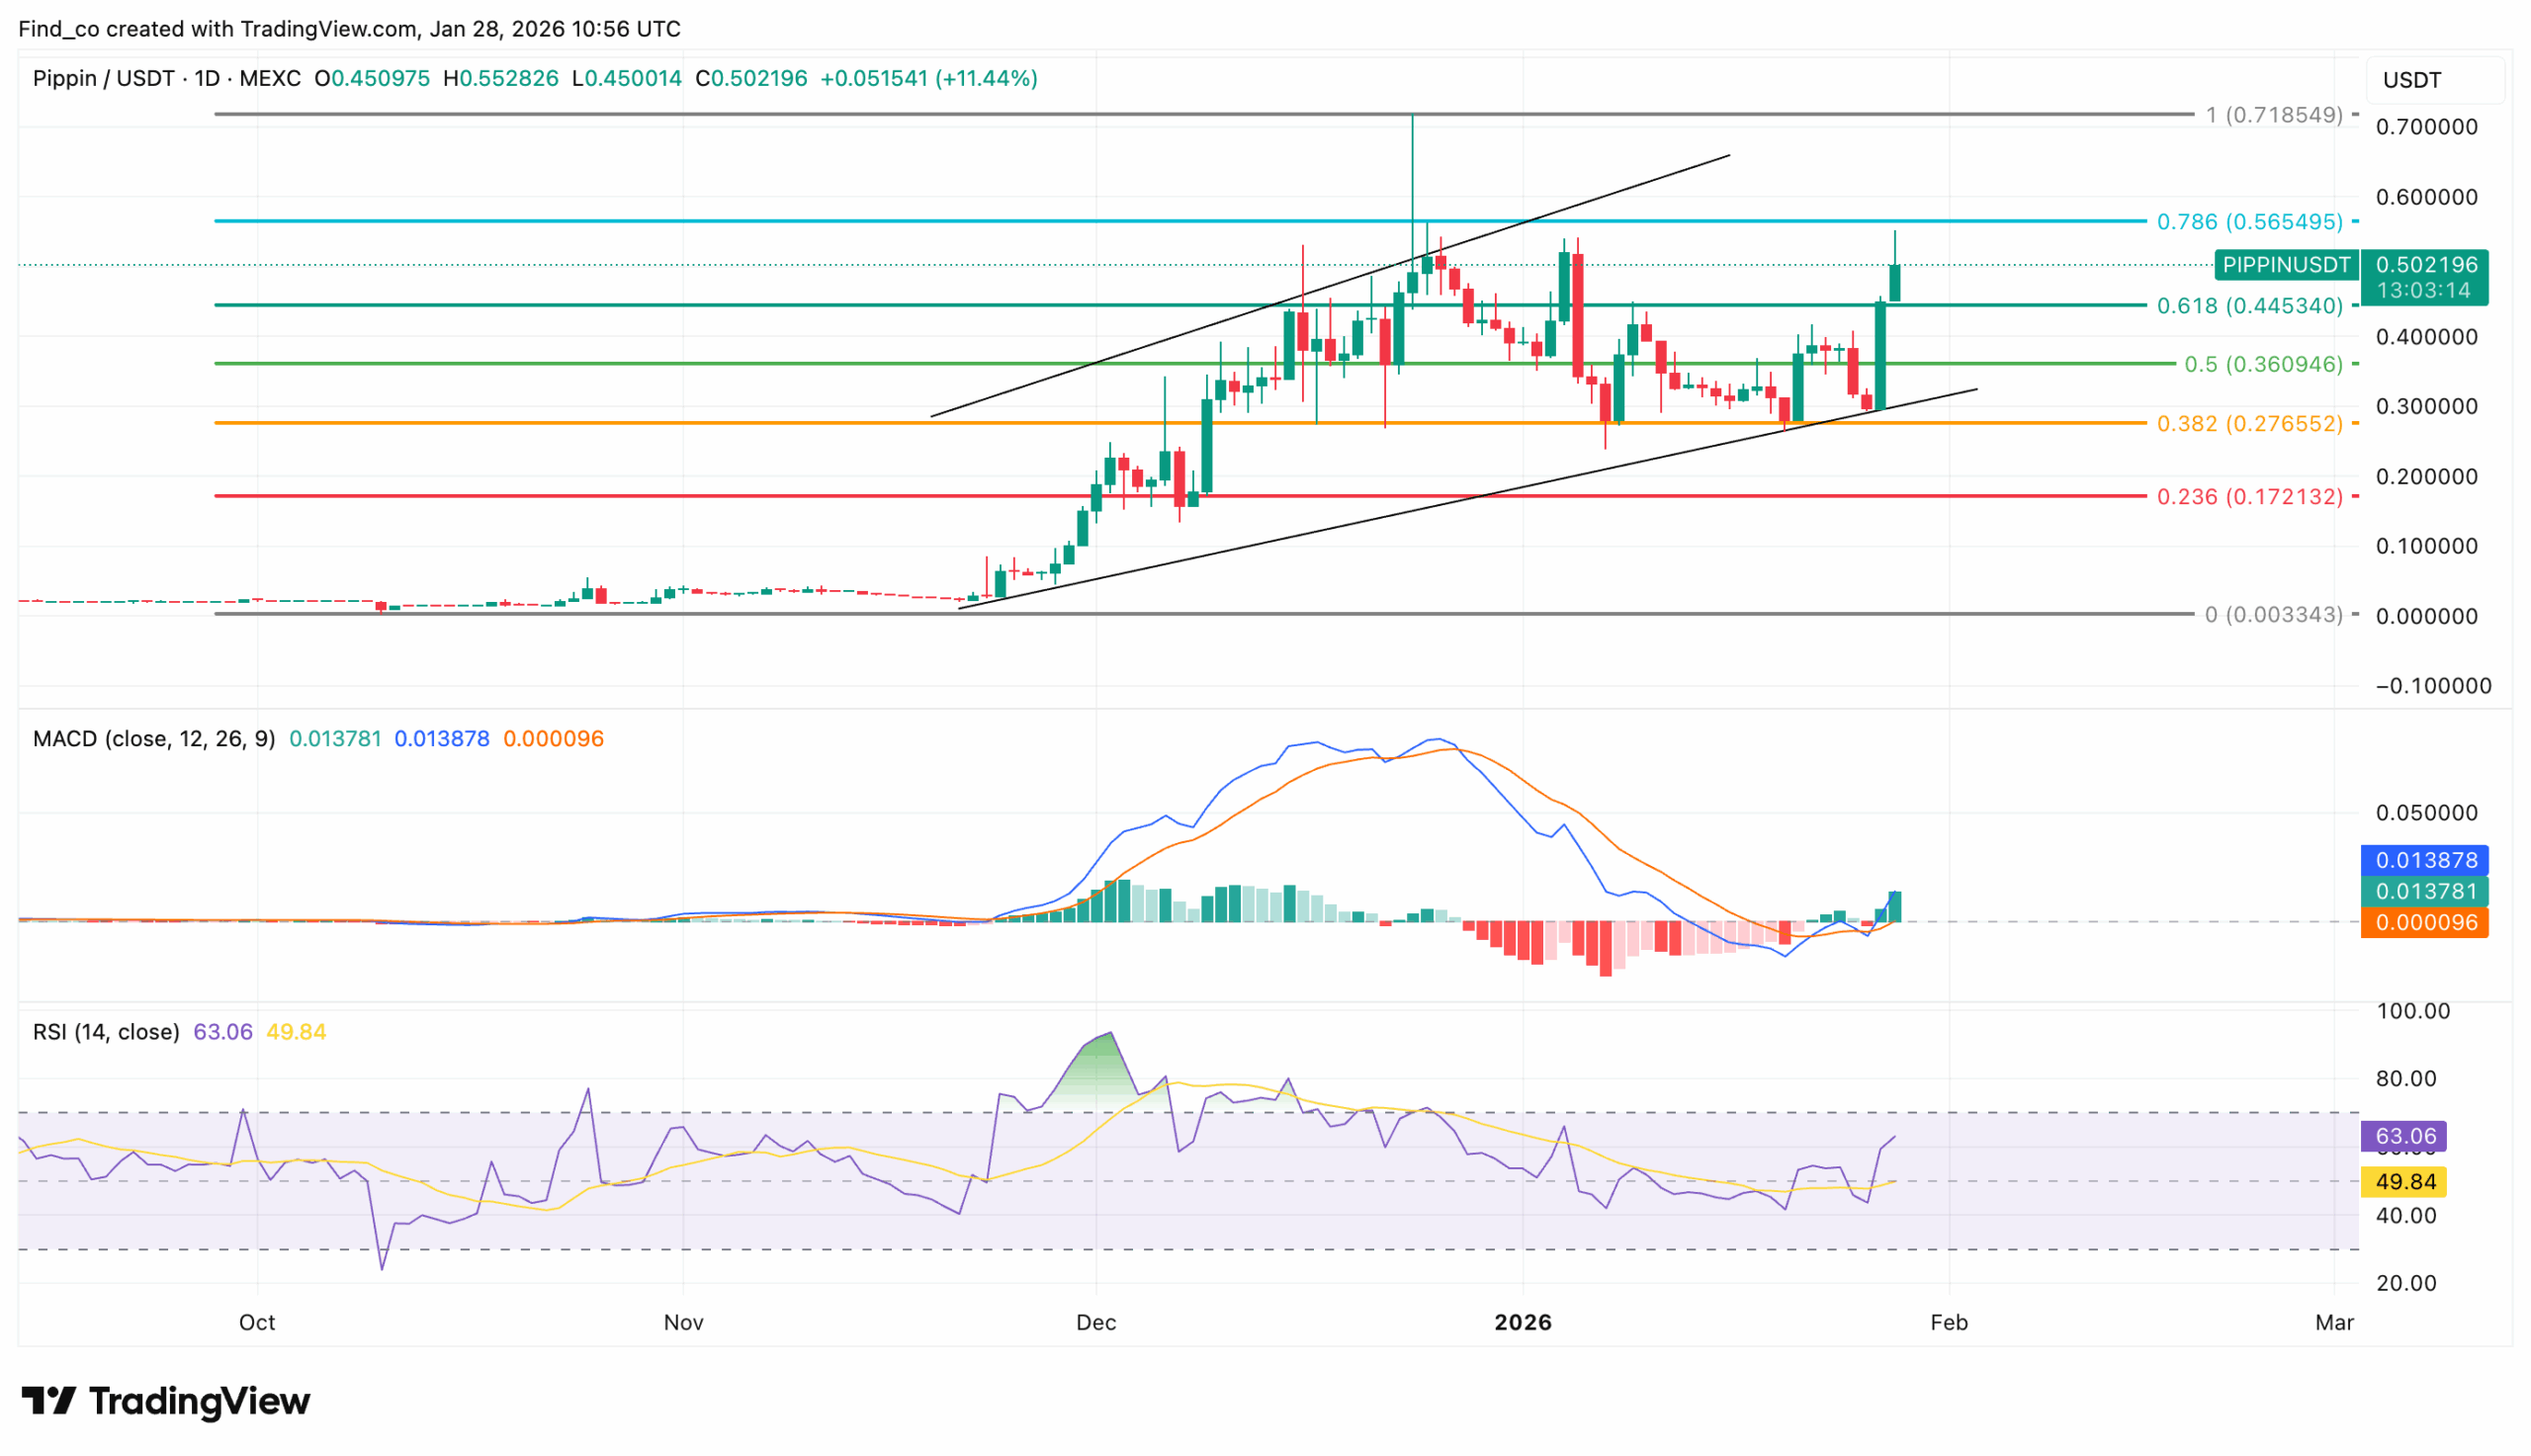
On the daily chart, PIPPIN’s price has maintained a steady upswing, marked by a clear sequence of higher highs that confirms sustained bullish control.
This structure signals that buyers remain in command, even as the pace of gains remains measured rather than explosive.
Momentum indicators reinforce this outlook. The Moving Average Convergence Divergence (MACD) has flipped into positive territory and continues to print green histogram bars.
Although the bars remain relatively short, suggesting momentum is still building rather than fully extended, they indicate the early stages of a bullish phase.
If buying pressure strengthens, the MACD could expand further, supporting additional upside.
The Relative Strength Index (RSI) has extended its climb and now sits at 63.75, approaching the overbought threshold.
This reading indicates strengthening bullish momentum while signaling that upside may begin to slow.
Historically, moves above this level often attract short-term profit-taking, especially if follow-through volume fails to pick up.
Disclaimer:
The information provided in this article is for informational purposes only. It is not intended to be, nor should it be construed as, financial advice. We do not make any warranties regarding the completeness, reliability, or accuracy of this information. All investments involve risk, and past performance does not guarantee future results. We recommend consulting a financial advisor before making any investment decisions.
Victor Olanrewaju is a crypto analyst and reporter at CCN with deep roots in on-chain research and technical analysis. His crypto journey began in 2017, but it was the 2020 Uniswap airdrop that sparked a full-time pivot into the space.
With a foundation in copywriting, Victor honed his craft creating high-converting content for leading crypto brokers — most notably an XRP price prediction that ranked #1 on Google during the 2021 bull run.
He later joined AMBCrypto in 2022, where he combined storytelling with technical and on-chain analysis to cover key market narratives.
In 2024, he expanded his expertise at BeInCrypto, collaborating with analysts and using tools like Glassnode, Santiment, and IntoTheBlock to break down Bitcoin and altcoin trends.
At CCN, Victor covers the top cryptocurrencies, memecoins, macro shifts, blending real-time insights with deep-dive metrics.
He holds a Bachelor’s degree in Physics from the University of Ibadan, equipping him to simplify complex data for a wide audience. Follow his work or connect on LinkedIn or X.