Pi Network struggles after a 92% drawdown | Credit: Hameem Sarwar
Share
Key Takeaways
PI’s price collapses 92%, stuck in a severe, persistent downtrend.
Indicators show fading momentum and strong seller control.
Here is why the breakdown could lead the coin to a new low.
PI, the native token of the Pi Network, has experienced a dramatic collapse after its explosive rally to an all-time high of $2.98 in February 2025.
The asset has now suffered a staggering 92% drawdown, erasing nearly all bullish confidence and trapping the token in a relentless downtrend.
Once fueled by speculation and hype, the Pi Network price now struggles to attract meaningful buy-side activity.
Every slight bounce has met immediate sell pressure, confirming persistent weakness across the market.
With momentum indicators firmly bearish and price action sliding deeper into structural exhaustion, PI’s chances of staging a meaningful recovery this month appear extremely limited.
Is PI’s downtrend finally nearing an end? Let’s take a closer look.
PI Recovery Remains Unlikely
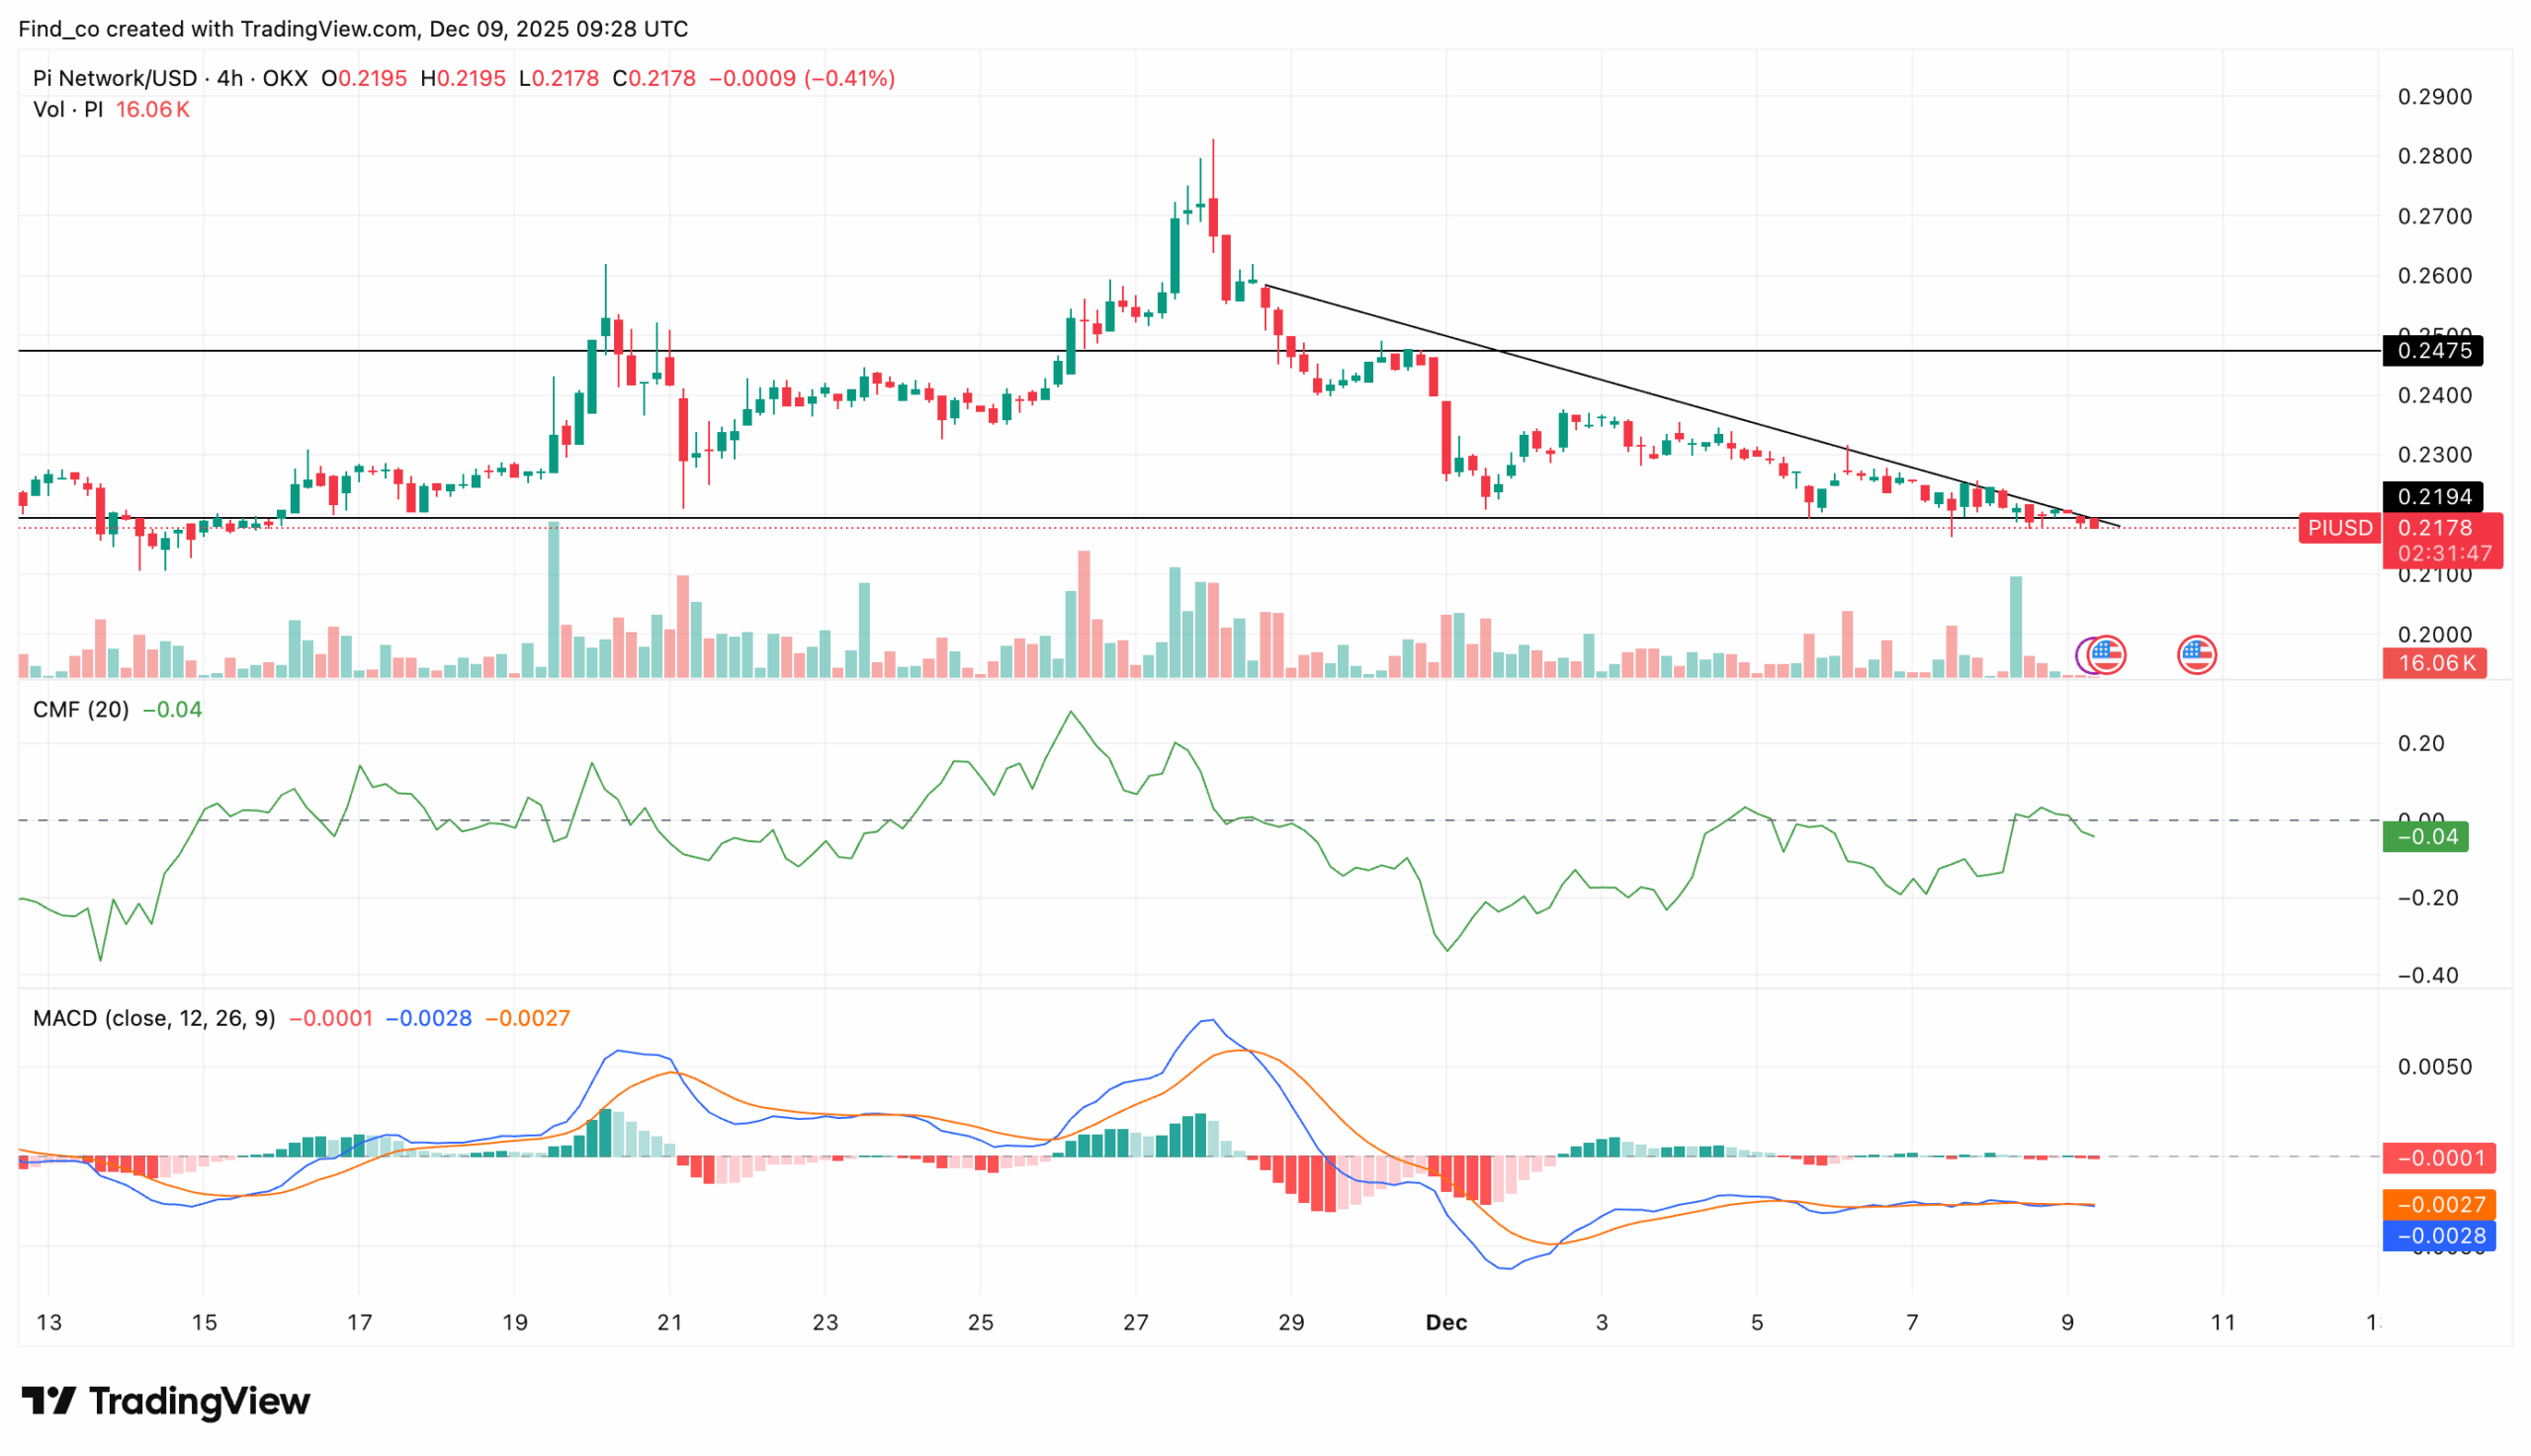
The 4-hour chart highlights just how fragile PI’s price structure has become. The Chaikin Money Flow (CMF) sits at 0.01, barely above the zero line.
This slight uptick shows that bullish momentum is fading rather than building.
Buyers are failing to generate real inflows, while sellers continue to retain structural control. In short, accumulation remains almost nonexistent.
The MACD reinforces the bearish outlook. The 26-day EMA has crossed above the 12-day EMA, signaling a decline in bullish strength. Both EMAs are flattening out while histogram bars hover near zero, reflecting stalled momentum.
As price compresses between the $0.24 resistance and $0.21 support, PI’s inability to reclaim higher levels shows how damaging the 92% collapse has been.
A failure to hold above $0.21 could trigger another decline, pushing the token toward post-crash lows as volatility resurges and buyers retreat.
PI Price Prediction: Extremely Bearish
The Pi Network price has remained trapped inside a descending channel since peaking in February. The Directional Movement Index (DMI) paints a clear bearish picture.
The −DMI at 25.58 sits above the +DMI at 18.51, confirming that sellers still hold the upper hand.
However, the Average Directional Index (ADX) stands at 14.64, indicating weak overall market momentum.
Rather than highlighting strength, this low reading shows that PI is drifting without conviction.
Bulls cannot mount a recovery, and bears, despite dominating structure, lack the momentum needed for a breakdown.
The result is a shallow, indecisive phase that offers little hope for a rebound.
The Relative Strength Index (RSI) adds more pressure. At 40.55, the indicator has now slipped below the neutral line and is trending toward oversold territory. This confirms weakening buyer strength and opens the door to further downside.
If RSI continues to decline and price breaks below the descending channel, PI’s price could face accelerated selling as traders exit positions ahead of lower support levels.
Fibonacci Retracement levels show that PI is gradually drifting toward the Fib level at $0.16, its all-time low.
A move into this zone would confirm that the broader downtrend remains firmly intact and that recent stabilization attempts lack real momentum.
Approaching this level typically results in thin liquidity and heightened volatility, thereby increasing the risk of a capitulation event.
However, there is still a slim bullish scenario. If buyers step in aggressively, the Pi Network price could attempt a recovery toward the immediate resistance at $0.67.
However, given the current technical landscape, characterized by bearish momentum, weak inflows, and deteriorating structure, a rebound remains highly uncertain.
Disclaimer:
The information provided in this article is for informational purposes only. It is not intended to be, nor should it be construed as, financial advice. We do not make any warranties regarding the completeness, reliability, or accuracy of this information. All investments involve risk, and past performance does not guarantee future results. We recommend consulting a financial advisor before making any investment decisions.
Victor Olanrewaju is a crypto analyst and reporter at CCN with deep roots in on-chain research and technical analysis. His crypto journey began in 2017, but it was the 2020 Uniswap airdrop that sparked a full-time pivot into the space.
With a foundation in copywriting, Victor honed his craft creating high-converting content for leading crypto brokers — most notably an XRP price prediction that ranked #1 on Google during the 2021 bull run.
He later joined AMBCrypto in 2022, where he combined storytelling with technical and on-chain analysis to cover key market narratives.
In 2024, he expanded his expertise at BeInCrypto, collaborating with analysts and using tools like Glassnode, Santiment, and IntoTheBlock to break down Bitcoin and altcoin trends.
At CCN, Victor covers the top cryptocurrencies, memecoins, macro shifts, blending real-time insights with deep-dive metrics.
He holds a Bachelor’s degree in Physics from the University of Ibadan, equipping him to simplify complex data for a wide audience. Follow his work or connect on LinkedIn or X.