OriginalTrail surged following its Upbit listing, but what happens next? | Credit: Hameem Sarwar
Share
Key Takeaways
OriginTrail (TRAC) surged 77% after breaking a 164-day resistance, fueled by its new Upbit listing and rising volume.
The breakout confirmed a double bottom pattern, with $0.50 now acting as the support zone for bullish continuation.
If momentum holds, TRAC’s price could target $1.20, while a drop below $0.50 may trigger a pullback toward $0.40.
TRAC, native to the OriginTrail project, may have unlocked what no one expected.
Over the past, the TRAC crypto price has increased by 77%. In the process, it reached its highest level in over 5 months.
The breakout came shortly after South Korean crypto exchange Upbit officially listed TRAC trading pairs.
But will the altcoin’s market value continue to rise? Let’s find out.
OriginTrail Double Bottom Triggers Breakout
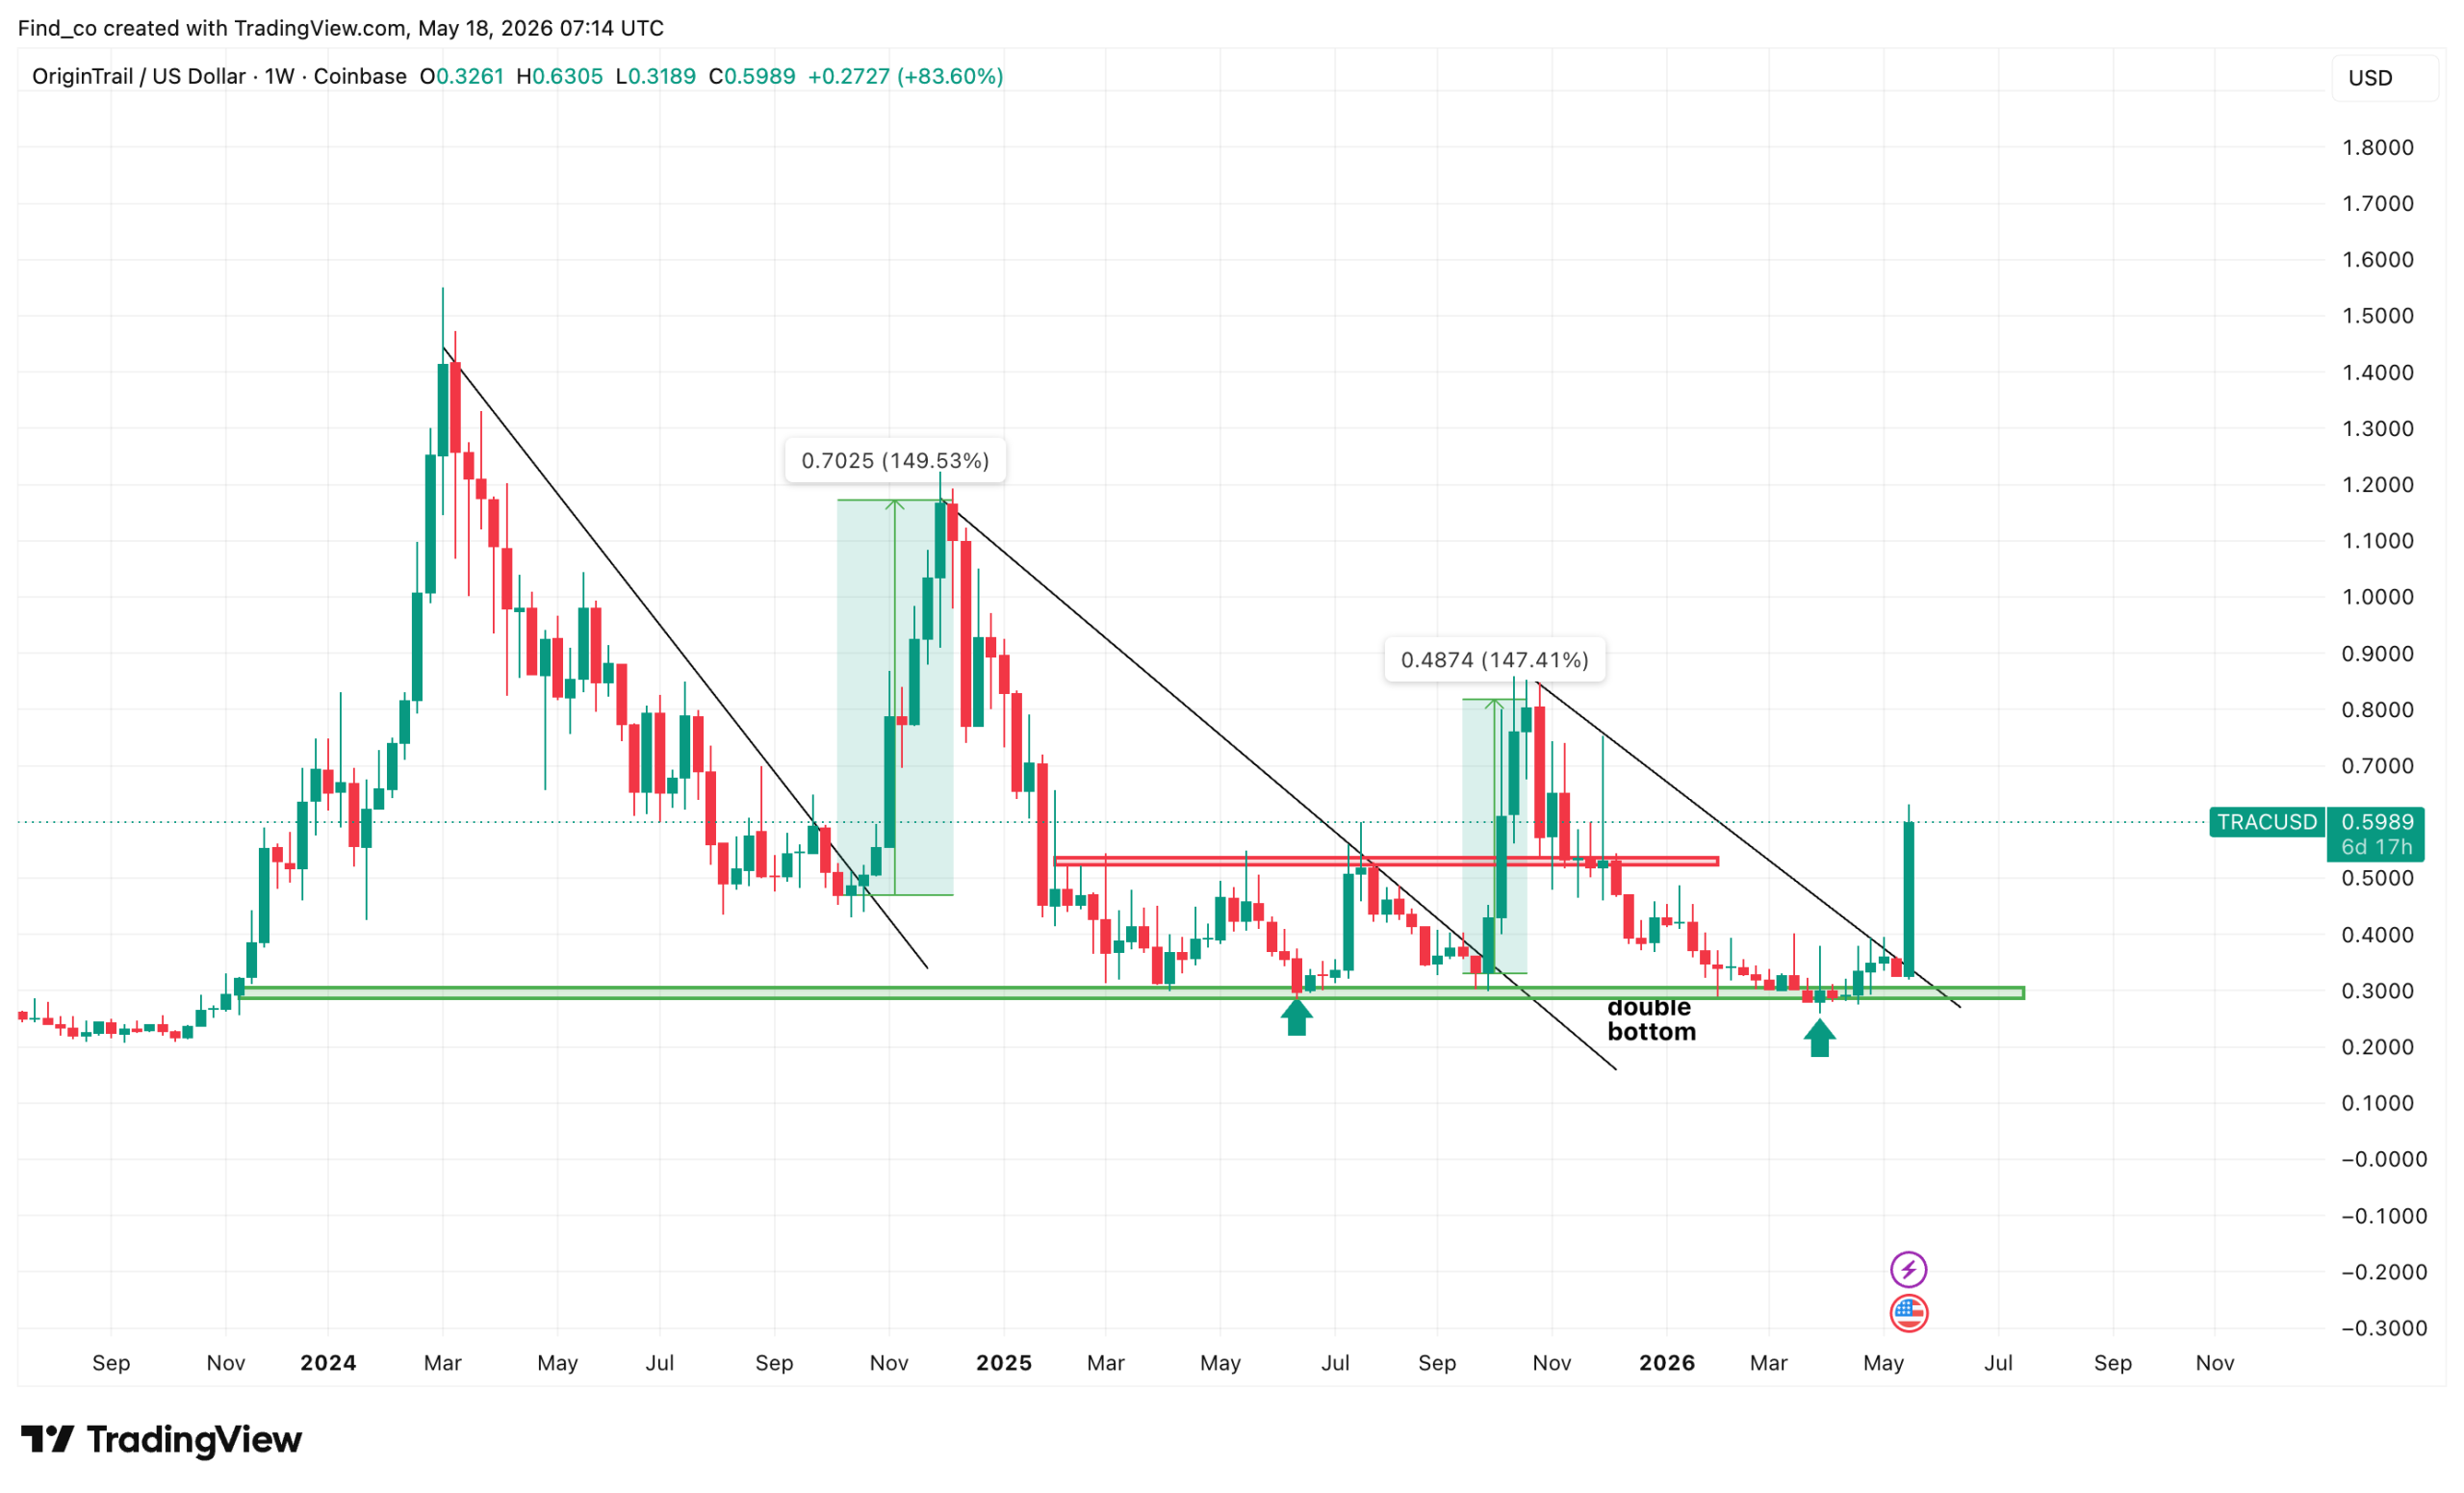
On the weekly chart, the OriginTrail price has broken out of a 164-day resistance after forming a major double bottom around the $0.30 support zone.
As shown below, TRAC has reclaimed the key $0.50 resistance area with a massive breakout candle, signaling a potential trend reversal after months of compression.
Get These Top Crypto Casino Offers Now!
Sponsored
Disclosure
We sometimes use affiliate links in our content, when clicking on those we might receive a commission at no extra cost to you. By using this website you agree to our terms and conditions and privacy policy.
What stands out is the similarity to previous breakout structures on the chart.
In earlier cycles, the TRAC crypto price rallied roughly 147% to $150% after breaking descending resistance.
If the current move follows that historical pattern, the next major upside target sits around $1.20.
However, while TRAC trades near $0.60, the $0.50 region is now the most important level to hold. S
taying above it would confirm the breakout and keep momentum in favor of the bulls. From here, the next resistance zones are around $0.80, followed by the psychological $1 level.
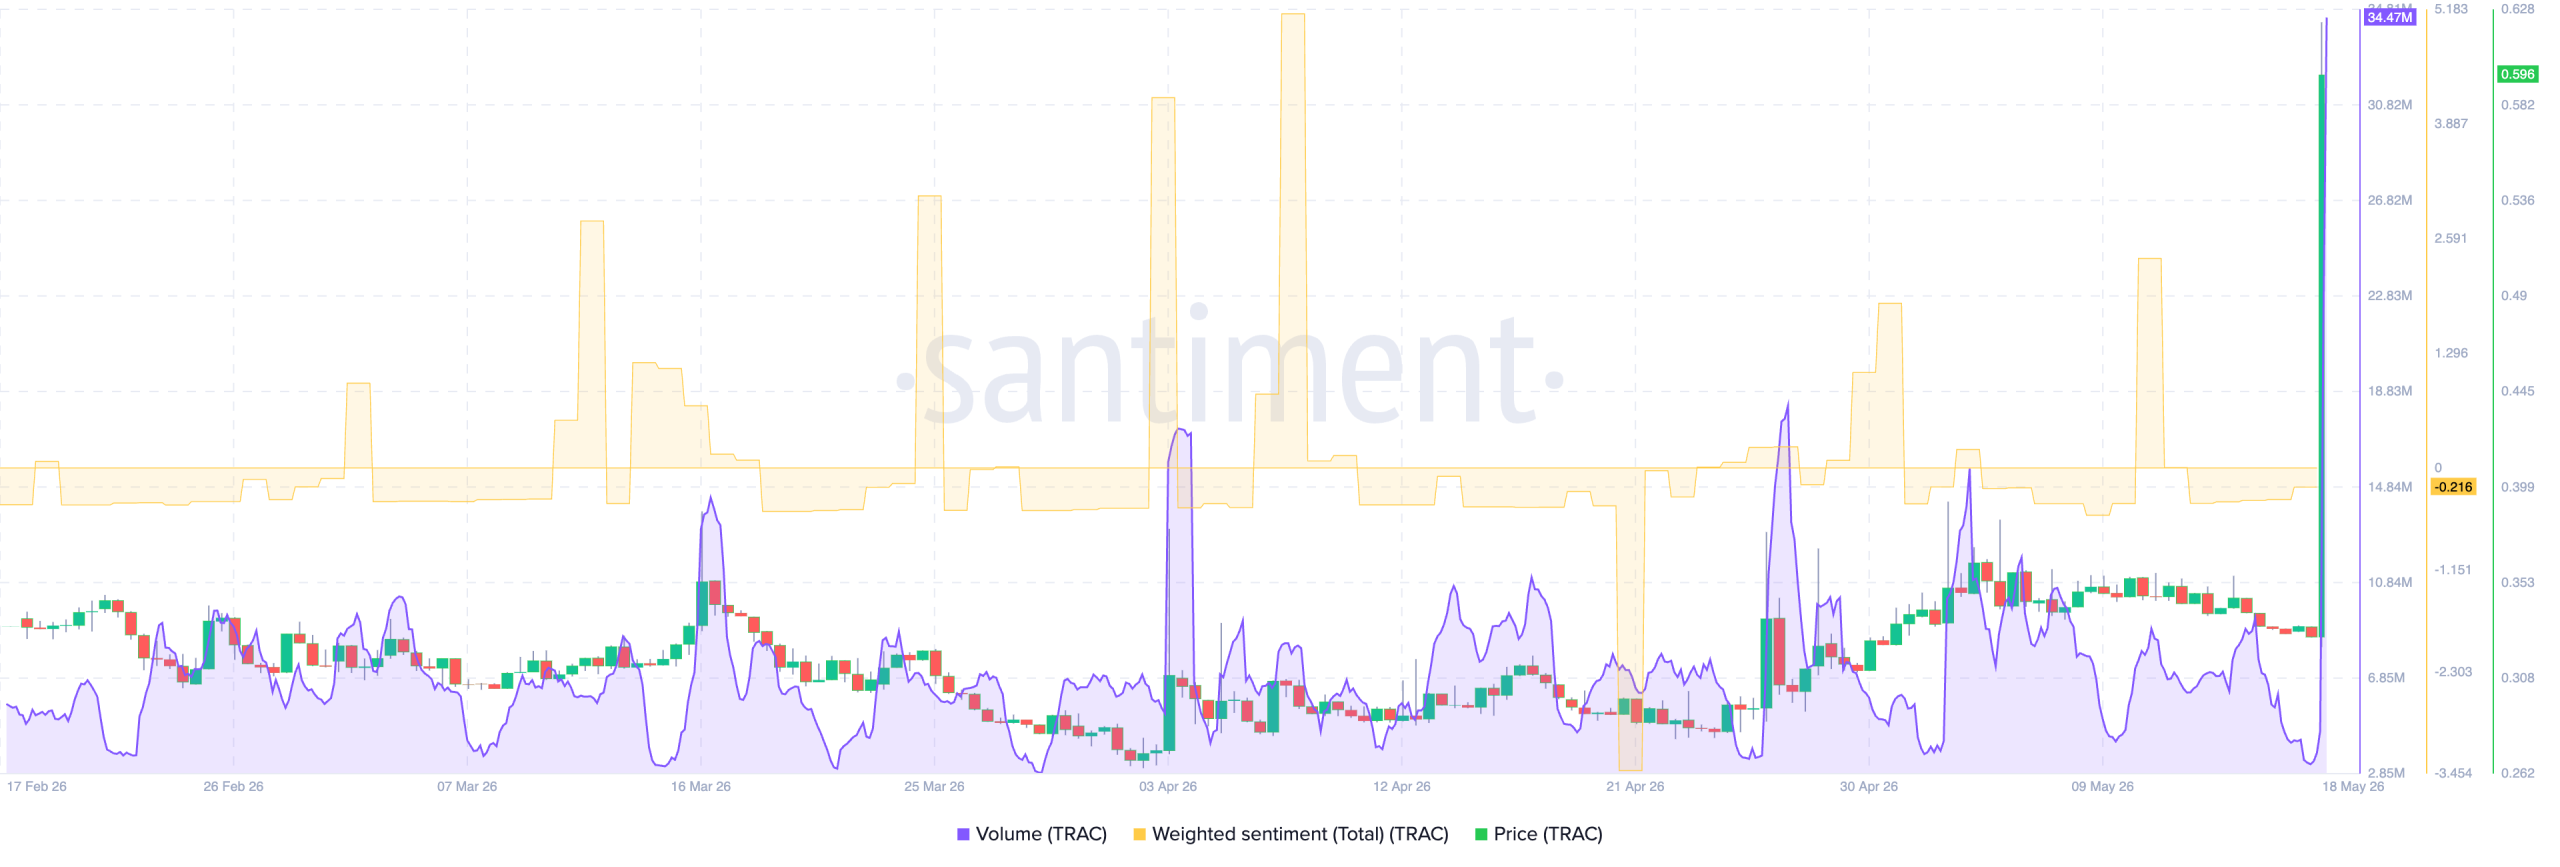
Following the announcement, TRAC experienced an increase in both spot volume and social engagement as traders aggressively rotated into the asset.
According to Santiment data, TRAC is showing a strong bullish divergence between price action and market sentiment.
Volume has exploded to its highest levels in months, confirming that the breakout above long-term resistance is backed by real participation.
At the same time, weighted sentiment remains negative despite the rally.
This usually means the broader market still doubts the move, which can actually support further upside. In crypto, this creates a classic “wall of worry” setup.
TRAC Trading Volume and Weighted Sentiment | Credit: Santiment
So, if TRAC crypto holds above the breakout zone around $0.50, the combination of strong volume and skeptical sentiment could fuel continuation toward the $0.80.
However, the main risk is that such volume spikes can also lead to short-term overheating.
TRAC Price Prediction: $1 Next
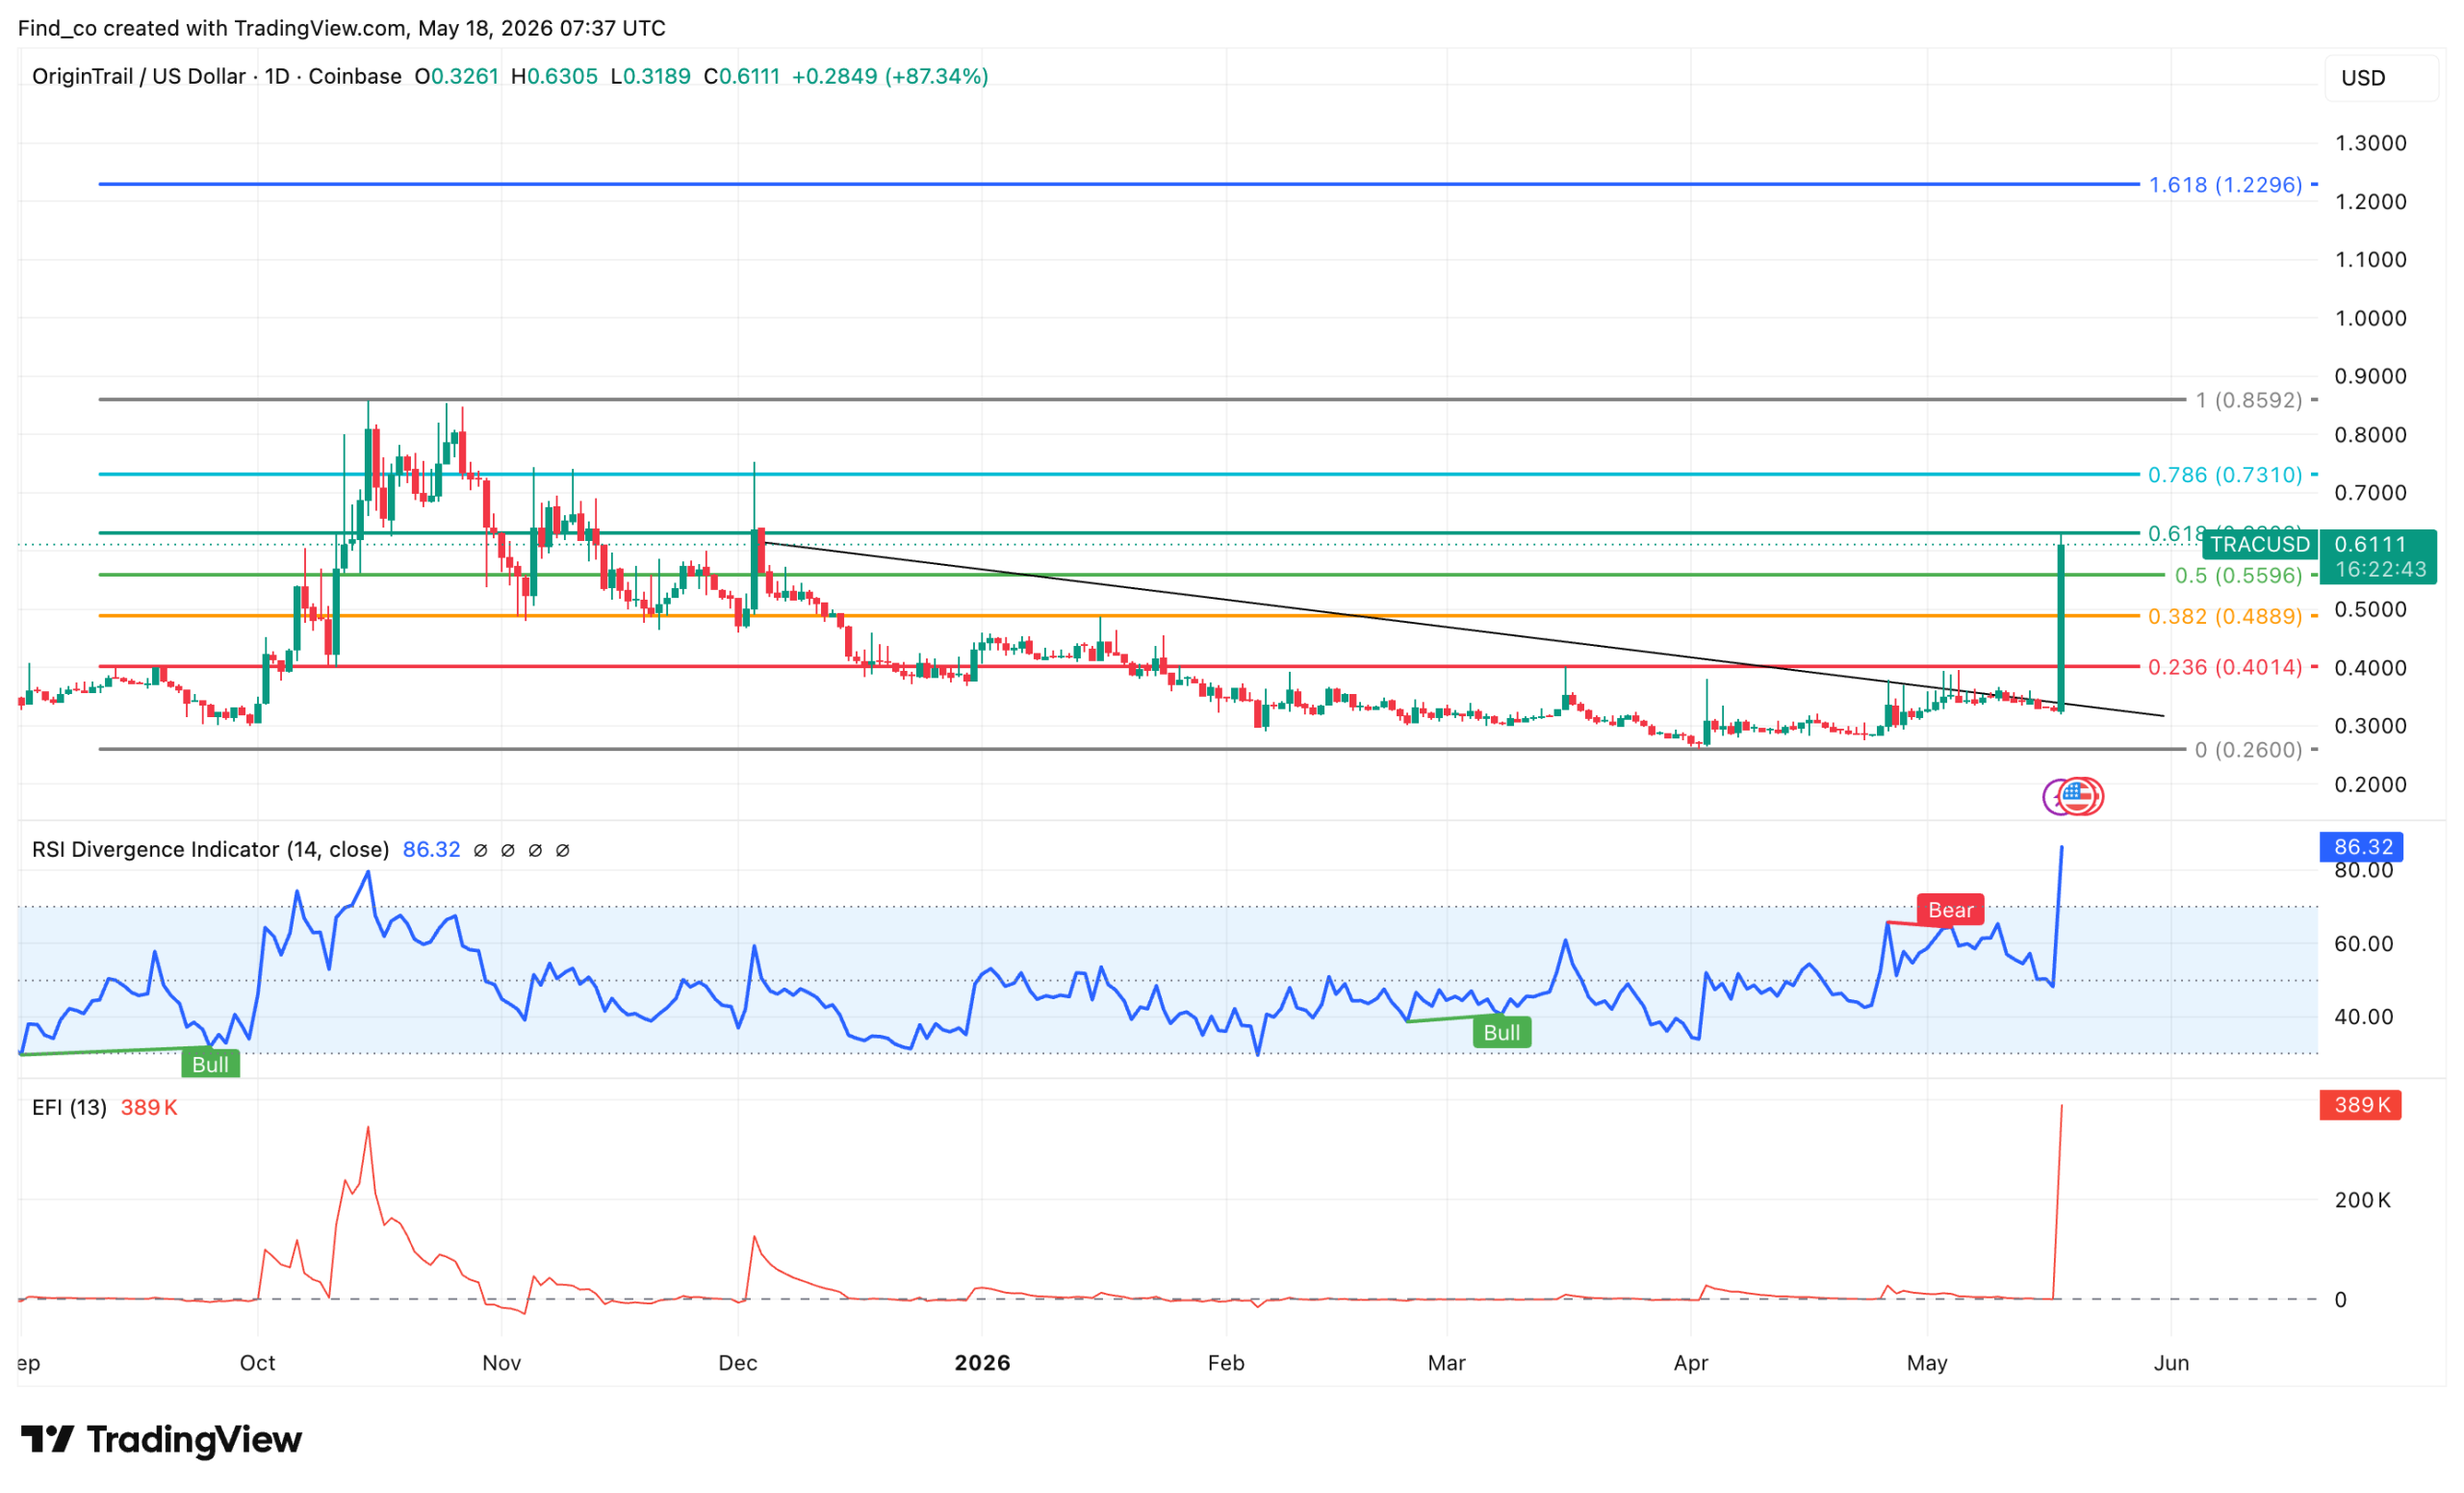
On the daily chart, TRAC has now confirmed a major breakout above its descending resistance, with price reclaiming the key 0.618 Fibonacci level around $0.61.
The move is backed by a massive spike in the Elder Force Index (EFI), indicating rising buying pressure entering the market after months of sideways accumulation.
The next major resistance sits near the 0.786 Fib level around $0.73.
Interestingly, momentum is extremely strong right now. But the Relative Strength Index (RSI) has also surged above 86, signaling overheated conditions in the short term.
That increases the probability of volatility or consolidation before continuation.
Therefore, a breakout above that zone could open the path toward the previous range high near $0.86, followed by the 1.618 extension target around $1.22.
Disclaimer:
The information provided in this article is for informational purposes only. It is not intended to be, nor should it be construed as, financial advice. We do not make any warranties regarding the completeness, reliability, or accuracy of this information. All investments involve risk, and past performance does not guarantee future results. We recommend consulting a financial advisor before making any investment decisions.
Victor Olanrewaju is a crypto analyst and reporter at CCN with deep roots in on-chain research and technical analysis. His crypto journey began in 2017, but it was the 2020 Uniswap airdrop that sparked a full-time pivot into the space.
With a foundation in copywriting, Victor honed his craft creating high-converting content for leading crypto brokers — most notably an XRP price prediction that ranked #1 on Google during the 2021 bull run.
He later joined AMBCrypto in 2022, where he combined storytelling with technical and on-chain analysis to cover key market narratives.
In 2024, he expanded his expertise at BeInCrypto, collaborating with analysts and using tools like Glassnode, Santiment, and IntoTheBlock to break down Bitcoin and altcoin trends.
At CCN, Victor covers the top cryptocurrencies, memecoins, macro shifts, blending real-time insights with deep-dive metrics.
He holds a Bachelor’s degree in Physics from the University of Ibadan, equipping him to simplify complex data for a wide audience. Follow his work or connect on LinkedIn or X.