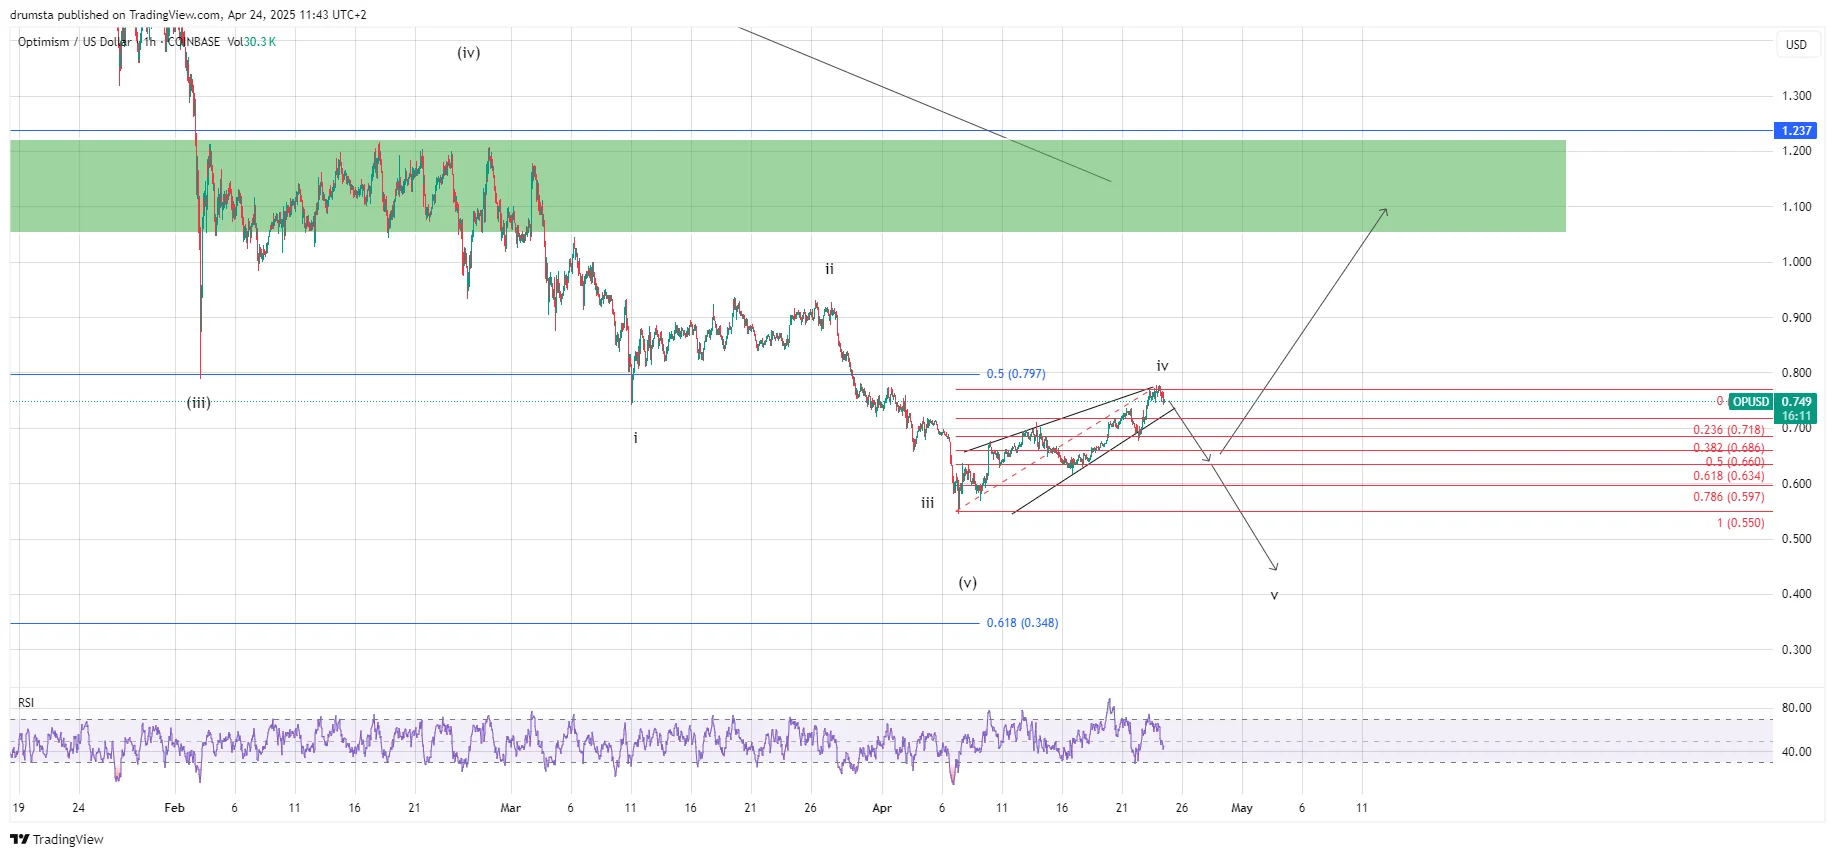
OP price could be ending its recent uptrend. The depth of the expected pullback will provide further insight.
Share
Key Takeaways
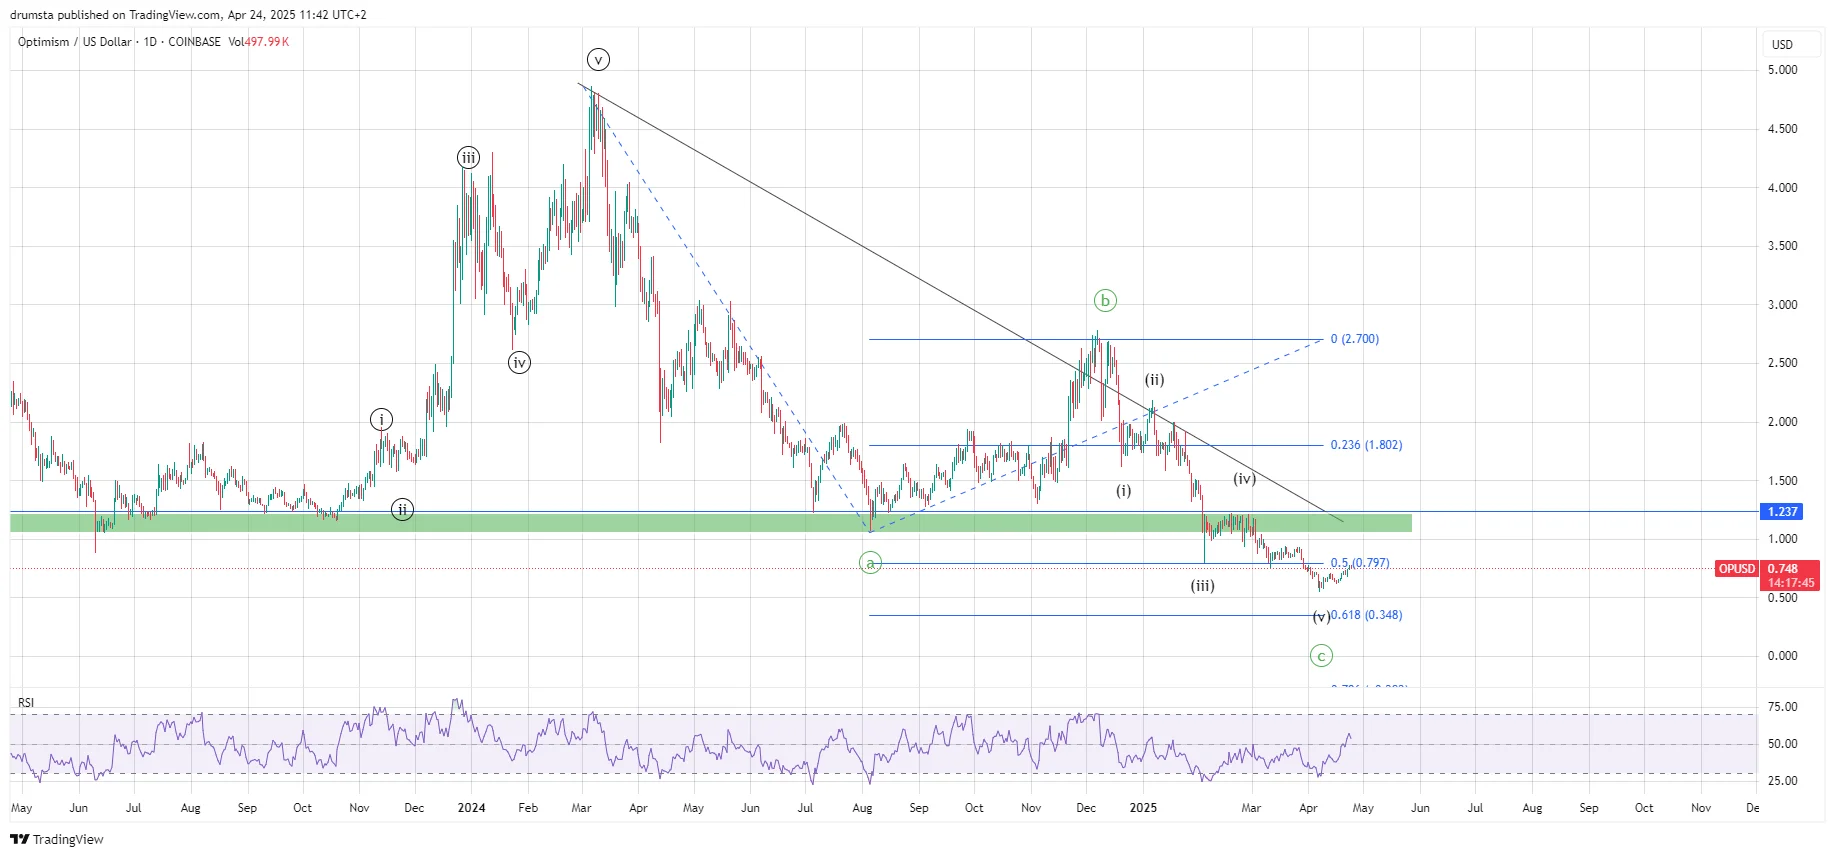
OP trades near critical macro support at $0.75–$0.80.
The current move looks like wave (iv) within a 5-wave decline.
A breakdown from the rising wedge suggests that a wave (v) lower is possible.
Optimism (OP) trades in a corrective zone after a prolonged decline.
A key support region around $0.75–$0.80 is being tested, with mixed signals from different timeframes.
While the daily chart suggests macro downside exhaustion, the lower time frame hints at a potential final wave to the downside unless the current short-term structure invalidates that scenario.
OP Price Analysis
On the daily chart, OP has undergone a full five-wave decline from March 6.2024. high at $4.85.
Disclaimer:
The information provided in this article is for informational purposes only. It is not intended to be, nor should it be construed as, financial advice. We do not make any warranties regarding the completeness, reliability, or accuracy of this information. All investments involve risk, and past performance does not guarantee future results. We recommend consulting a financial advisor before making any investment decisions.
Nikola Lazic is a cryptocurrency analyst and investor working in the industry since 2017. He holds a bachelor's degree in Sociology, which enables him to better understand the psychology behind the crowd´s positioning. Consequently his preferred analytical tool is Elliott Wave Theory in combination with price action analysis.
Combining his experience in trading and investing with knowledge in content writing he strives to bring the most accurate and actionable information.