Will MYX Reach a New All-Time High? | Credit: Derek Fenech
Share
Key Takeaways
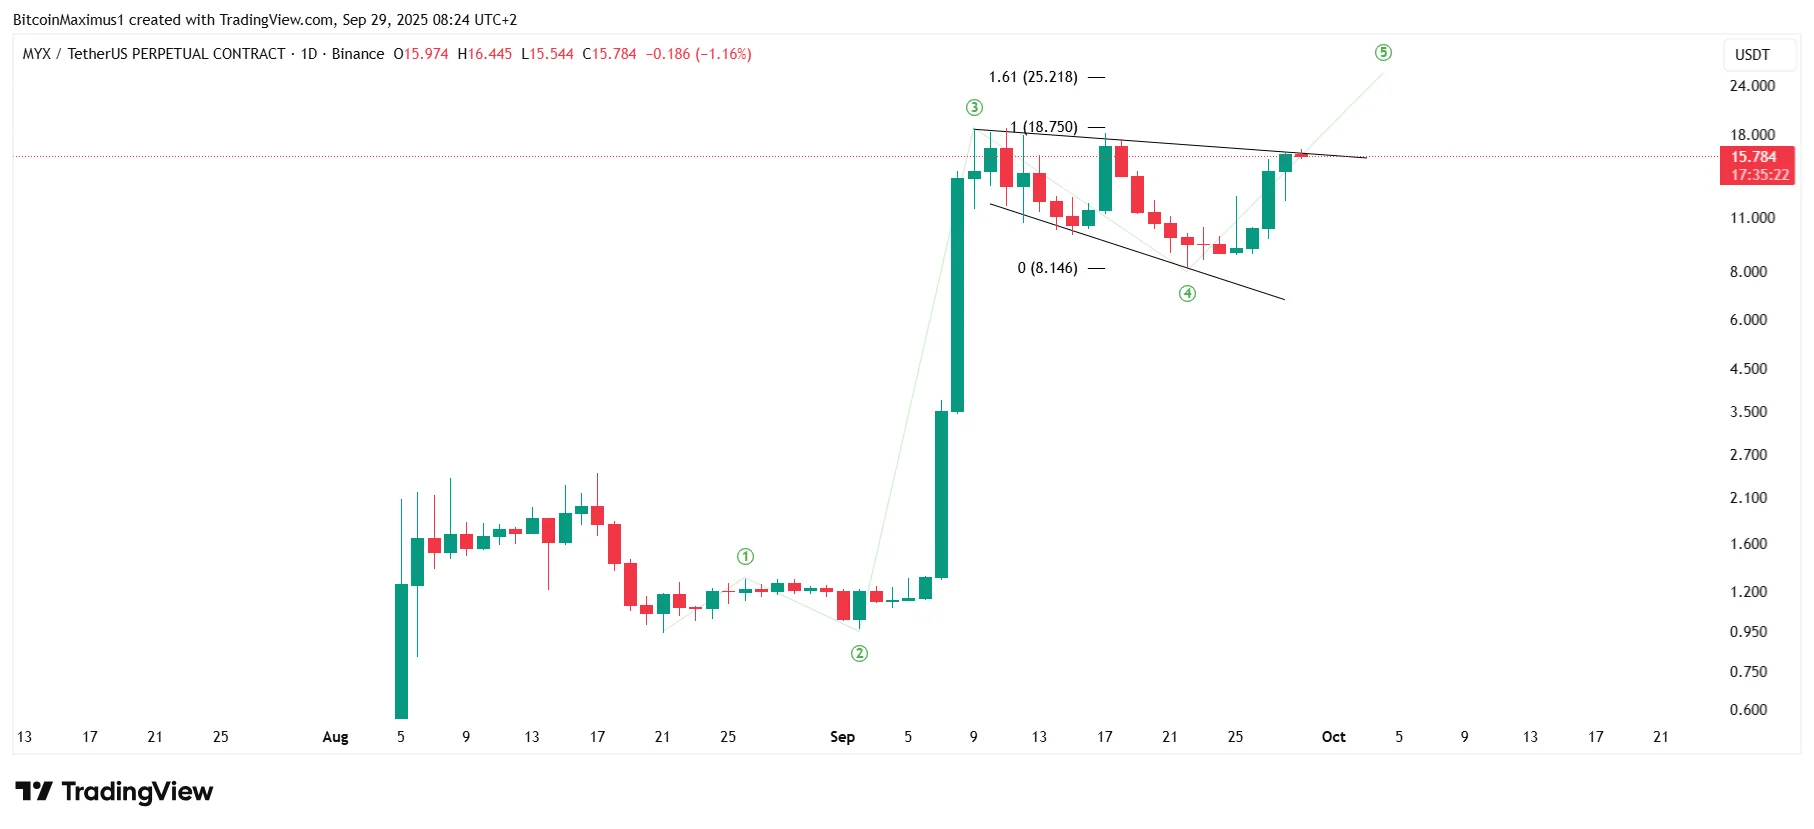
MYX Finance (MYX) follows a descending resistance trend line.
The price is in the fifth and final wave of its upward movement.
Will MYX break out and reach a new all-time high price?
Myx Finance (MYX) increased by over 1,500% in September, hitting a new all-time high of $18.65.
While the price took a breather afterward, it began another rally on Sept. 21, knocking on the door to a new all-time high.
Let’s look at the charts and see what lies ahead in October.
Get These Top Crypto Casino Offers Now!
Sponsored
Disclosure
We sometimes use affiliate links in our content, when clicking on those we might receive a commission at no extra cost to you. By using this website you agree to our terms and conditions and privacy policy.
Momentum indicators have turned bullish, supporting the breakout. The Relative Strength Index (RSI) broke out from a diagonal resistance, and the Moving Average Convergence/Divergence (MACD) made a bullish cross.
So, the daily time frame technical analysis gives a bullish MYX prediction, suggesting the price will break out to new highs.
New MYX All-Time High
Adding to the price action, the wave count suggests that the MYX trend is bullish and a breakout is imminent.
According to the count, MYX is in the fifth and final wave of the upward movement that started on Aug. 21.
Valdrin Tahiri is a cryptocurrency analyst and reporter at CCN, specializing in technical analysis with a focus on Elliott Wave theory, on-chain metrics, and fundamental research. He brings over seven years of experience in the crypto space as both a trader and writer.
He discovered cryptocurrencies in 2017 while earning his MSc in Financial Markets at the Barcelona School of Economics, which sparked a deep interest in blockchain and market dynamics. Since then, he’s contributed to top crypto outlets like BeInCrypto and CoinGape.
Valdrin also served as Community Manager of BeInCrypto’s Telegram group for three years, helping grow it into one of the largest crypto communities worldwide. His expertise in market structure and price patterns allows him to break down complex trends into clear, actionable insights.
He’s published thousands of articles covering altcoins, Bitcoin cycles, and macro trends.