Home / Analysis / Crypto / Technical Analysis / Memecore (M) Ignores ZachXBT’s ‘Red Flag’ Warning, Rallies 50% After RAVE Token Collapse — ATH Could Be Next
MemeCore continues rising despite warnings of insider control and weak fundamentals.
Limited supply and exchange backing support the rally, but low organic demand raises concerns.
While upside may continue if support holds, the structure remains vulnerable to corrections.
ZachXBT’s warnings have ended more rallies than most traders care to count.
Recently, RaveDAO’s (RAVE) collapse only added fuel to the fire. Yet, Memecore (M), a token that the on-chain sleuth warned about, is up 50% in the last seven days — unfazed, unbroken, and apparently unbothered by any of it.
That kind of price action in the middle of a storm this size demands an explanation. Is the market pricing in information ZachXBT does not have?
That includes extreme insider control, low organic demand, and questionable market activity.
The warning was clear. But the market didn’t react the way it usually does.
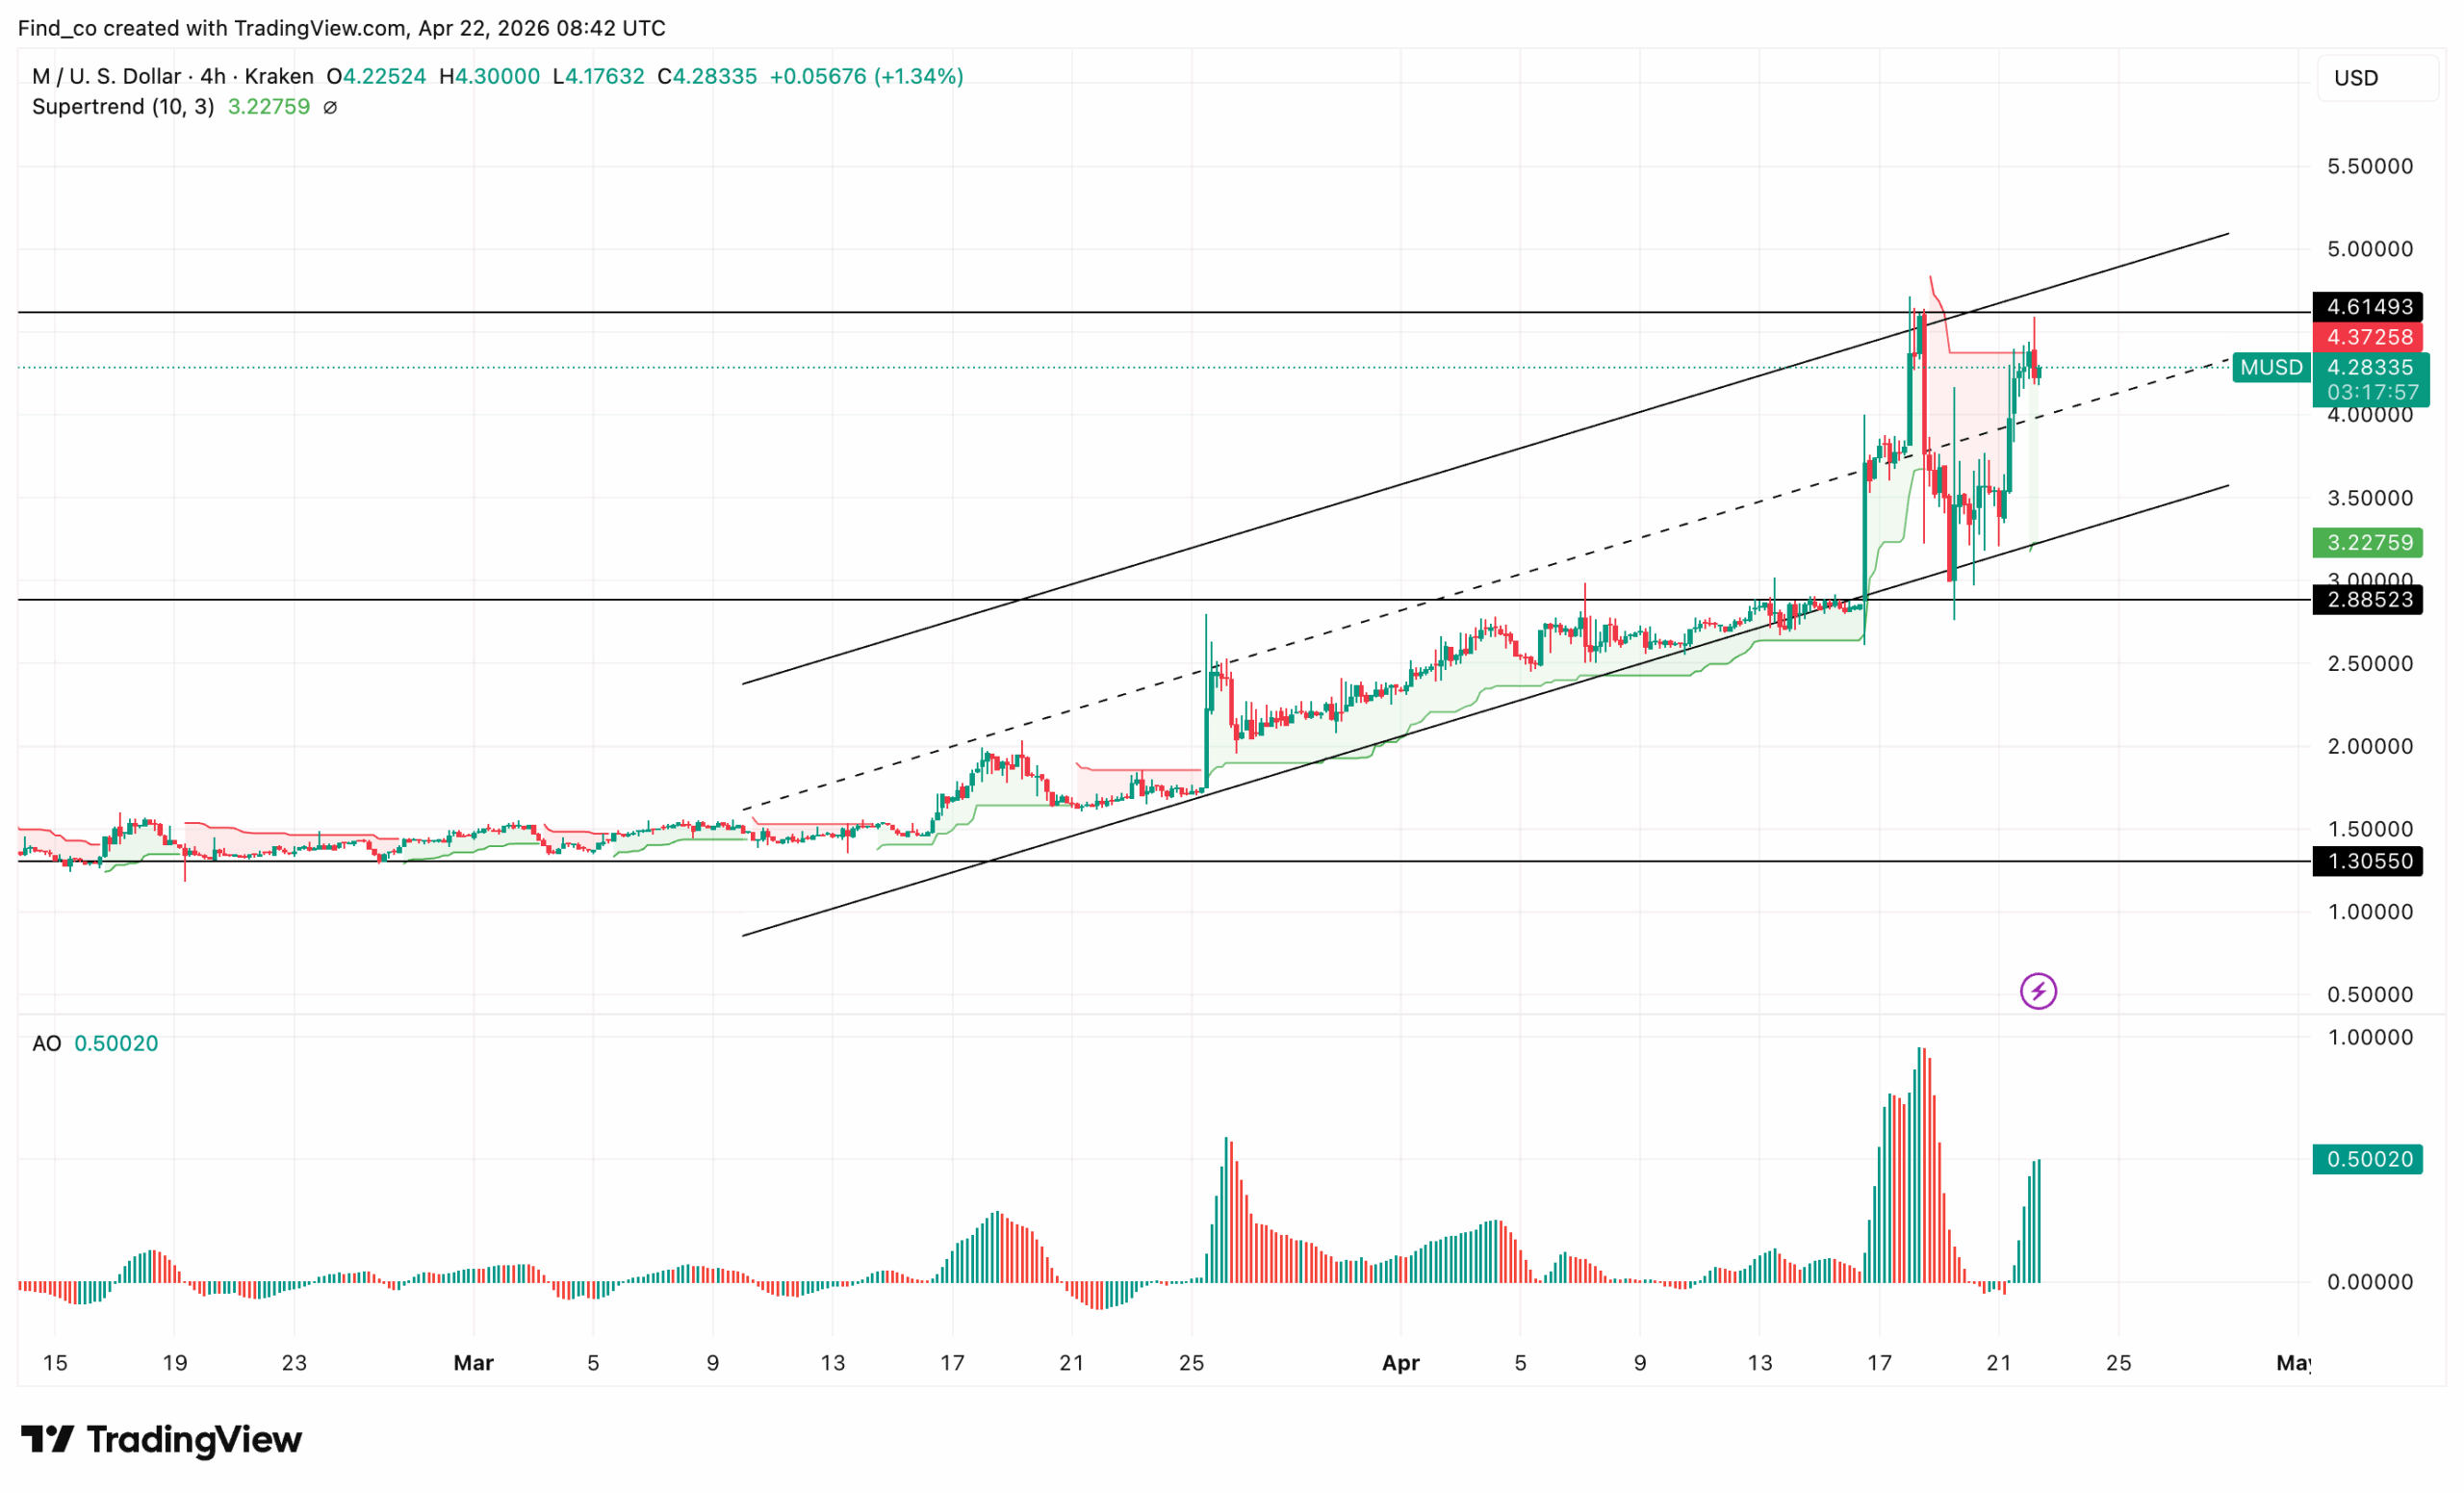
Instead, the MemeCore price has been trending inside a clear ascending channel. However, it has recently pulled back from the upper boundary near $4.60, while still holding structure above the mid-channel.
The uptrend is still intact, as price is making higher lows and continues to respect the channel support, while the Supertrend remains below price, indicating ongoing bullish control.
Momentum had expanded strongly during the breakout, and although it briefly cooled off, it is now picking up again.
In the short term, the M token price is consolidating just below resistance, suggesting continuation rather than an immediate reversal.
If MemeCore holds above the $3.35 support (channel mid/Supertrend area), it could continue grinding higher and attempt another breakout toward $5 resistance, potentially extending to $5.50 if momentum accelerates.
Is the “RAVE Pattern” Back?
Despite the bullish technical setup, ZachXBT’s comparison with RAVE matters.
According to ZachXBT, MemeCore shares the same setup that drove RAVE higher — before it collapsed.
The biggest concern? Supply concentration.
He publicly challenged the project to explain how it reached a multi-billion dollar valuation while insiders allegedly control over 90% of the supply.
“Please provide a single data point to support your $6B mkt cap at a top 20 token and why insiders hold >90% of supply,” He questioned after Grayscale recognized it.
That kind of structure isn’t neutral. It’s powerful. Because whoever controls supply controls price.
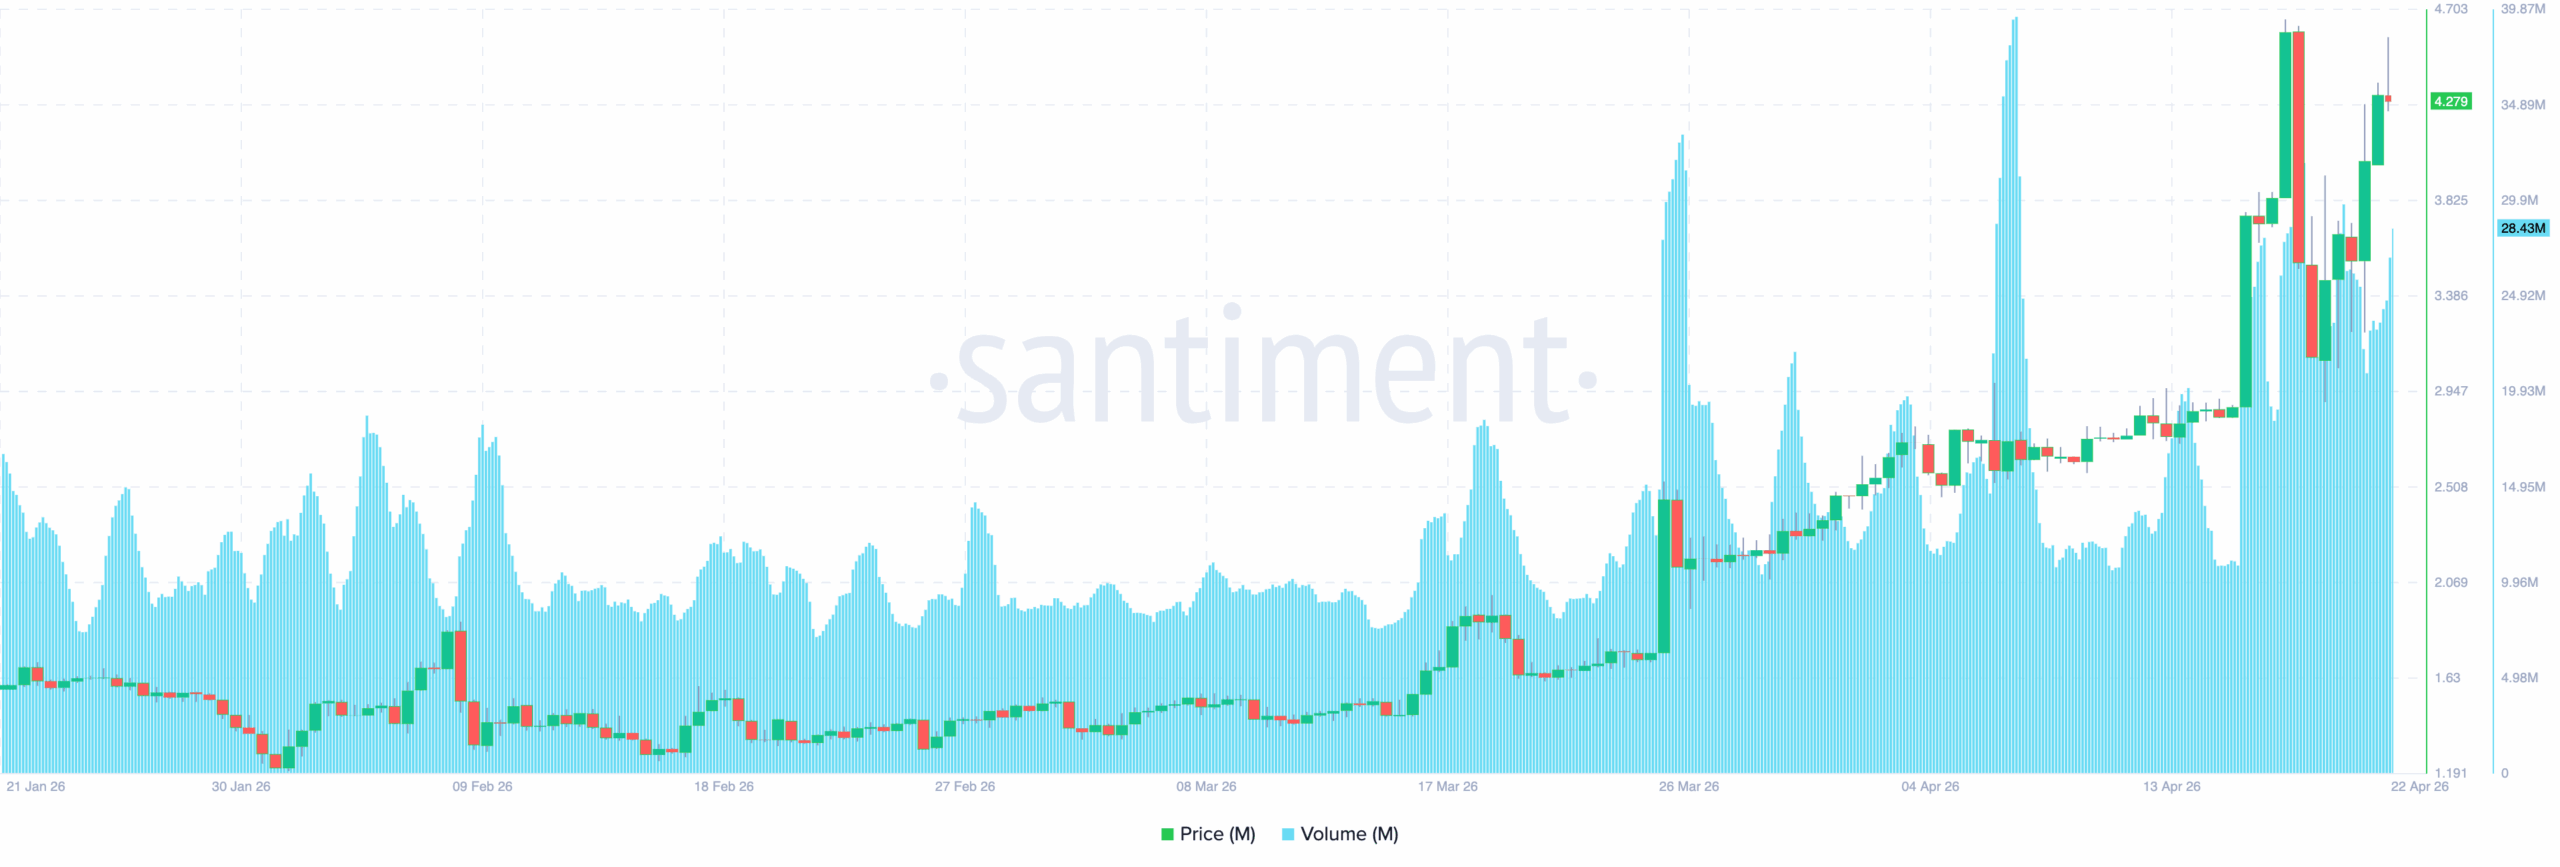
Then there’s usage. Despite ranking inside the top 20 cryptos by market cap, MemeCore shows surprisingly weak engagement.
Social activity is low, while volume is below $30 million.
That’s not what you expect from a multi-billion-dollar project.
It suggests something else is driving the M token price, but it might not be adoption.
So, Why Is Price Still Going Up?
This is where things flip. The rally isn’t happening despite the warnings. It’s happening because of them.
After the RAVE token collapse, many traders rushed to short MemeCore. They expected it to be next.
But that created a trap. With insiders controlling most of the supply, liquidity becomes limited. That makes it easy to move the price.
So when short positions piled up, the market turned.
Price started rising. Shorts got squeezed. Positions were liquidated, and forced buying pushed the price even higher.
It’s the same playbook, but a different token. However, there’s another layer: liquidity.
Right now, Binance-linked wallets reportedly hold over 41% of the MemeCore supply, while Kraken has recently listed it.
That matters because as long as major exchanges continue supporting the token, the market structure remains intact.
If sustained, this gives market makers room to operate and maintain the illusion of stability.
“Ghost Market Cap” Problem Exists
Then comes valuation, and this is where things could get messy.
Different platforms show different numbers:
CoinGecko places MemeCore near a $6 billion market cap
CoinMarketCap shows roughly $4.85 billion
However, on-chain data point to a deeper issue. If supply is highly concentrated, “circulating supply” may not reflect true liquidity. That creates what some describe as a “paper wealth” bubble.
As it stands, MemeCore’s price looks strong. But the foundation is sitting on thin ice.
M Price Prediction
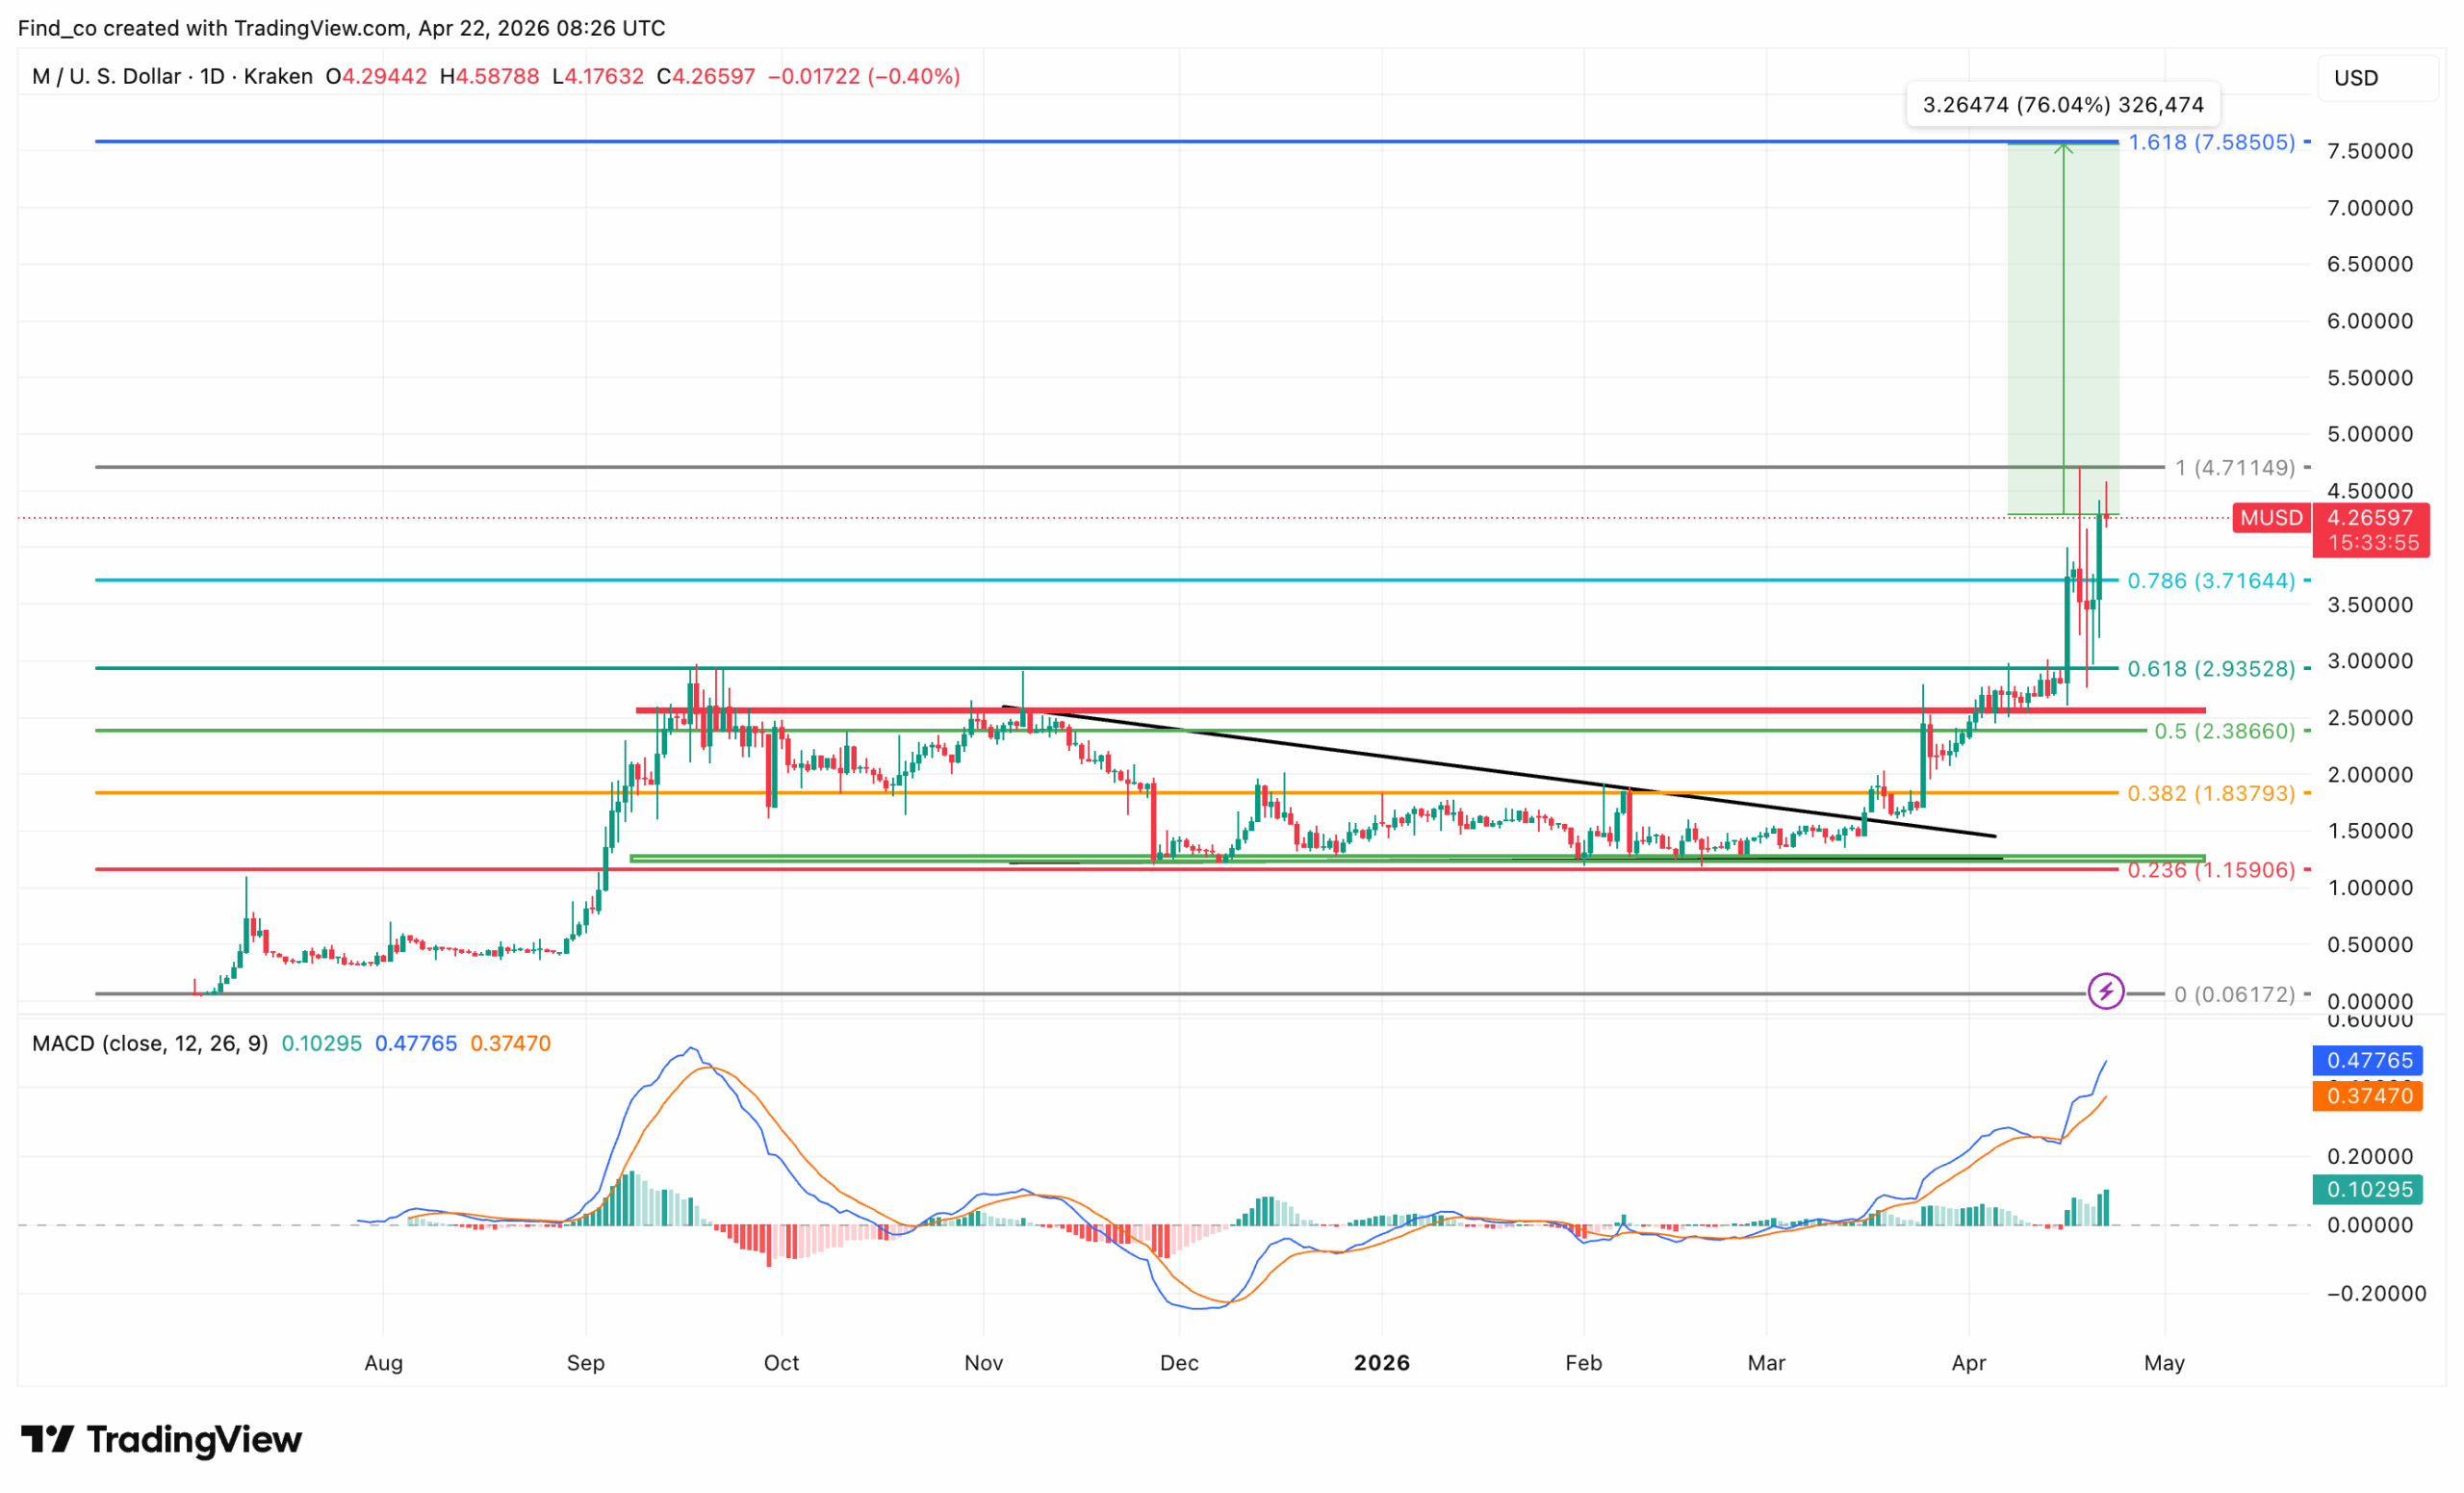
MemeCore’s price has continued to surge past its long-term accumulation range. At the time of writing, it is now trading well above the prior major resistance around $2.50, which has flipped into support.
Furthermore, the M price has been moving higher, and momentum remains strong. Notably, the Moving Average Convergence Divergence (MACD) has been trending higher, with the bullish histogram strength increasing.
This shows that buyers have been in control, and pressure has been building.
However, the recent sharp move toward $4.50 has continued, and the price is now trading well above the breakout base.
If the M/USD pair holds above the $2.60 support zone, the trend could continue, and the price could push above $5 soon.
In a highly bullish market condition, the cryptocurrency’s value could rise to $7.59, marking a new all-time high.
But if momentum starts fading and price pulls back, MemeCore’s price could retrace toward $3, where the breakout structure would likely be retested before any further upside
Disclaimer:
The information provided in this article is for informational purposes only. It is not intended to be, nor should it be construed as, financial advice. We do not make any warranties regarding the completeness, reliability, or accuracy of this information. All investments involve risk, and past performance does not guarantee future results. We recommend consulting a financial advisor before making any investment decisions.
Victor Olanrewaju is a crypto analyst and reporter at CCN with deep roots in on-chain research and technical analysis. His crypto journey began in 2017, but it was the 2020 Uniswap airdrop that sparked a full-time pivot into the space.
With a foundation in copywriting, Victor honed his craft creating high-converting content for leading crypto brokers — most notably an XRP price prediction that ranked #1 on Google during the 2021 bull run.
He later joined AMBCrypto in 2022, where he combined storytelling with technical and on-chain analysis to cover key market narratives.
In 2024, he expanded his expertise at BeInCrypto, collaborating with analysts and using tools like Glassnode, Santiment, and IntoTheBlock to break down Bitcoin and altcoin trends.
At CCN, Victor covers the top cryptocurrencies, memecoins, macro shifts, blending real-time insights with deep-dive metrics.
He holds a Bachelor’s degree in Physics from the University of Ibadan, equipping him to simplify complex data for a wide audience. Follow his work or connect on LinkedIn or X.