MemeCore completed its hard fork on March 25, sending M up and printing its longest single-day green candle of the year.
M’s technical indicators confirm the accelerating buy-side momentum.
M’s funding rate has remained positive since March 3, signaling that leveraged buyers have been building positions in anticipation of the hard fork — and are betting on further upside toward the $3.02 all-time high.
M, the native coin of MemeCore, the layer-1 blockchain built for memes, is today’s standout performer. Its price has surged by double digits, while the market has otherwise logged broad declines.
At the time of writing, M is up 39% on the day, with trading volume soaring by over 130% as buyers pile in.
Why is this happening?
MemeCore Completes Hard Fork
Yesterday, MemeCore completed the second and final hard fork it announced last month. The first, executed on March 18, lowered gas prices to 1,500 gwei.
The second, completed on March 25, introduced new features, including Account Abstraction, L2 scalability, and significant architectural upgrades.
After the hard fork was announced as complete, M shot up, surging to a daily high of $2.79 yesterday as demand climbed sharply.
The move printed the longest single-day green candlestick M has recorded year-to-date, a clear signal that the market had been anticipating the upgrade and moved aggressively once it was confirmed.
With buy-side pressure still persisting, the question now is whether M can sustain this momentum and push toward reclaiming its all-time high of $3.02.
M’s Bulls Are Firmly in Control
M’s technical setup on the 1-day chart confirms the growing demand for the altcoin.
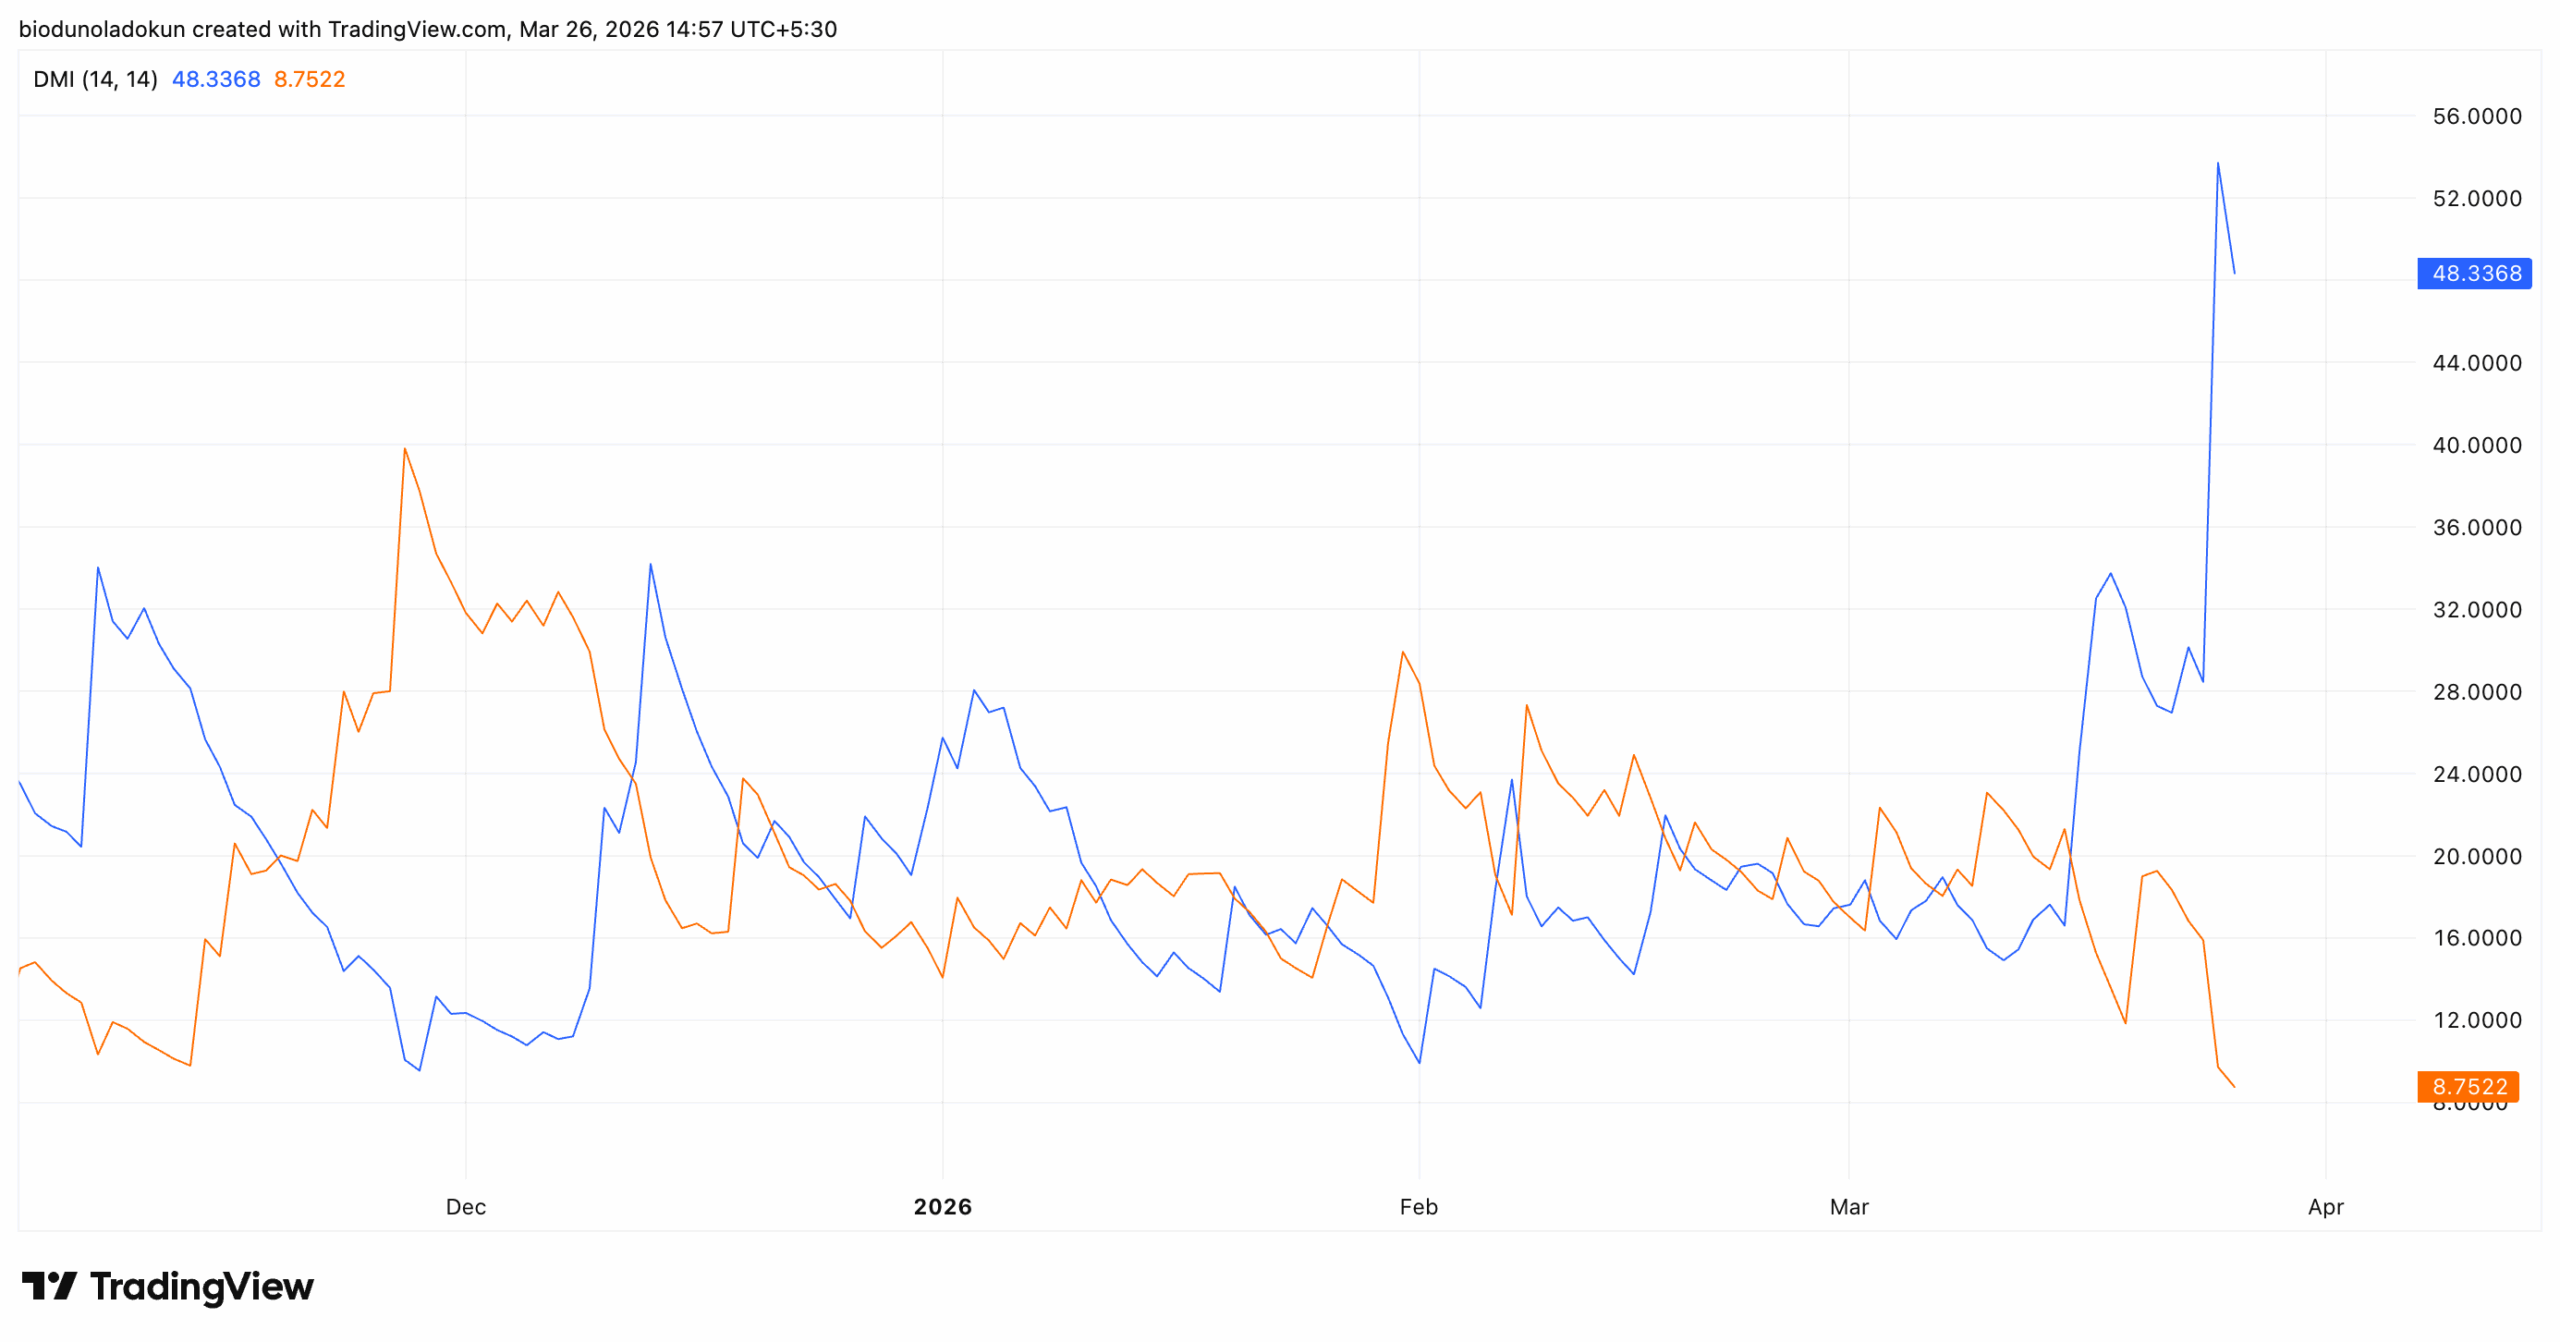
Readings from the coin’s Directional Movement Index (DMI) show its positive directional index (+DI) resting above the negative directional index (-DI) at press time.
The DMI indicator measures the strength of an asset’s price trend. It consists of two lines: the +DI, which represents upward price movement, and the -DI, which represents downward price movement.
When the +DI is above the -DI, as it is with M, the market trend is considered bullish. This means buyers are firmly in control, and upward momentum is dominant.
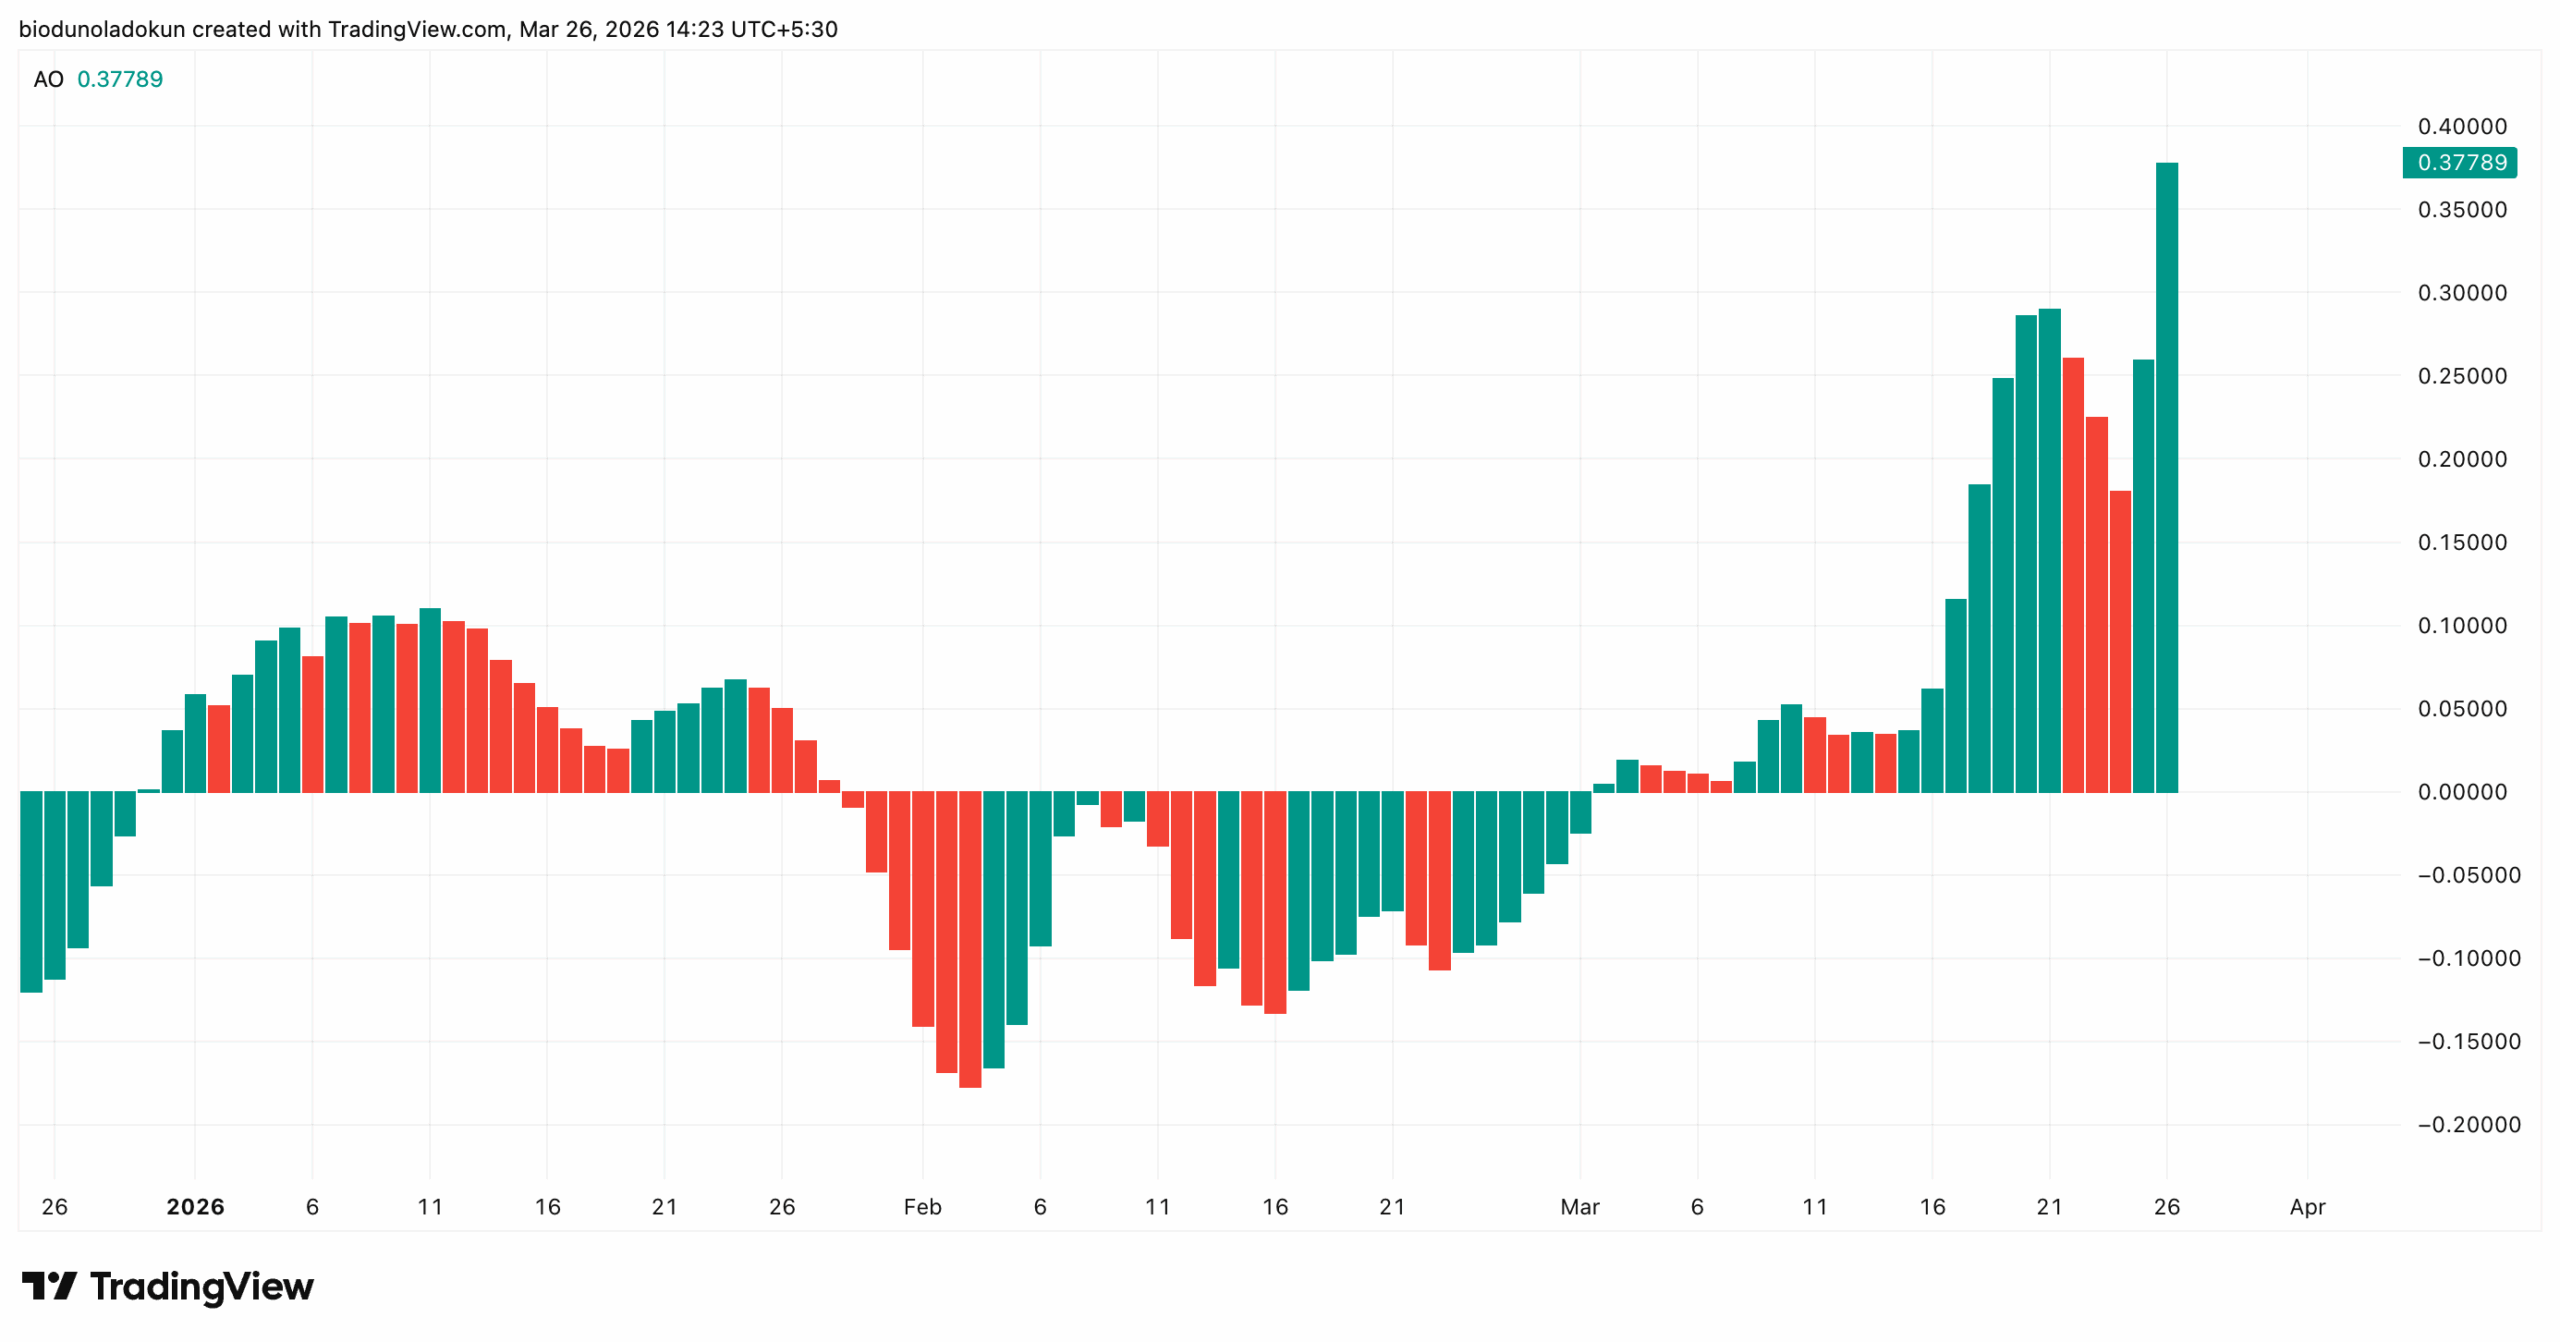
Furthermore, M’s Awesome Oscillator has surged sharply over the past two sessions, printing its highest reading since the year began. At press time, this momentum indicator stands at 0.37.
The Awesome Oscillator compares an asset’s current market momentum with its longer-term momentum, helping identify potential trend shifts. When it shows green histogram bars and positive values, it indicates strong momentum and increasing bullish sentiment.
This signals that demand is accelerating and that M buyers are increasingly overpowering sellers.
Leveraged Buyers Continue To Bet on M
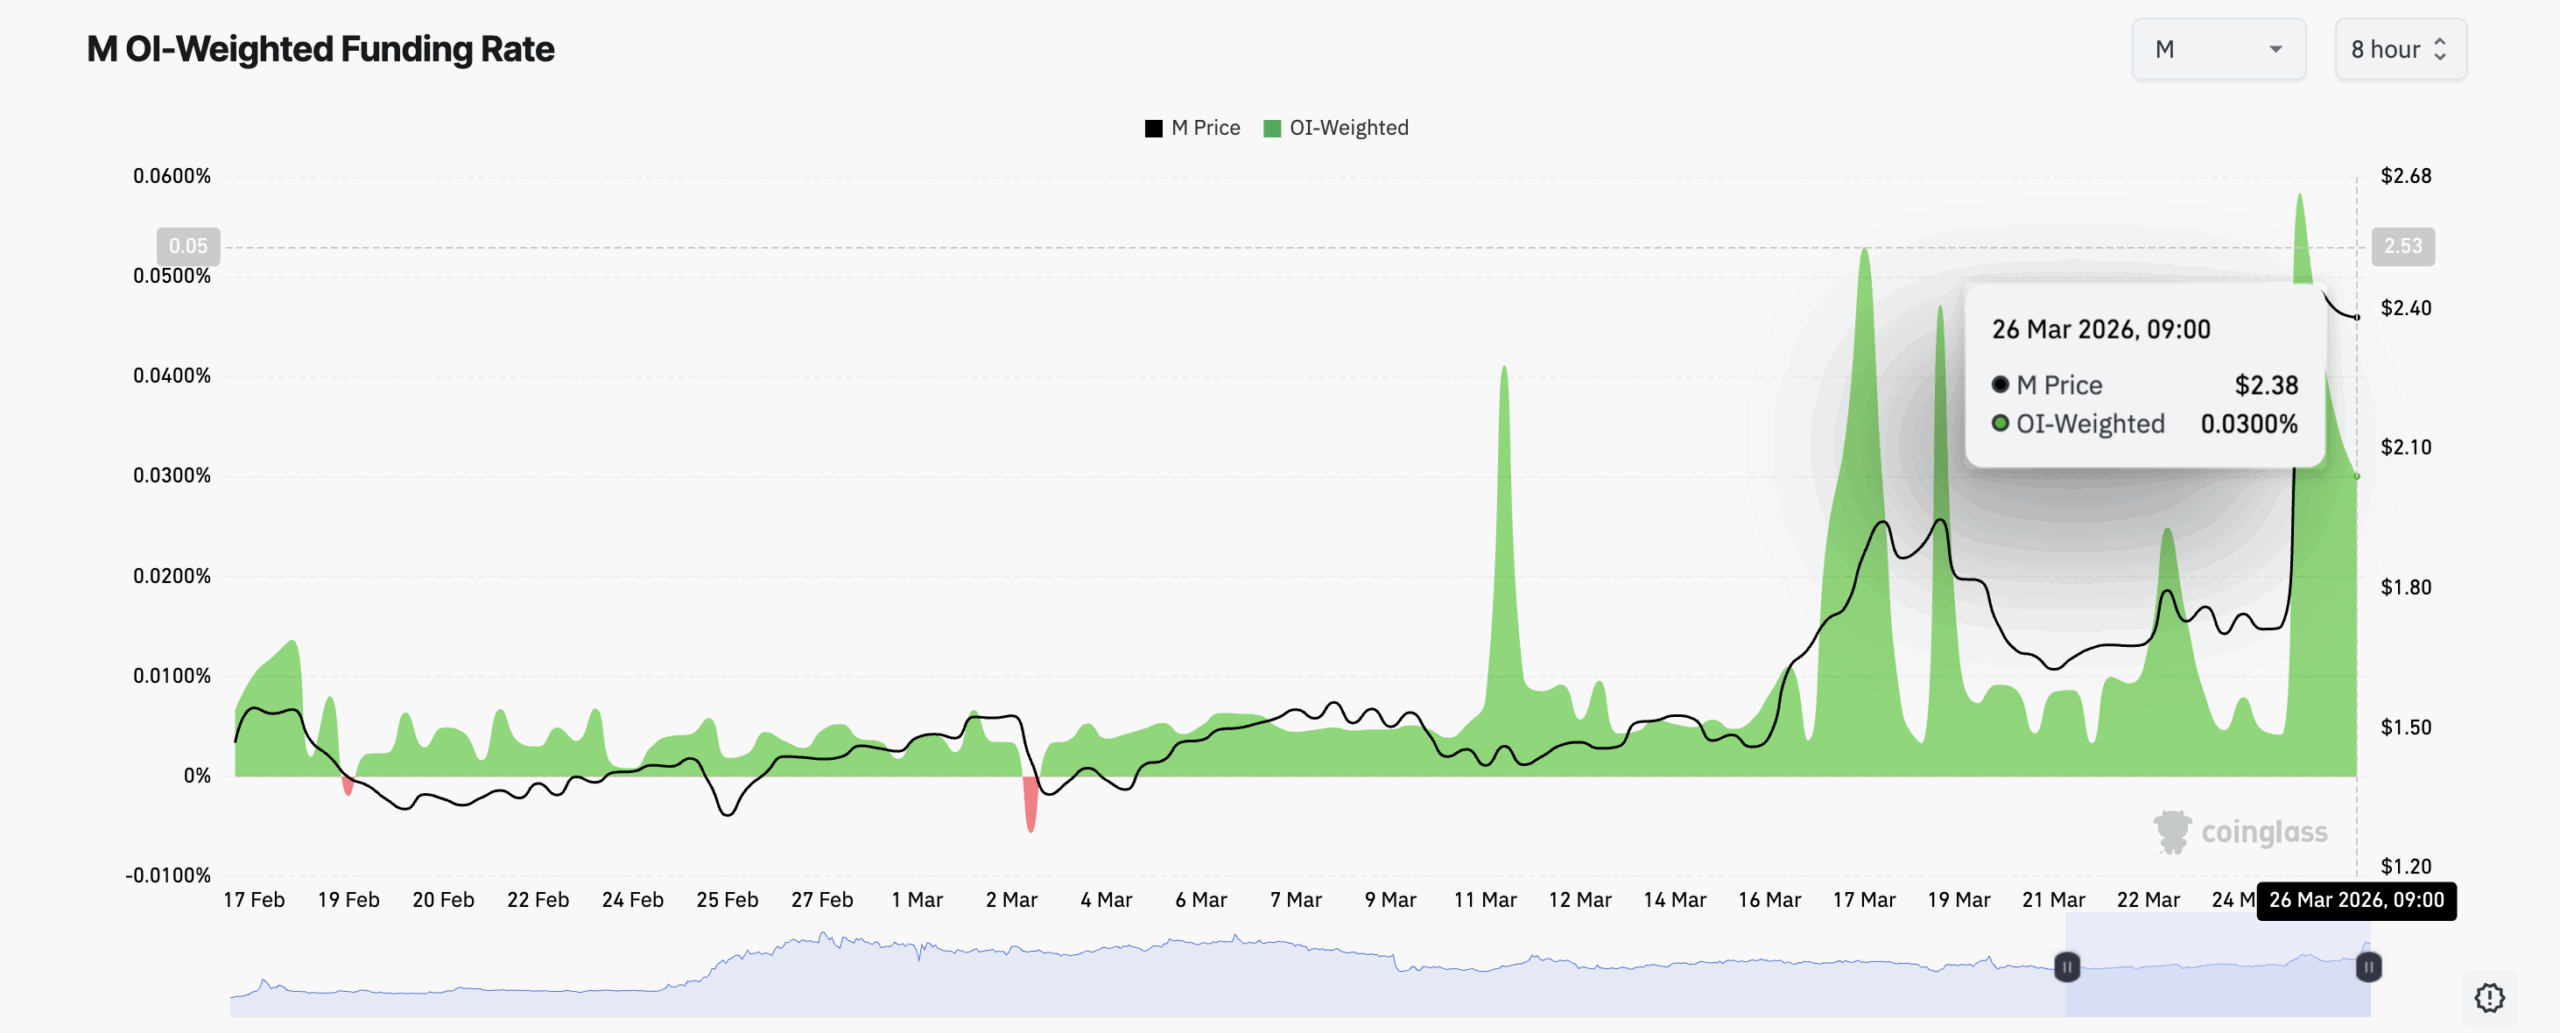
In the derivatives market, the trend is no different. M’s funding rate has remained positive since March 3, indicating that long traders have been paying short traders to hold their positions all month as the market awaited the hard fork’s completion. At press time, it stands at 0.030%.
The funding rate is the periodic payment exchanged between long and short futures contract holders based on the difference between an asset’s spot price and futures price.
When an asset’s funding rate is positive, it means that long position holders are paying short, indicating a strong bullish bias.
If an asset’s funding rate remains positive during a price rally, as M’s, it suggests that demand is not confined to the spot market alone but is being reinforced by leveraged buyers betting on further upside.
M Eyes $3.02 All-Time High but Must First Clear this Level
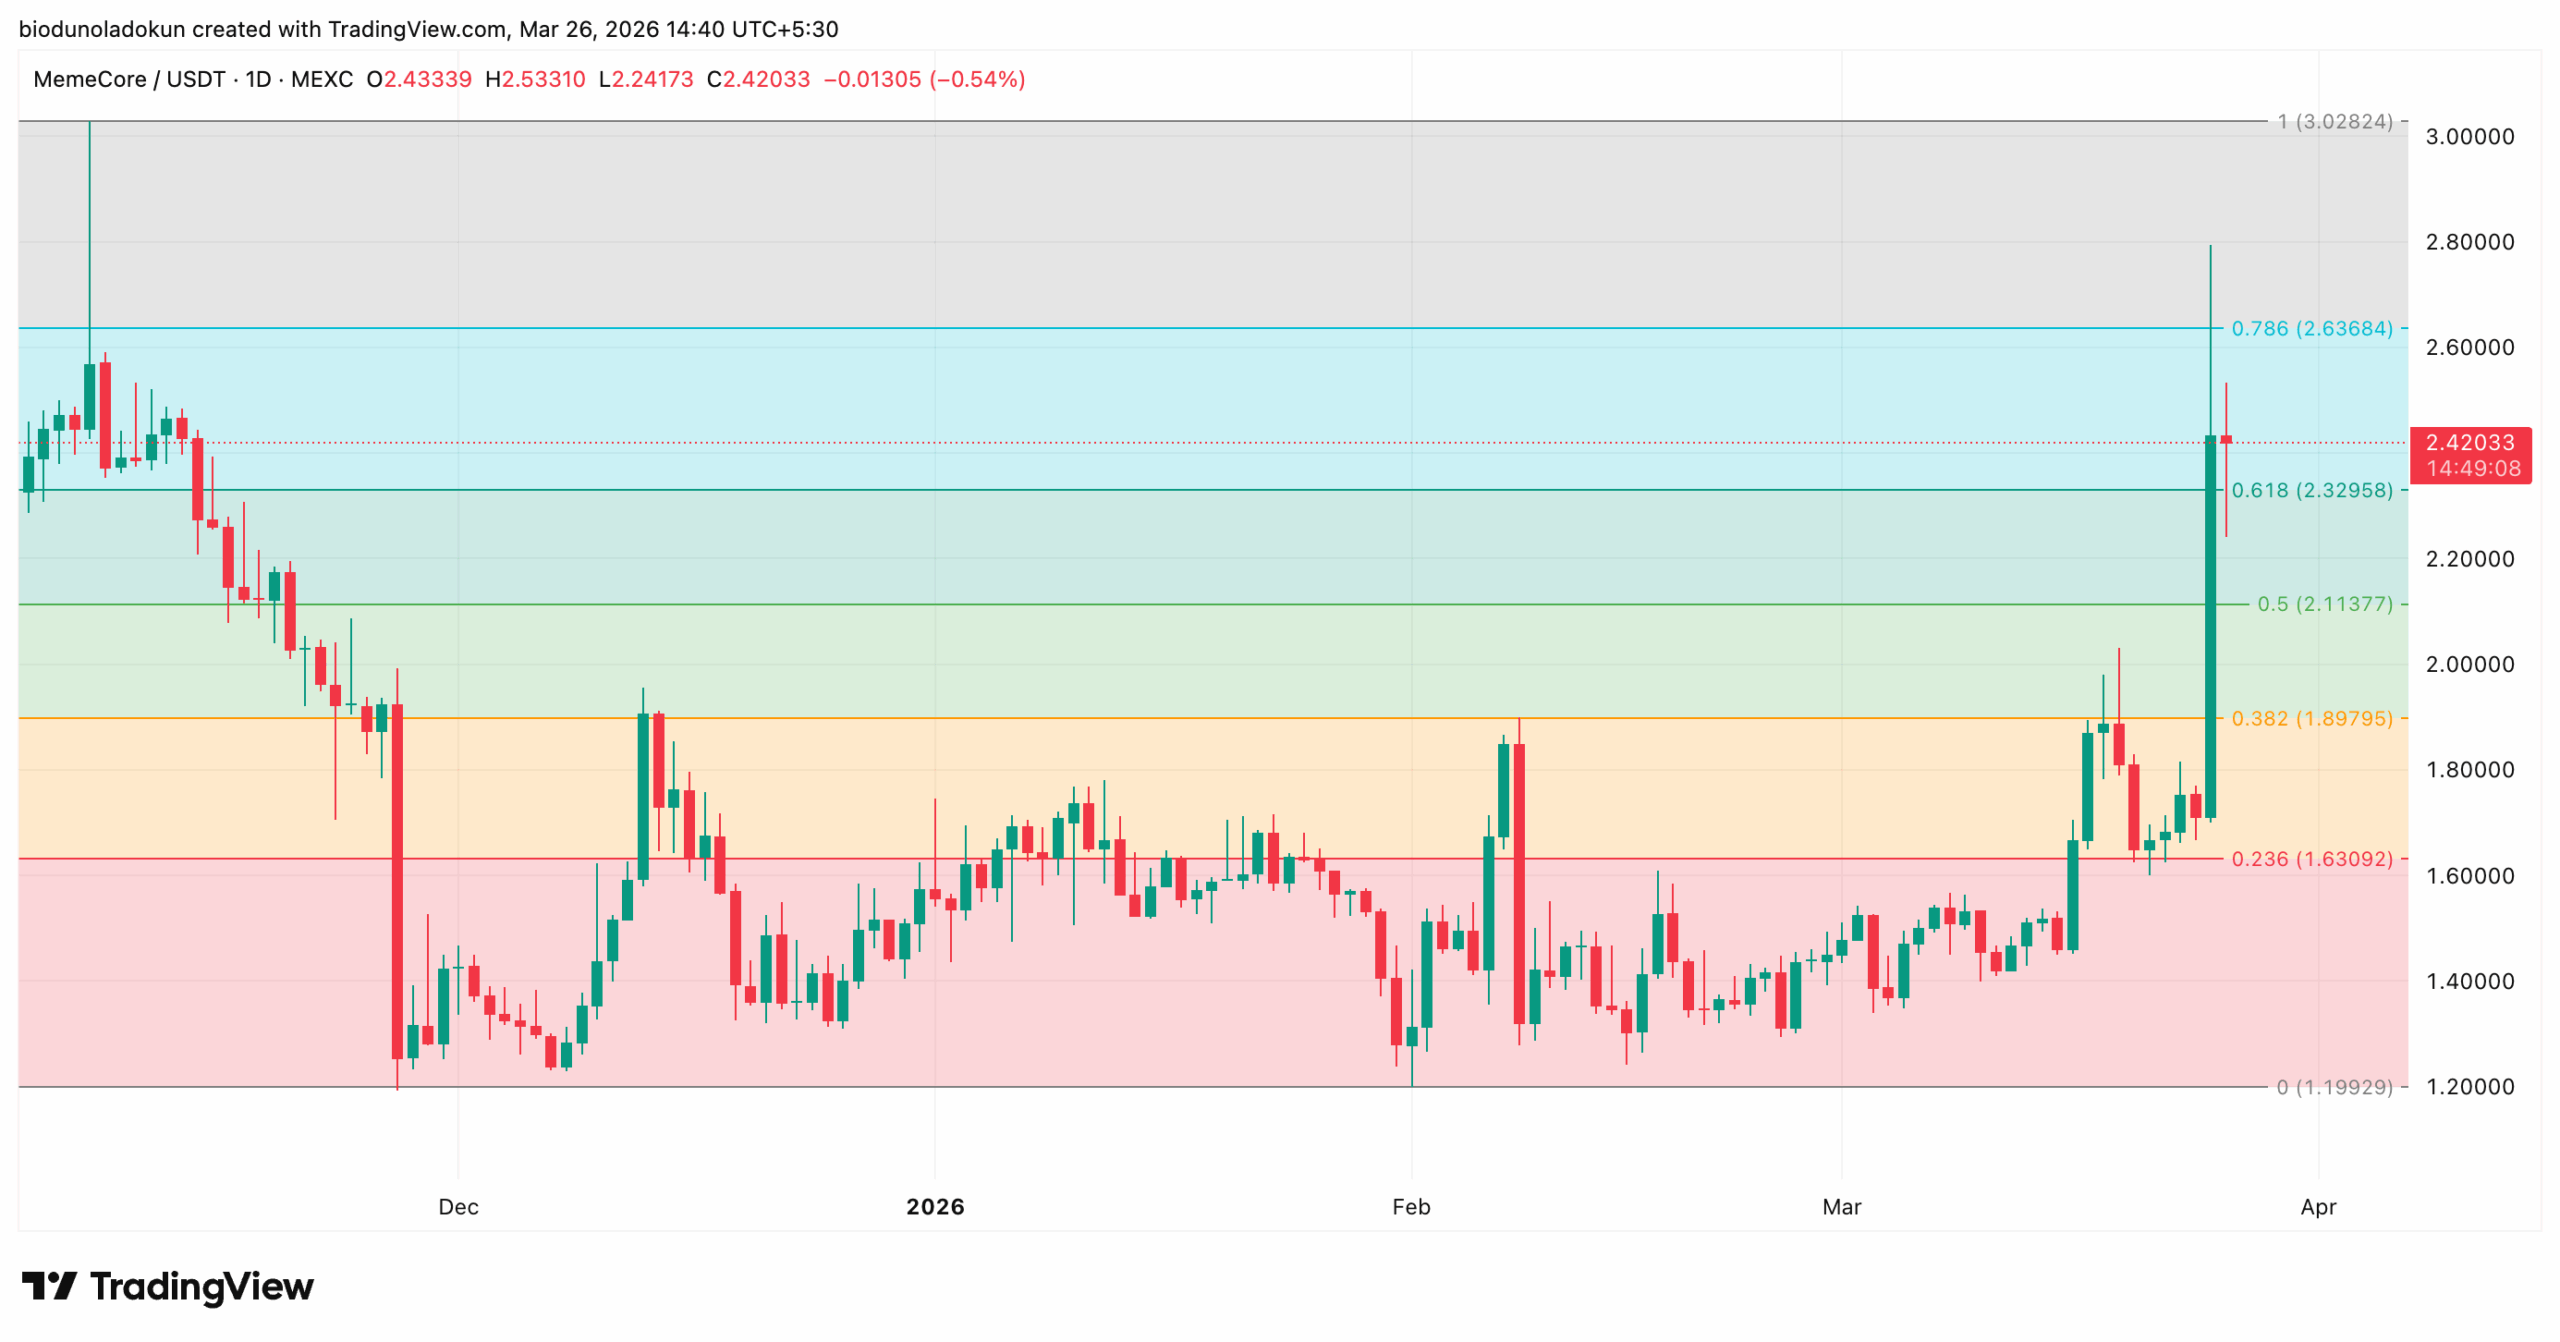
At press time, M trades at $2.42, below the resistance at the 0.786 Fibonacci retracement level of $2.63. If buy-side pressure grows and the coin closes above this level, it could revisit its all-time high of $3.02.
However, if momentum fades and sellers step in, M risks slipping back below the support floor at $2.32.
M/USD Daily Chart | Credit: TradingView
A failure to hold that floor would expose the coin to a deeper pullback toward the 0.5 level at $2.11, and potentially as low as $1.89.
Disclaimer:
The information provided in this article is for informational purposes only. It is not intended to be, nor should it be construed as, financial advice. We do not make any warranties regarding the completeness, reliability, or accuracy of this information. All investments involve risk, and past performance does not guarantee future results. We recommend consulting a financial advisor before making any investment decisions.
Abiodun Oladokun is a Research Analyst at CCN, where he covers cryptocurrency markets with a focus on on-chain analysis, technical assessments, and emerging trends across decentralized finance (DeFi), real-world assets (RWA), artificial intelligence (AI), decentralized physical infrastructure networks (DePIN), Layer 2s, and meme coins.
Prior to CCN, he served as a Senior On-Chain Analyst at BeInCrypto, producing market reports spanning diverse crypto sectors.
Before that, he conducted technical analysis and market assessments of various altcoins at AMBCrypto, where he also contributed long-form quarterly research papers on DeFi, NFTs, DAOs, and scaling architectures, leveraging on-chain platforms including Messari, Santiment, DefiLlama, and Dune Analytics.
He began his crypto career as a research analyst at SixthSense DAO, developing blockchain forensic tools to trace the history of stolen assets.
Abiodun is a lawyer called to the Nigerian Bar and the founder of Ilé Ijó, a Lagos-based electronic dance music collective.