TRX bulls hoped for $1, but charts paint a different story | Credit: Hameem Sarwar
Share
Key Takeaways
TRX’s price, which is down, shows fading strength across multiple timeframes.
Negative funding rate and bearish indicators point to further TRX downside
A reversal requires a break above the $0.30 resistance level with by heavy volume.
The last few months have been tough for altcoins, including Tron (TRX).
Over the last 90 days, the TRX price has decreased by 19%.72%, keeping the coveted $1 milestone well out of reach.
Yet, some analysts believe that the target could still happen this cycle. In this analysis, CCN reveals why it is implausible.
Tron Is Trapped
Between June 23 and Aug. 18, TRX posted an impressive streak of nine consecutive green weekly candles. This fueled speculation that the altcoin could reach $1 before the end of the cycle.
During that run, bullish sentiment dominated social platforms, and many traders expected the rally to accelerate.
Get These Top Crypto Casino Offers Now!
Sponsored
Disclosure
We sometimes use affiliate links in our content, when clicking on those we might receive a commission at no extra cost to you. By using this website you agree to our terms and conditions and privacy policy.
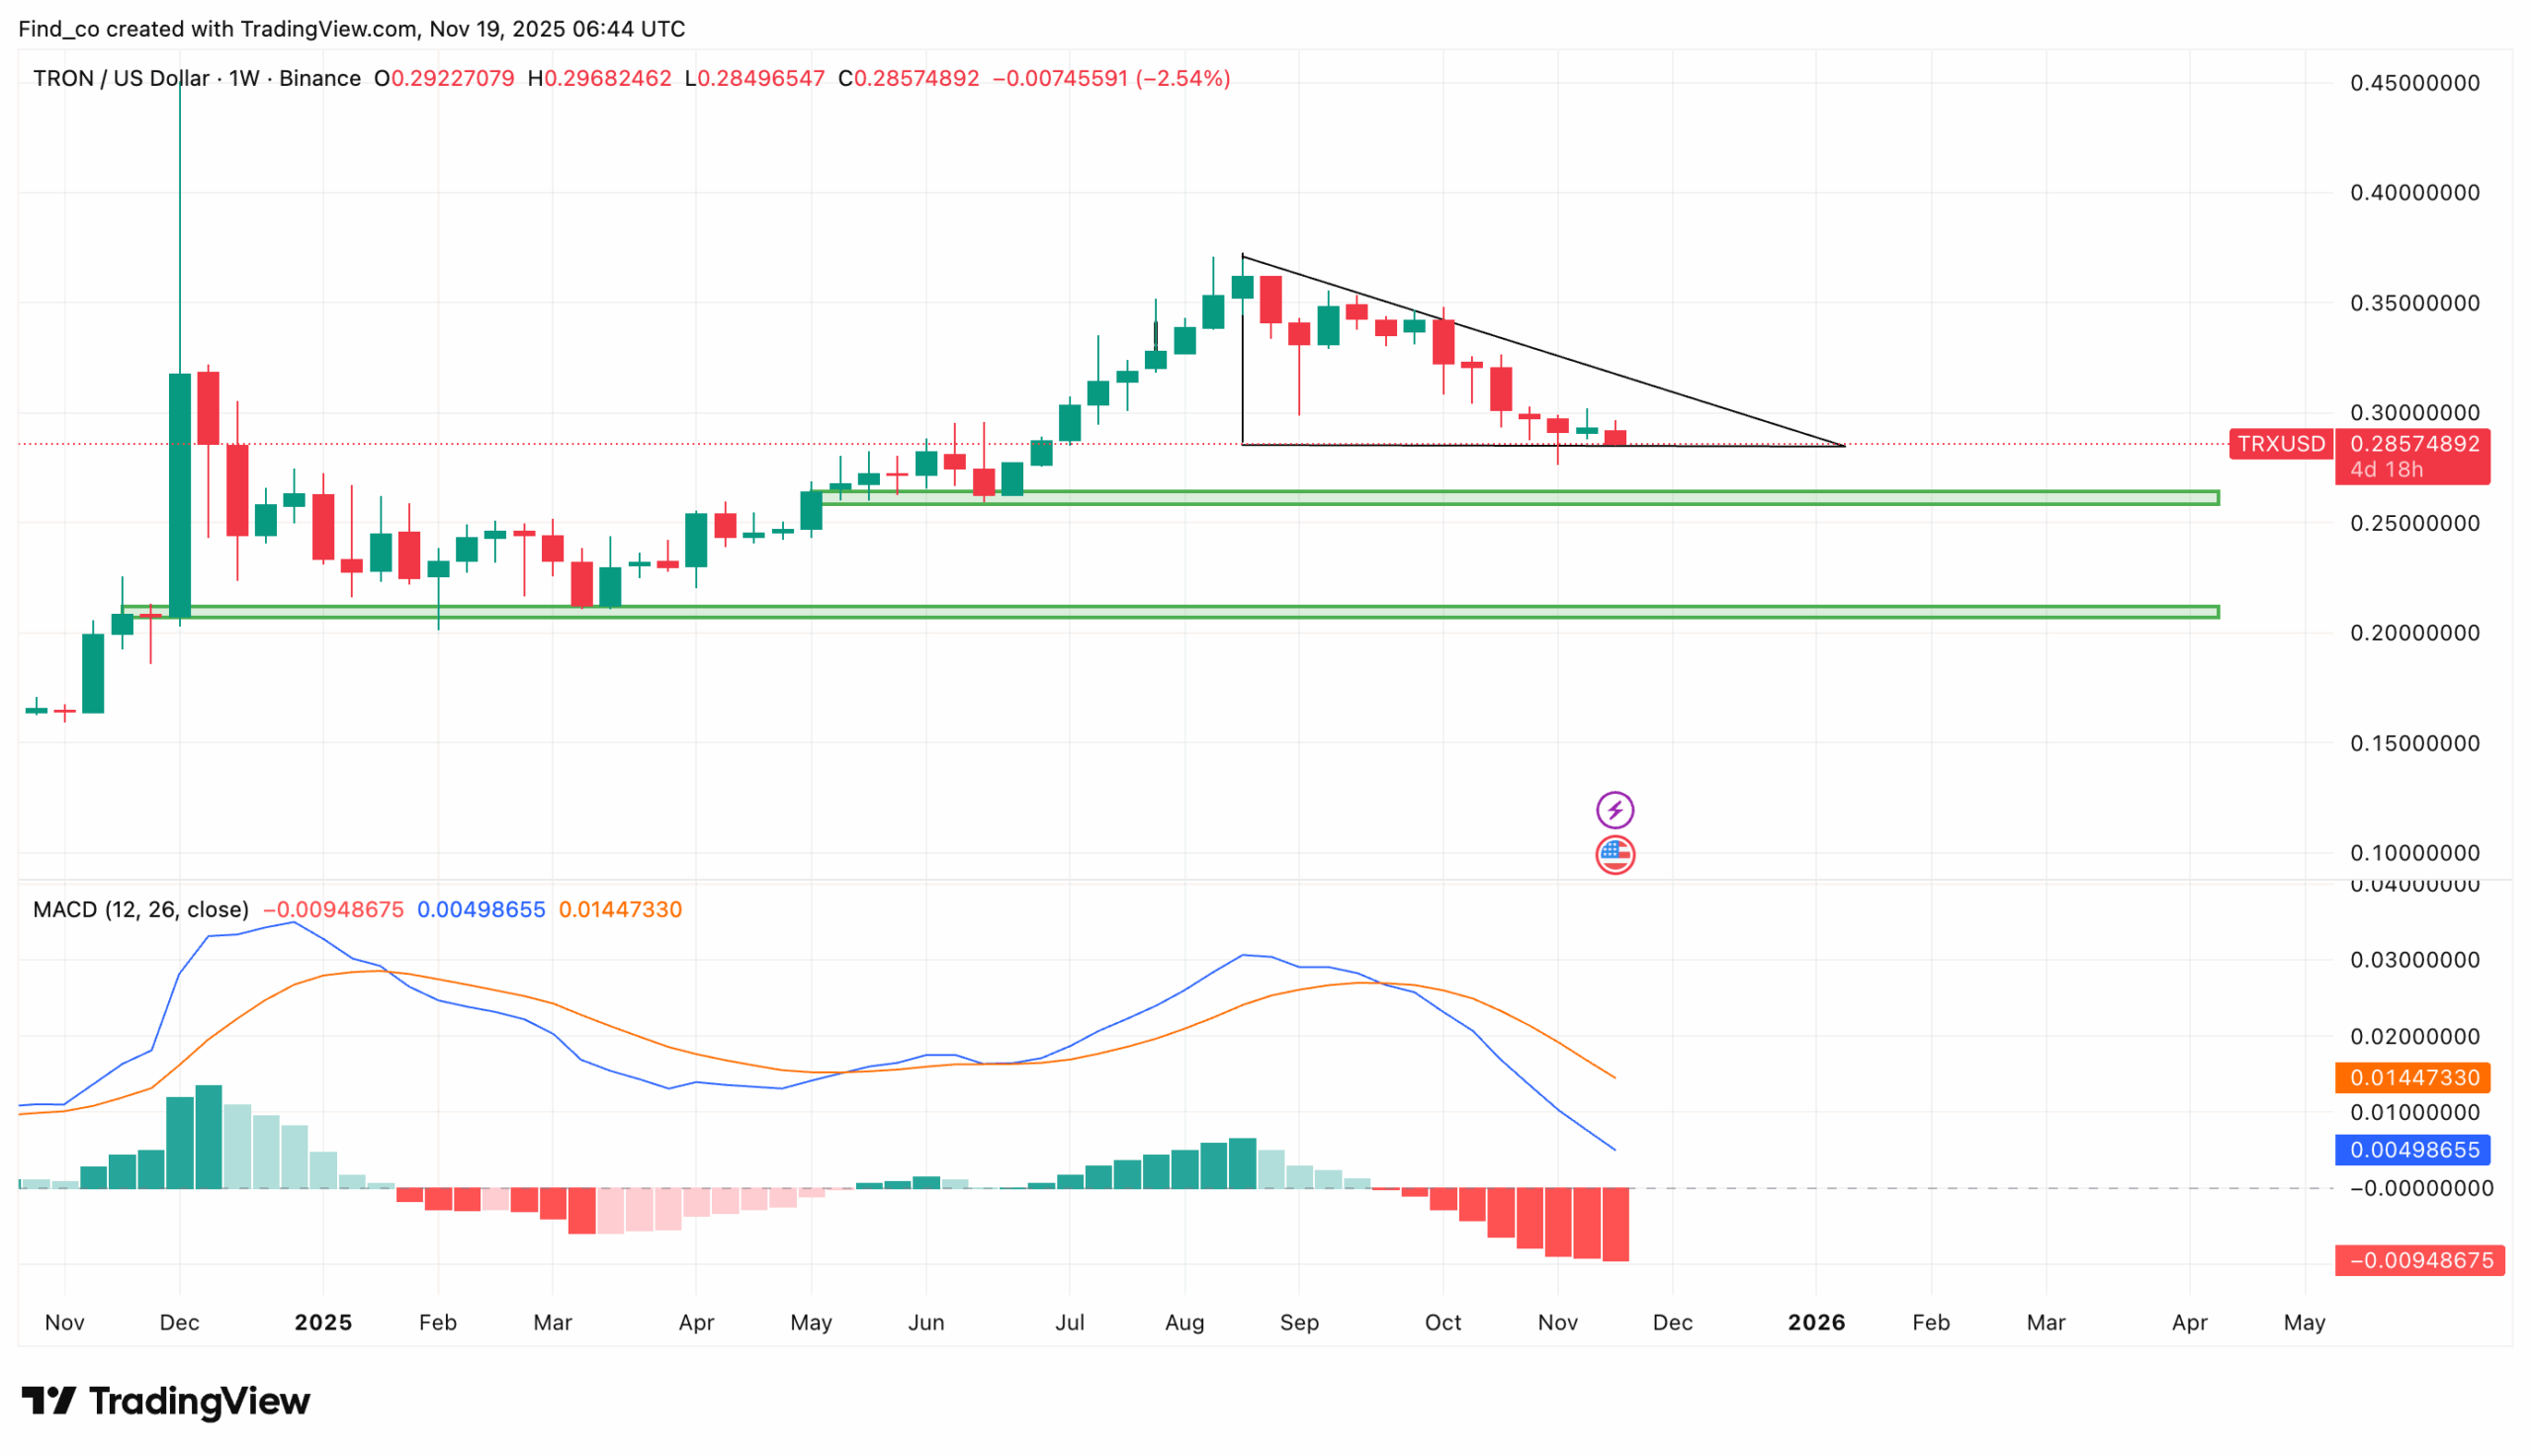
However, that scenario has not materialized. The trend has shifted, and the TRX price is now trapped inside a descending triangle, a pattern that signals weakening momentum and the potential for further downside.
Although the chart still indicates horizontal support near $0.29, the broader technical structure appears to be weak.
With lower highs consistently forming and sellers outweighing buyers at each bounce, the setup suggests increasing pressure on the support level.
Furthermore, the Moving Average Convergence Divergence (MACD) has formed a bearish crossover. This MACD position indicates weak momentum.
If this trend persists, the TRX price risks declining to the support level at $0.25, with the potential to drop to $0.22.
Red Flag Here
Amid this weakness, on-chain data from Santiment shows that TRX’s funding rate has turned negative.
Because funding is negative and TRX’s price has fallen, it means that short positions currently dominate the derivatives market.
This position signals excessive bearish sentiment. When the market leans too heavily toward shorts, especially after a sustained decline, the probability of a short squeeze decreases.
As it stands, the TRX price risks declining below the $0.25 support unless demand increases anytime soon.
TRX Price Prediction: Crucial Position
On the daily chart, TRX price remains confined within a falling channel.
At the same time, the Chaikin Money Flow (CMF) has slipped into negative territory, signaling that capital outflows are dominating the market.
This confirms weakening demand as sellers continue to outweigh buyers.
Additionally, the Supertrend indicator is bearish, with its red line positioned above the current price, acting as immediate resistance.
If these conditions persist, TRX could decline toward $0.26, where the next major support lies.
In a more severe bearish scenario, especially if market sentiment deteriorates, the price may even slide to $0.21.
On the other hand, a recovery remains possible, but only under strict conditions. TRX must break above the descending trendline with substantial volume to signal a meaningful trend reversal.
Disclaimer:
The information provided in this article is for informational purposes only. It is not intended to be, nor should it be construed as, financial advice. We do not make any warranties regarding the completeness, reliability, or accuracy of this information. All investments involve risk, and past performance does not guarantee future results. We recommend consulting a financial advisor before making any investment decisions.
Victor Olanrewaju is a crypto analyst and reporter at CCN with deep roots in on-chain research and technical analysis. His crypto journey began in 2017, but it was the 2020 Uniswap airdrop that sparked a full-time pivot into the space.
With a foundation in copywriting, Victor honed his craft creating high-converting content for leading crypto brokers — most notably an XRP price prediction that ranked #1 on Google during the 2021 bull run.
He later joined AMBCrypto in 2022, where he combined storytelling with technical and on-chain analysis to cover key market narratives.
In 2024, he expanded his expertise at BeInCrypto, collaborating with analysts and using tools like Glassnode, Santiment, and IntoTheBlock to break down Bitcoin and altcoin trends.
At CCN, Victor covers the top cryptocurrencies, memecoins, macro shifts, blending real-time insights with deep-dive metrics.
He holds a Bachelor’s degree in Physics from the University of Ibadan, equipping him to simplify complex data for a wide audience. Follow his work or connect on LinkedIn or X.