IOTA is approaching a pivotal decision point after potentially completing a prolonged correction and trading within a descending channel since December 2024.
The price structure presents two conflicting scenarios: a bullish reversal from support or a lower final capitulation wave.
With a key confluence of support and Fibonacci levels nearby, the next move will likely shape IOTA’s medium-term trend.
The 4-hour chart shows IOTA in a textbook descending wedge pattern that began after its parabolic rise toward $0.63 in December 2024.
Since then, price action has been corrected in a clear five-wave A-B-C-D-E structure.
Wave E may have ended on March 11 or still be in progress, with a potential final leg downward before the macro bottom is confirmed.
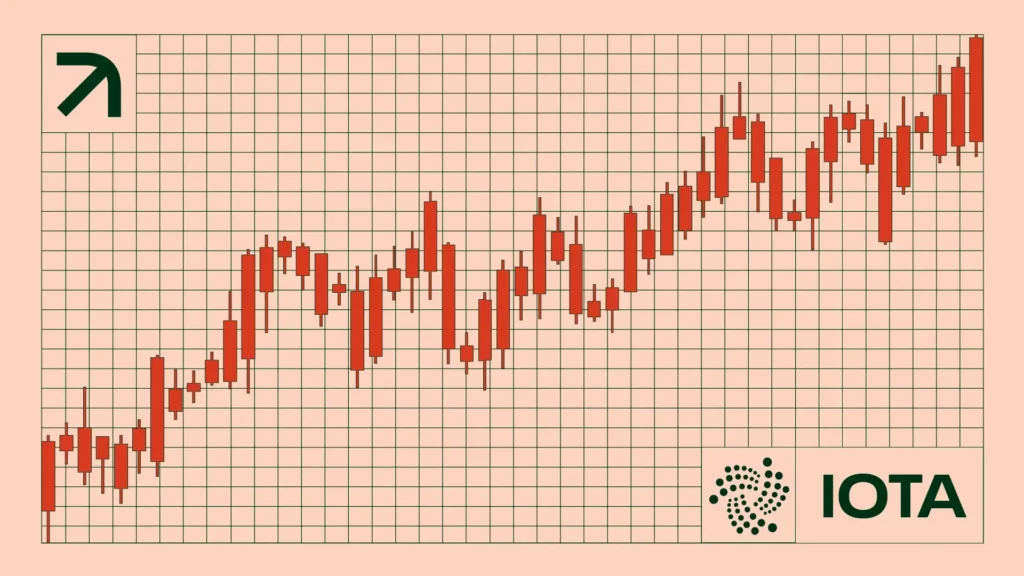
IOTAUSD at descending resistance | Credit: Nikola Lazic/TradingView
Currently, the price trades around $0.193, hovering just below the 0.786 Fibonacci retracement level ($0.217). Here, resistance was found to intersect with the descending trendline.
The green support zone between $0.164 and $0.105 has consistently acted as a demand area, catching all corrective lows since December 2022.
The final low for wave E could occur within this zone unless the price breaks above the descending resistance line and confirms a breakout.
The Relative Strength Index (RSI) on the 4-hour timeframe has flattened just above 50, reflecting waning bullish strength and indecision.
Until a breakout occurs, the descending channel and wedge pattern remain in play.
If bulls reclaim $0.217 with strong volume, the structure may shift bullish. Therefore, the next major resistance is targeted at $0.305 and $0.367.
IOTA Price Prediction
The one-hour chart reveals two possible scenarios ahead, depending on whether IOTA breaks descending resistance or is rejected.
In a bearish scenario, the current recovery since the March 11 low is the corrective B-wave rebound to a high of $0.21.
A sharp retracement has already begun from this level, and the price now appears to be transitioning into a developing C-wave decline.
IOTAUSD breakout or rejection awaited | Credit: Nikola Lazic/TradingView
Wave (a) completed near $0.164, followed by a bounce in wave (b) into the $0.217 resistance zone (aligned with the 0.786 Fib).
Furthermore, if this zone holds as resistance, a final leg down—wave (c)—could drive the price toward the 1.0 and 1.618 Fibonacci extensions at $0.16 and $0.12, respectively.
These levels lie within the long-term green demand zone seen in higher time frames. Making them ideal areas for potential reversal.
The RSI is getting close to the oversold zone during the hourly timeframe, which supports a bullish scenario.
This projection wave E ended on March 11 at $0.164, so the recovery is the beginning of the first five-wave impulse still in development.
If a breakout occurs above $0.24, that will validate the bullish outlook and lead to a retest of the 0.618 Fib level at $0.30
Therefore, the next few sessions will be critical. If supported by RSI divergence and volume confirmation, the C-wave completion zone will offer a long setup with high probability.
IOTA remains in a decisive zone, and the upcoming wave resolution will likely determine the next macro trend.
Disclaimer:
The information provided in this article is for informational purposes only. It is not intended to be, nor should it be construed as, financial advice. We do not make any warranties regarding the completeness, reliability, or accuracy of this information. All investments involve risk, and past performance does not guarantee future results. We recommend consulting a financial advisor before making any investment decisions.
Nikola Lazic is a cryptocurrency analyst and investor working in the industry since 2017. He holds a bachelor's degree in Sociology, which enables him to better understand the psychology behind the crowd´s positioning. Consequently his preferred analytical tool is Elliott Wave Theory in combination with price action analysis.
Combining his experience in trading and investing with knowledge in content writing he strives to bring the most accurate and actionable information.