ICP struggles to hold support | Credit: Hameem Sarwar
Share
Key Takeaways
ICP is up 36% from its all-time low but remains under bearish control.
Negative BBP, RSI, and falling open interest indicate further downside.
Here is why ICP’s price could retest the $2.06 support level unless the bulls return.
ICP, the native token of the Internet Computer blockchain, has rallied 36% from its all-time low, yet its recovery appears fragile.
The bounce offers short-term relief, but market sentiment remains cautious. Technical indicators point to a potential continuation of the downtrend rather than a lasting reversal.
Could ICP’s price be headed for another breakdown? Here’s what the charts suggest.
ICP Attempted Recovery Stalls
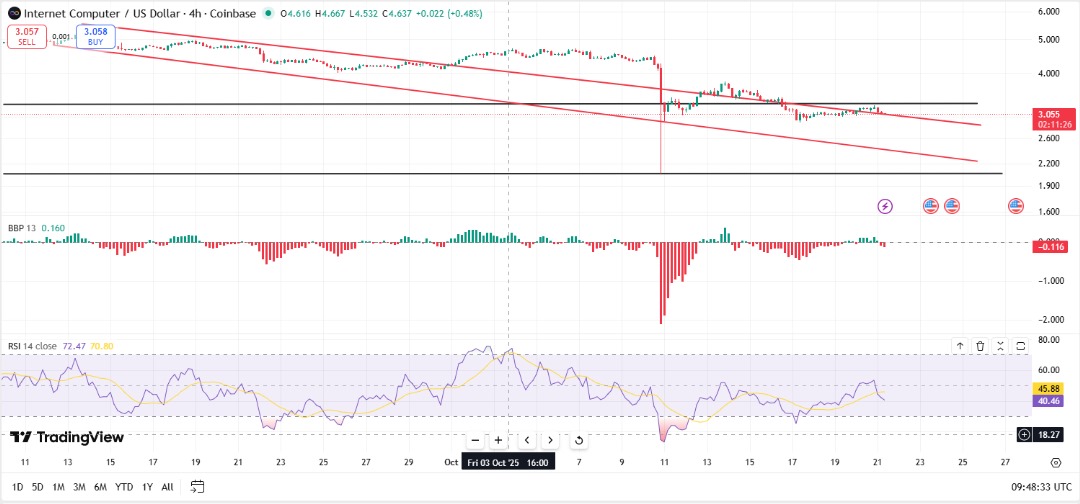
On the 4-hour chart, ICP’s price continues to trade within a descending channel, showing that bearish forces still dominate.
The Bull Bear Power (BBP) indicator currently stands at -0.116, indicating a negative reading that confirms sellers are in control, with buyers struggling to regain influence.
Get These Top Crypto Casino Offers Now!
Sponsored
Disclosure
We sometimes use affiliate links in our content, when clicking on those we might receive a commission at no extra cost to you. By using this website you agree to our terms and conditions and privacy policy.
On-chain metrics support this sentiment. ICP’s open interest has dropped by -8.99 %, signaling a rise in short positions as traders anticipate further losses.
The decline in price and open interest indicates reduced market confidence, suggesting that most participants are betting against the token rather than backing a recovery.
On-Chain Outlook
Furthermore, on-chain data from Santimet, the Internet Computer’s Market Value to Realized Value (MVRV) Long/Short Difference dropped to 39.06%.
This indicates that short-term holders are experiencing heavier unrealized losses compared to their long-term counterparts.
This deep negative reading reflects market capitulation. Sometimes, it can signal a potential bottom, as selling pressure from newer participants begins to exhaust.
However, considering the low demand, this might not be true for ICP. Hence, ICP’s price is unlikely to trade higher.
Furthermore, sustained weakness at the altcoin’s current levels could also indicate a prolonged period of consolidation.
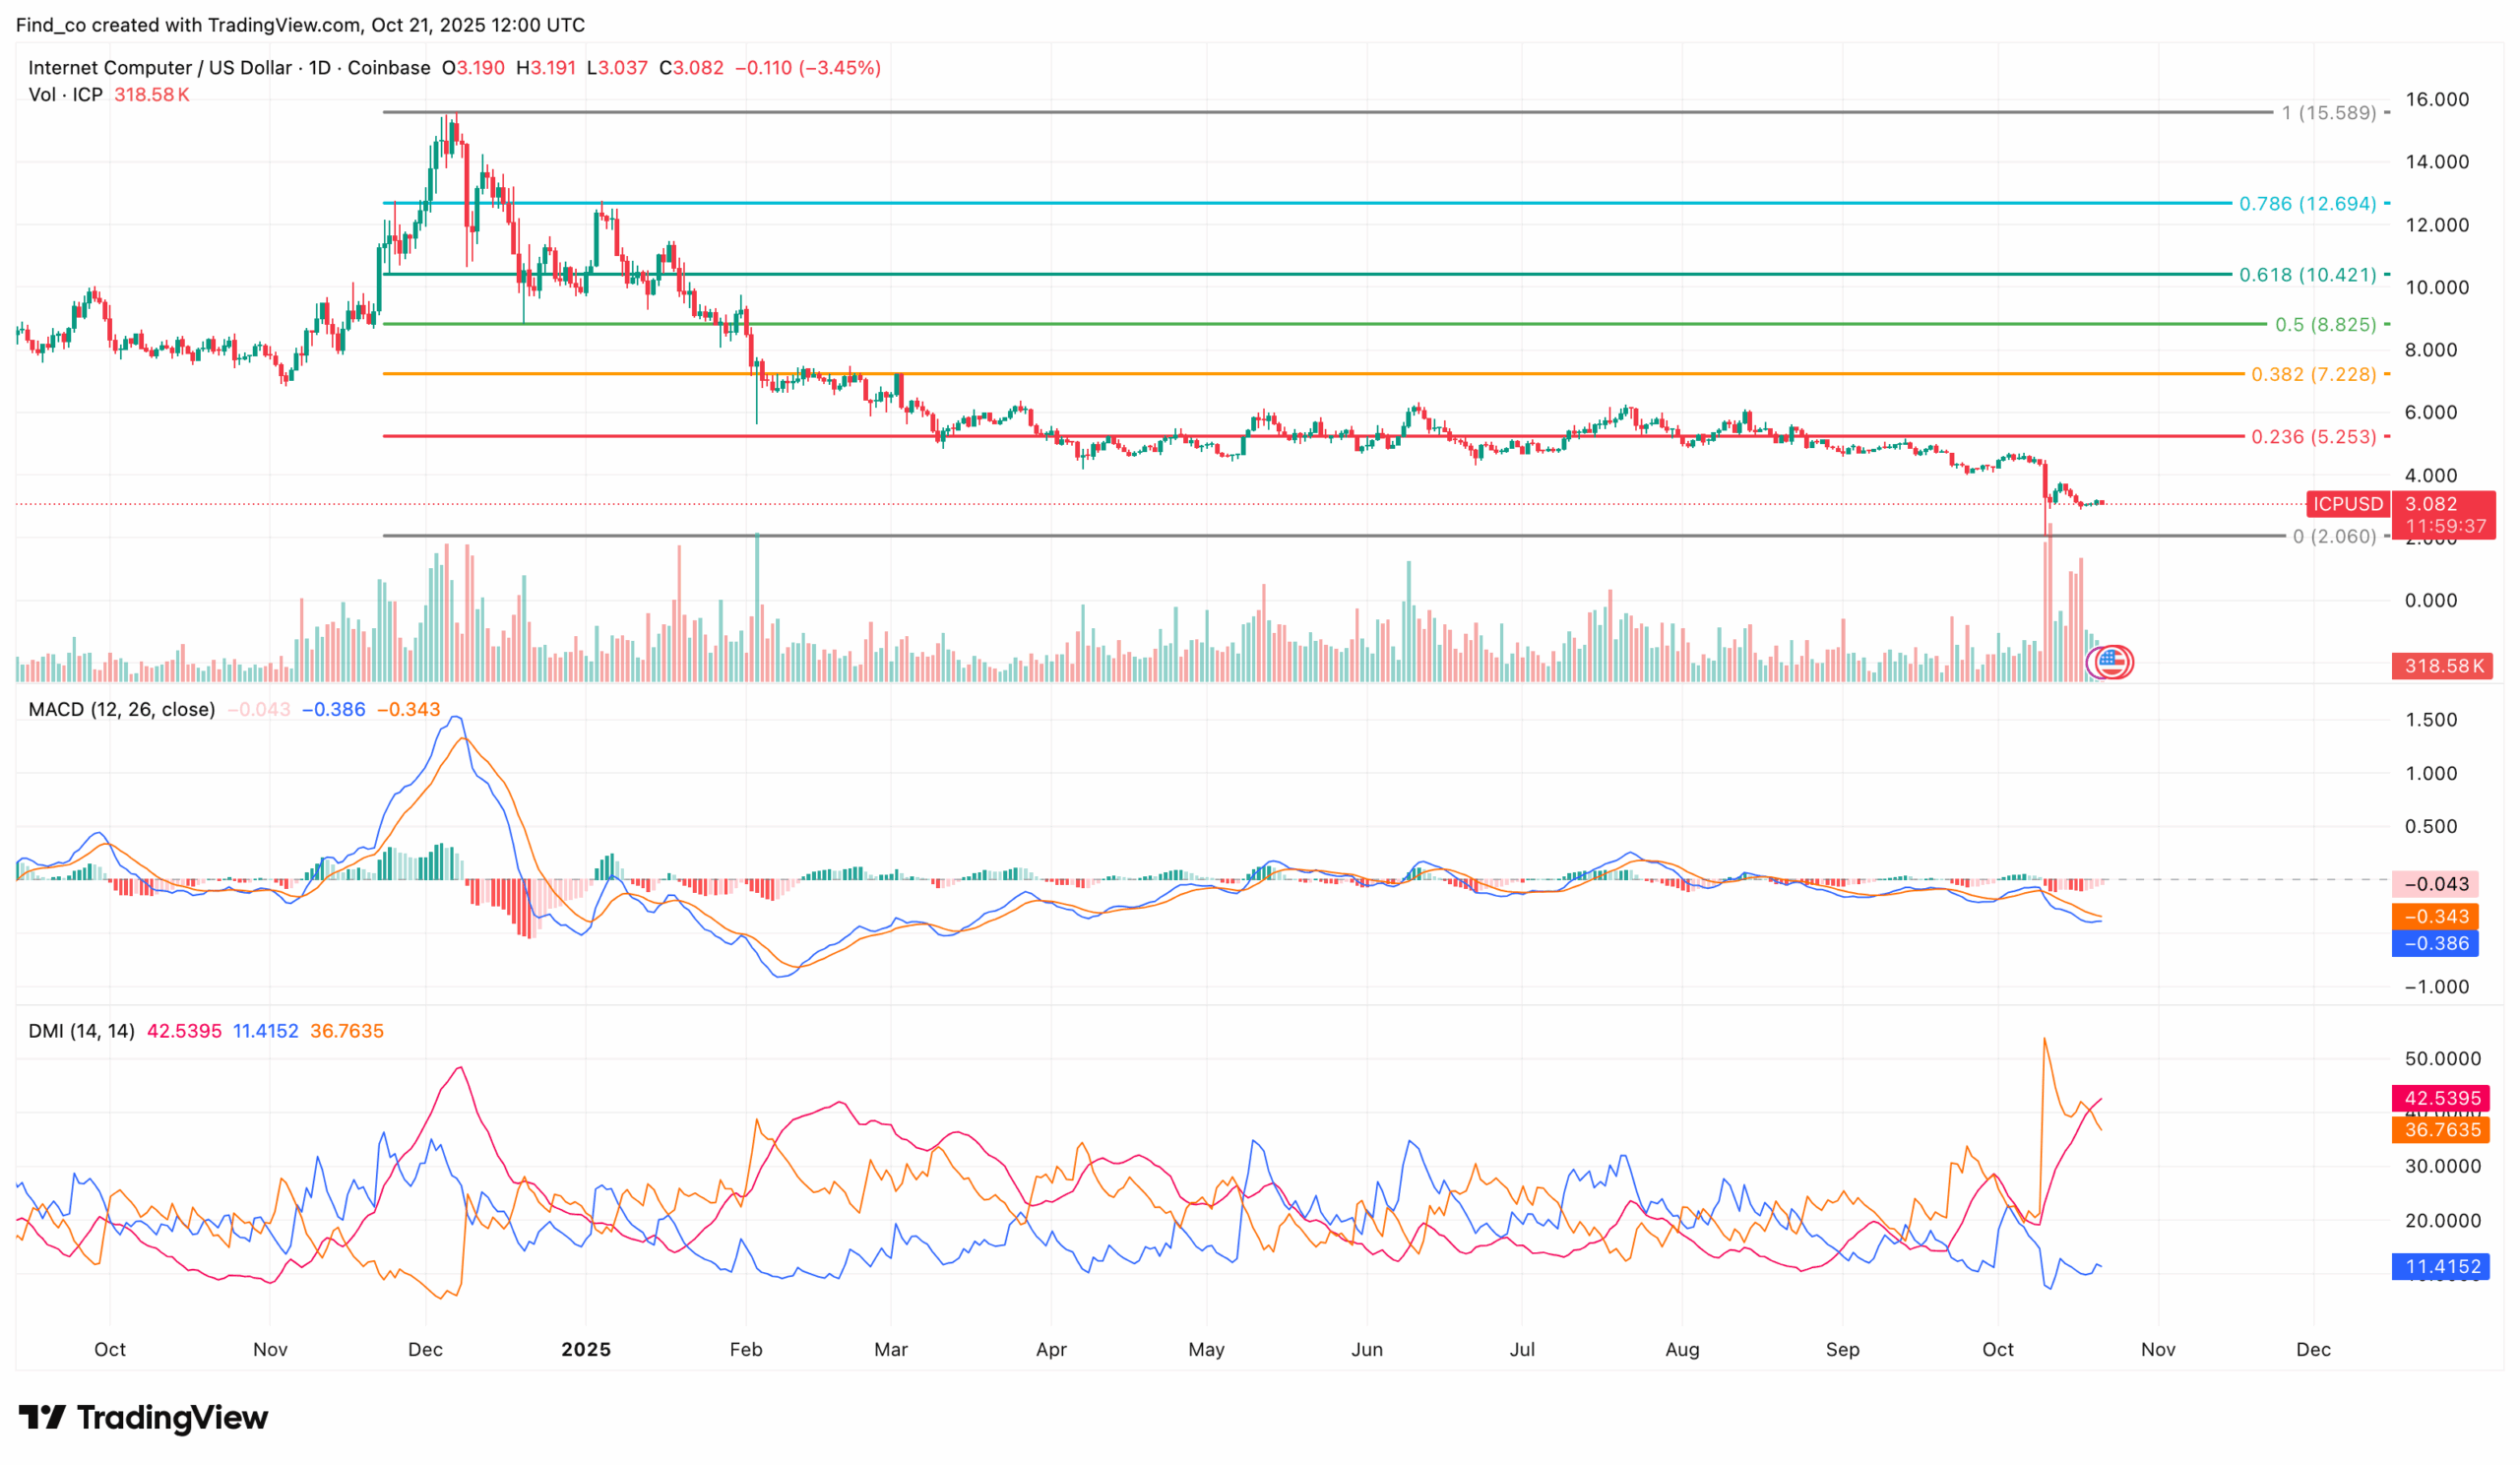
The daily chart further reinforces the ongoing downtrend. The Moving Average Convergence Divergence (MACD) remains negative at -0.043, reflecting continued selling pressure.
The histogram prints red bars, confirming that bearish momentum still outweighs bullish attempts.
The Directional Movement Index (DMI) offers additional confirmation. The negative directional indicator (red) at 36.76 stays above the positive one (green) at 11.42, proving that sellers maintain control.
The Average Directional Index (ADX) reads 42.54 and trends upward, signaling strong momentum that favors the bears while buyers lose strength.
ICP trades at $3.06 at press time, struggling to hold its ground. The Fibonacci retracement levels outline potential price paths in the coming days.
If buyers reclaim momentum and push the price above the 0.236 Fib level at $5.31, it could challenge the bearish narrative and open the way toward the 0.382 Fib level at $7.32.
Such a move would signal a shift in sentiment and possibly indicate the start of a broader recovery.
Disclaimer:
The information provided in this article is for informational purposes only. It is not intended to be, nor should it be construed as, financial advice. We do not make any warranties regarding the completeness, reliability, or accuracy of this information. All investments involve risk, and past performance does not guarantee future results. We recommend consulting a financial advisor before making any investment decisions.
Victor Olanrewaju is a crypto analyst and reporter at CCN with deep roots in on-chain research and technical analysis. His crypto journey began in 2017, but it was the 2020 Uniswap airdrop that sparked a full-time pivot into the space.
With a foundation in copywriting, Victor honed his craft creating high-converting content for leading crypto brokers — most notably an XRP price prediction that ranked #1 on Google during the 2021 bull run.
He later joined AMBCrypto in 2022, where he combined storytelling with technical and on-chain analysis to cover key market narratives.
In 2024, he expanded his expertise at BeInCrypto, collaborating with analysts and using tools like Glassnode, Santiment, and IntoTheBlock to break down Bitcoin and altcoin trends.
At CCN, Victor covers the top cryptocurrencies, memecoins, macro shifts, blending real-time insights with deep-dive metrics.
He holds a Bachelor’s degree in Physics from the University of Ibadan, equipping him to simplify complex data for a wide audience. Follow his work or connect on LinkedIn or X.