INJ's retracement may be a healthy retest after its massive breakout | Credit: Hameem Sarwar
Share
Key Takeaways
INJ fell 10% after its Binance US listing, with traders treating the event as a sell-the-news event.
Despite the pullback, INJ remains in a bullish structure near $5 after breaking a 116-day resistance.
Injective’s buyback-and-burn system and on-chain metrics suggest long-term upside potential.
Today, May 14, 2026, Injective (INJ) has fallen roughly 10% over the last 24 hours, trading briefly below $5
The pullback comes immediately after one of the strongest Layer-1 rallies of the week. Notably, Injective’s price has risen to its highest level since Jan. 18, breaking the 116-day resistance.
During the breakout, Injective climbed above $5.55 while daily trading volume exploded approximately 86% to nearly $283 million.
However, today’s decline comes amid a Binance US listing, suggesting the development is a “sell the news” event.
But will INJ continue to decline?
Binance US Listing Creates New Support
As stated earlier, one reason for the price drop is the Binance US listing.
More importantly, the crypto exchange also confirmed plans to introduce native INJ staking support for U.S. users in the near future.
Get These Top Crypto Casino Offers Now!
Sponsored
Disclosure
We sometimes use affiliate links in our content, when clicking on those we might receive a commission at no extra cost to you. By using this website you agree to our terms and conditions and privacy policy.
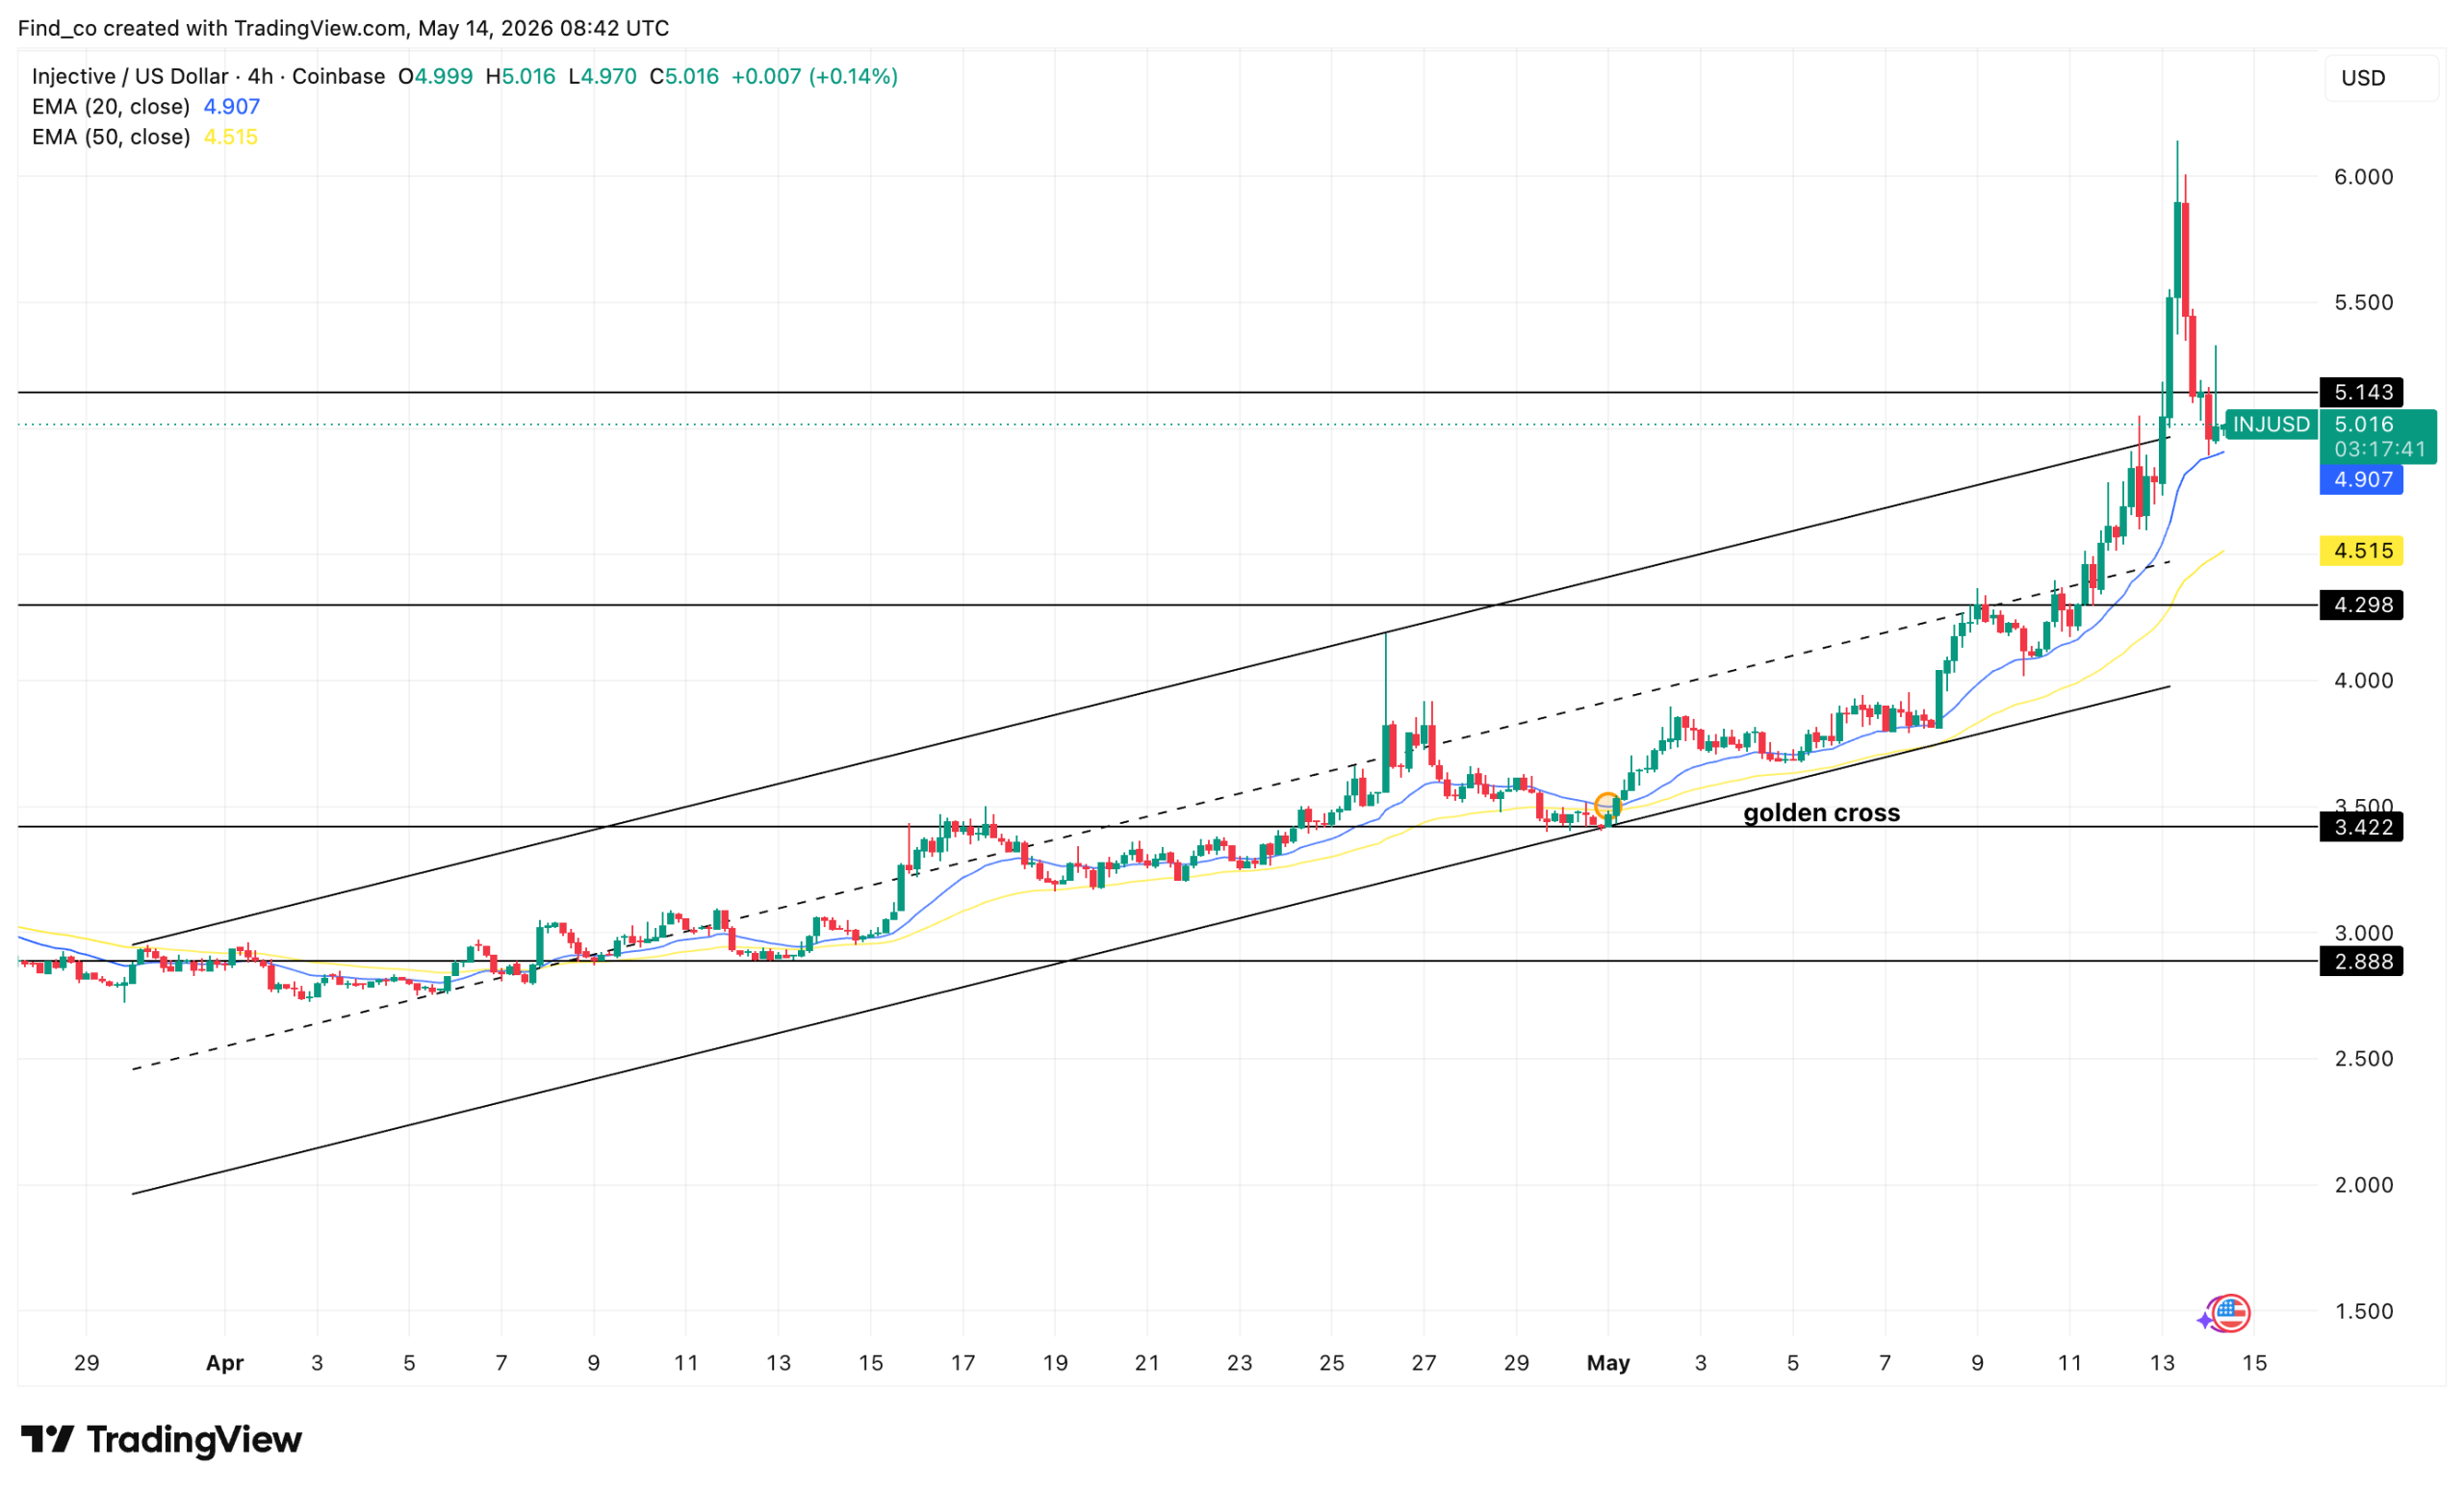
The golden cross between the 20 EMA (blue) and 50 EMA (yellow) near the $3.50 region marked the beginning of the stronger breakout phase.
Since then, both moving averages have acted as support, with INJ trading well above them.
The recent explosive move toward $6 confirms aggressive momentum. However, the sharp wick rejection near the top suggests short-term profit-taking after an overheated rally.
Right now, the key level to hold is the breakout zone around $5.14.
If bulls reclaim and stabilize above this resistance, INJ’s price could continue to push toward the upper channel resistance and potentially revisit $6.
However, after such a move, some consolidation between $4.90 and $5.20 would actually strengthen the structure.
Buyback and Burn Is Now Live
Beyond that, Injective is also entering a new phase of deflationary tokenomics.
On May 13, the Injective core development team confirmed that the highly anticipated Community Buyback and Burn system officially went live.
The mechanism uses accumulated dApp fee revenue across the network to automatically purchase INJ tokens on the open market and then permanently burn them.
This creates a powerful supply-side dynamic in which growing network usage directly reduces circulating supply. So, as time goes on, this could drive Injective’s price higher.
Higher Injective Price in the Long Term?
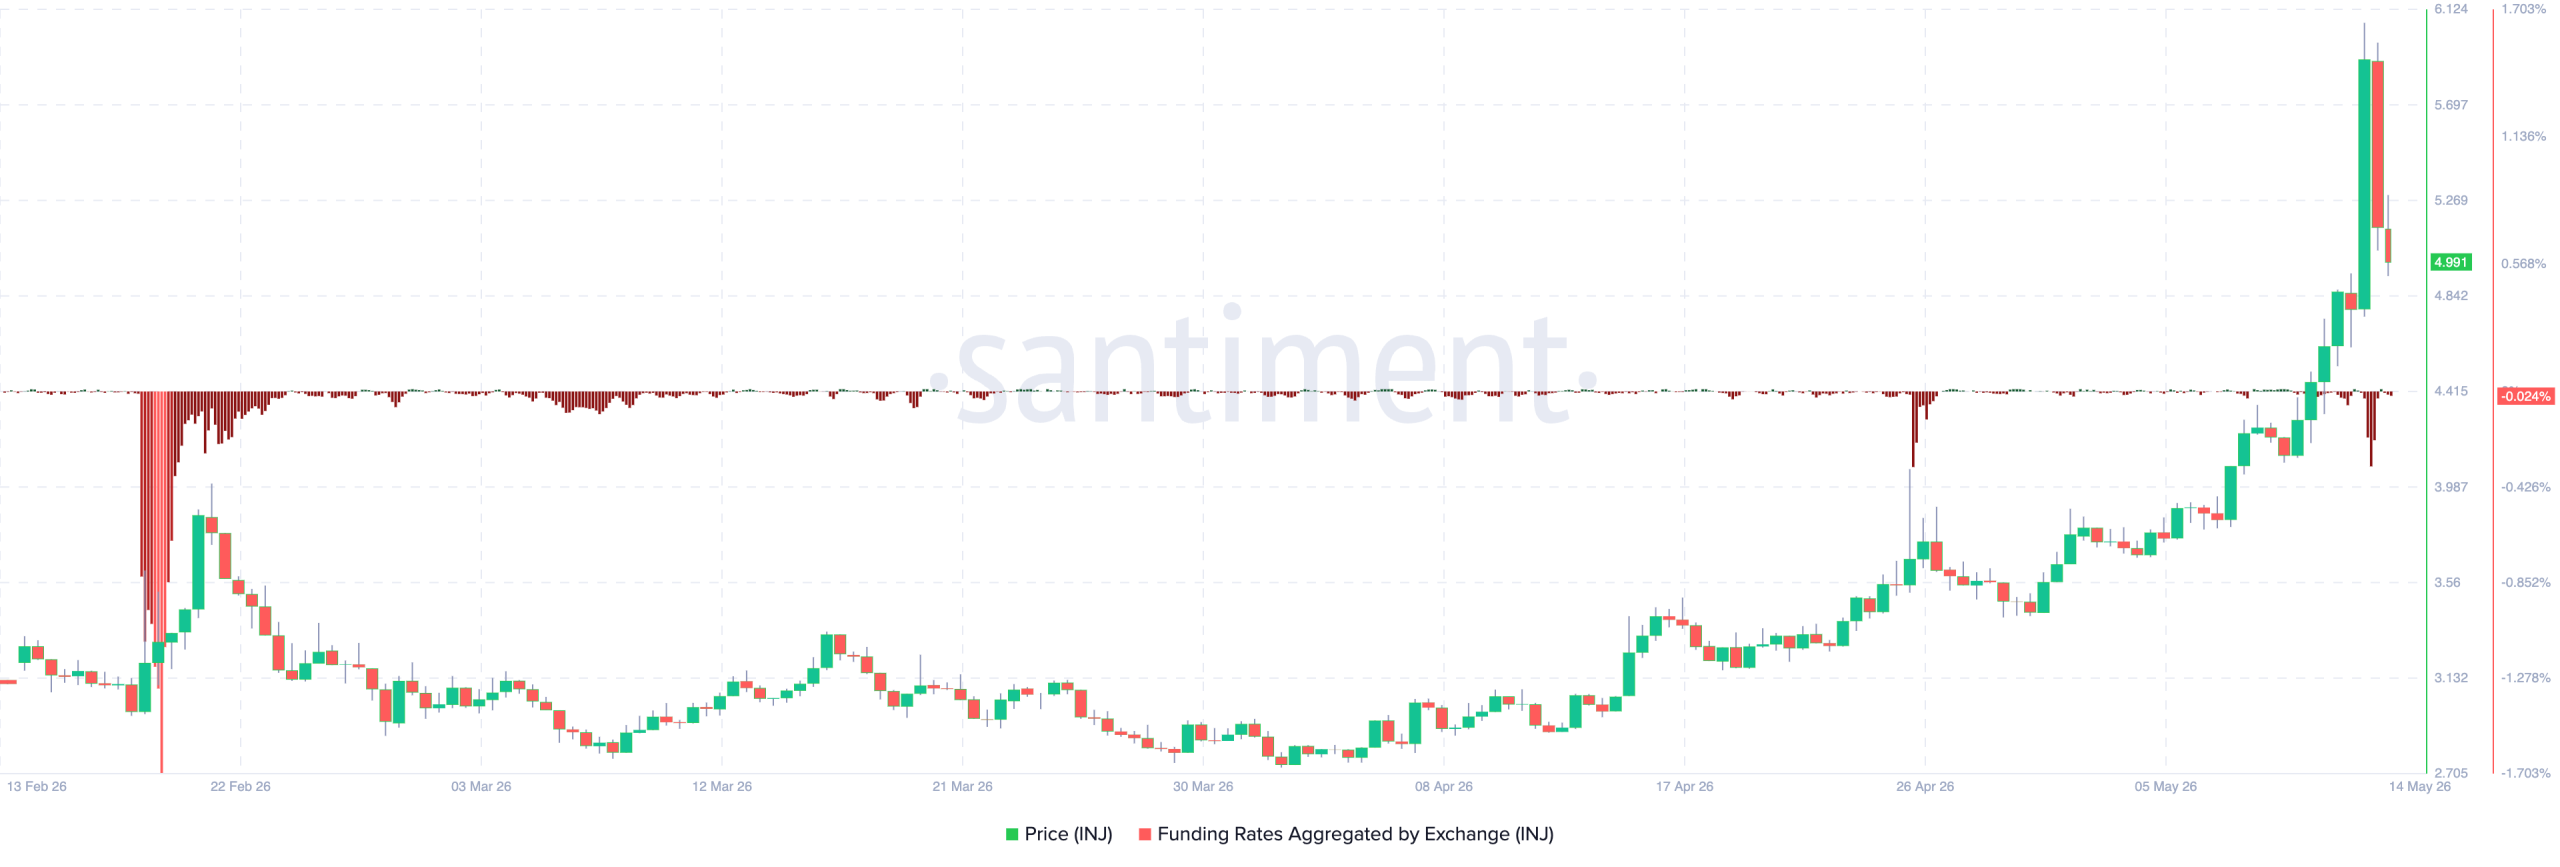
Despite the massive price rally from roughly $3 to above $6, funding rates have remained relatively neutral, even slightly negative at times.
That is actually a bullish sign because it suggests the rally is being driven more by spot buying.
Usually, when funding rates become excessively positive during a breakout, it signals euphoric positioning and increases the risk of a long squeeze.
Here, however, funding remains controlled even though Injective’s price has slowed down in making higher highs.
The recent spike followed by a funding reset also suggests leveraged positions were flushed out during the sharp rejection wick near $6.
Therefore, it is likely that INJ will resume its uptrend in the short term.
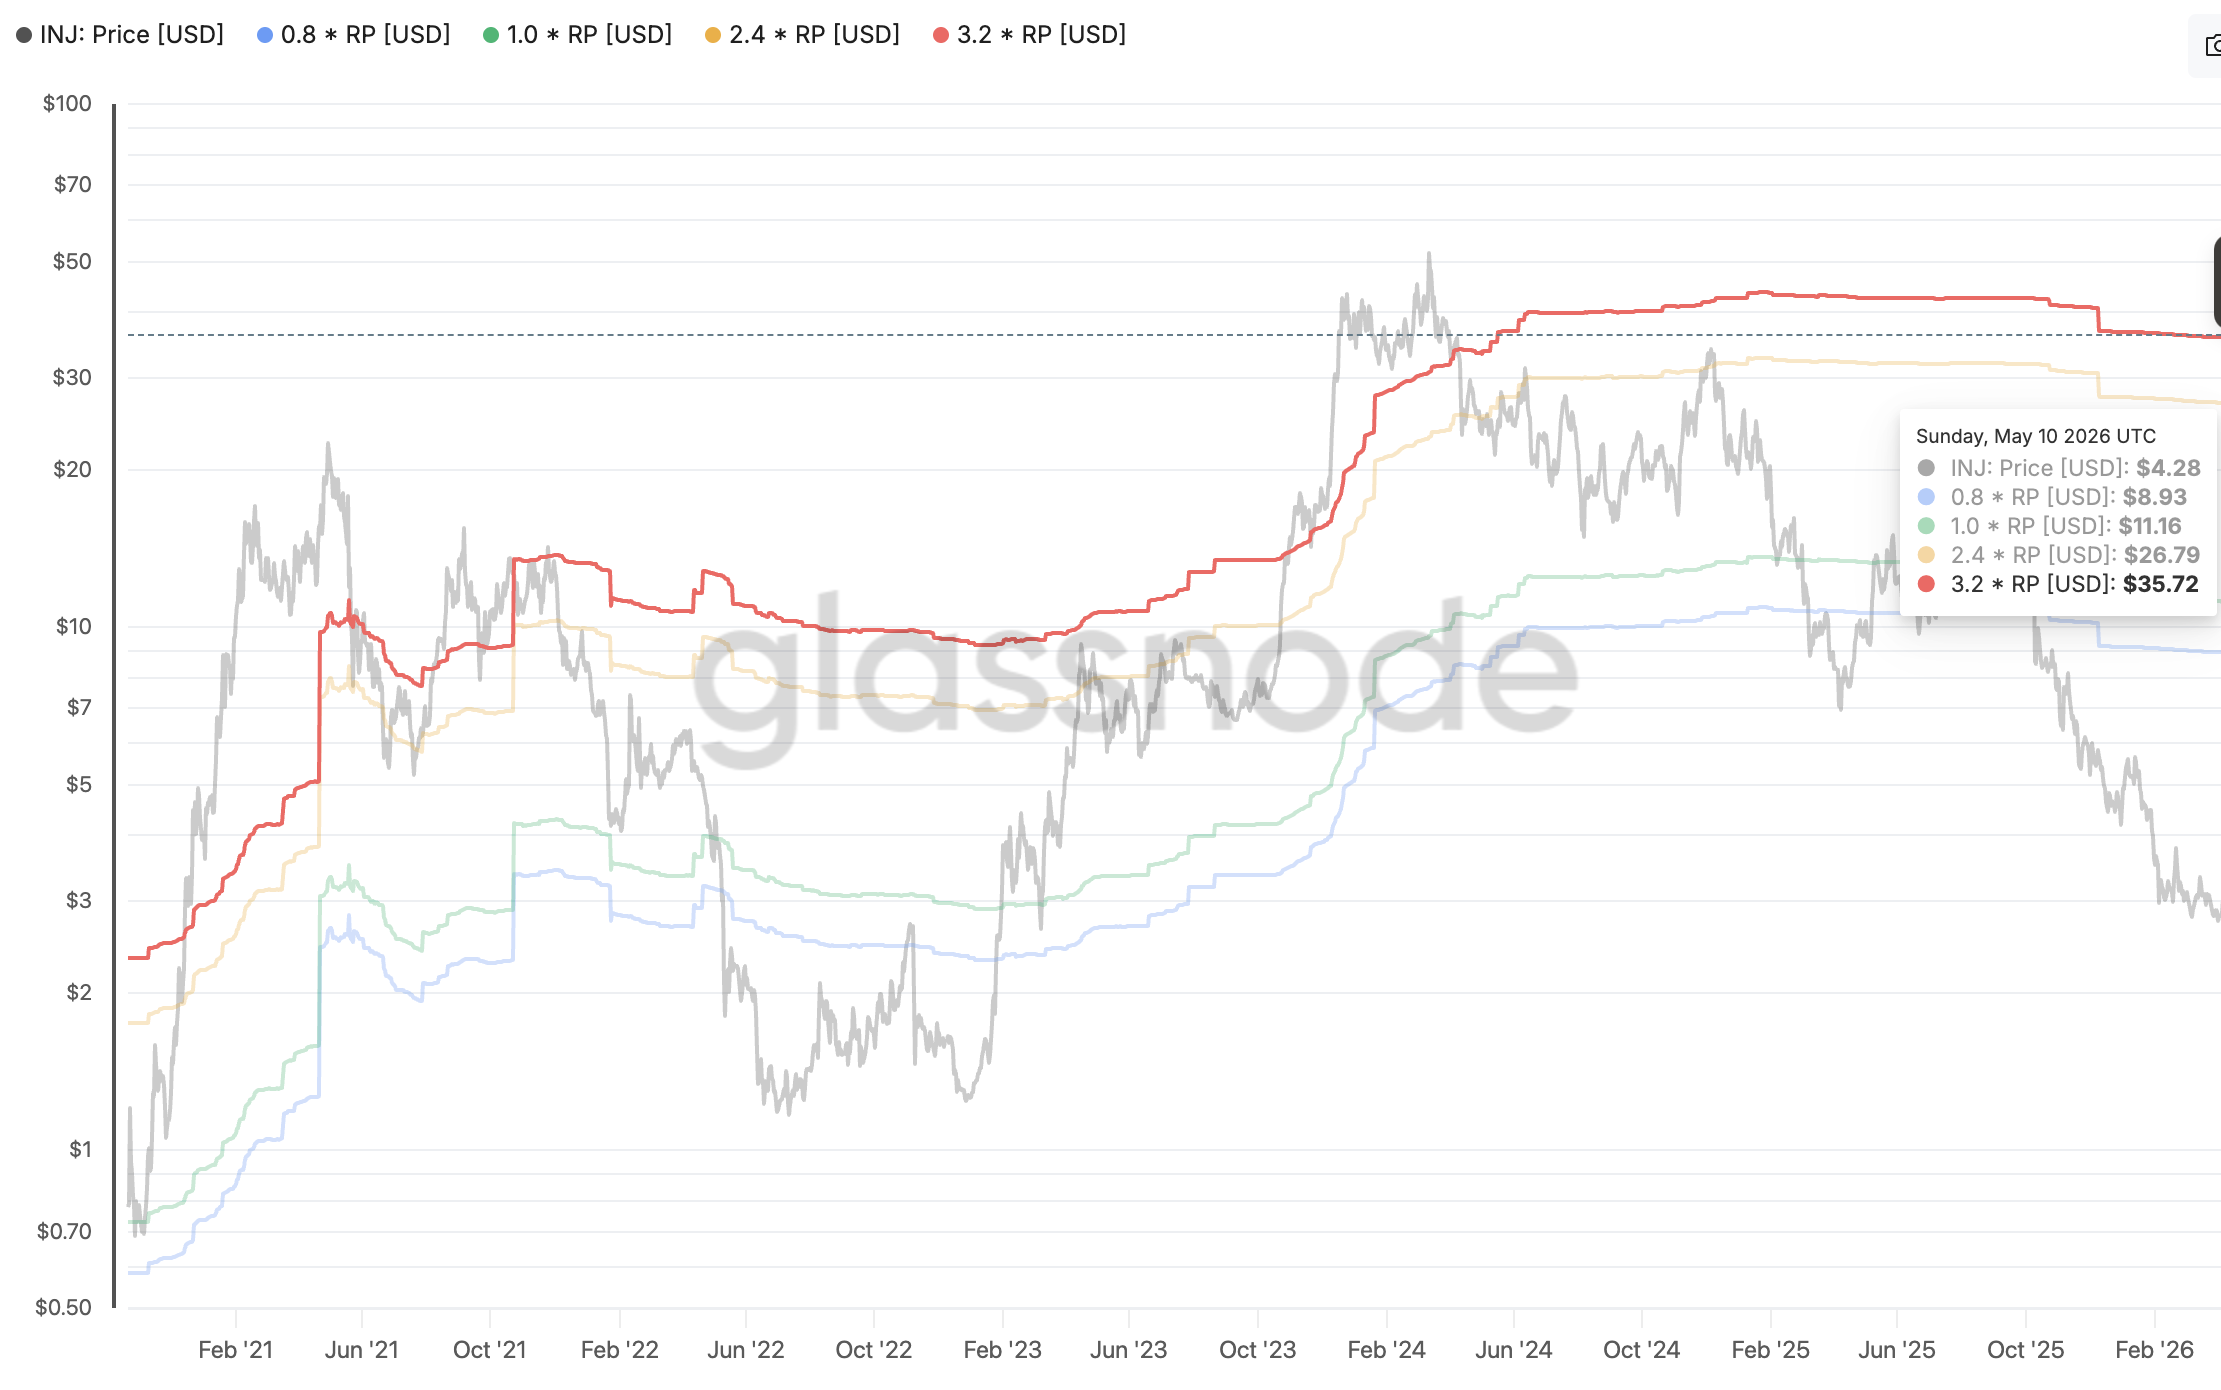
Furthermore, Glassnode data compares INJ’s price against Realized Price (RP) valuation bands.
For context, these are used to identify undervalued and overvalued regions. Right now, INJ is trading around $4-$5, while the realized price bands are significantly higher.
The 0.8x RP level is around $8.93, and the 1.0x RP level is near $11.16. On the other hand, the upper valuation bands extend toward $26 and $35.
This suggests Injective’s price is currently trading deeply below its historical fair value range.
Historically, when INJ trades below the 0.8x realized price band, it signals strong accumulation zones where long-term holders begin positioning ahead of major recoveries.
The current structure resembles previous undervaluation phases preceding explosive rallies.
Thus, the gap between the current price and realized valuation bands also implies that the speculative excess from the previous bull market has already been flushed out.
If market conditions improve and INJ’s price reclaims the 0.8x and 1.0x RP bands, it could signal the beginning of a recovery toward higher valuation over time
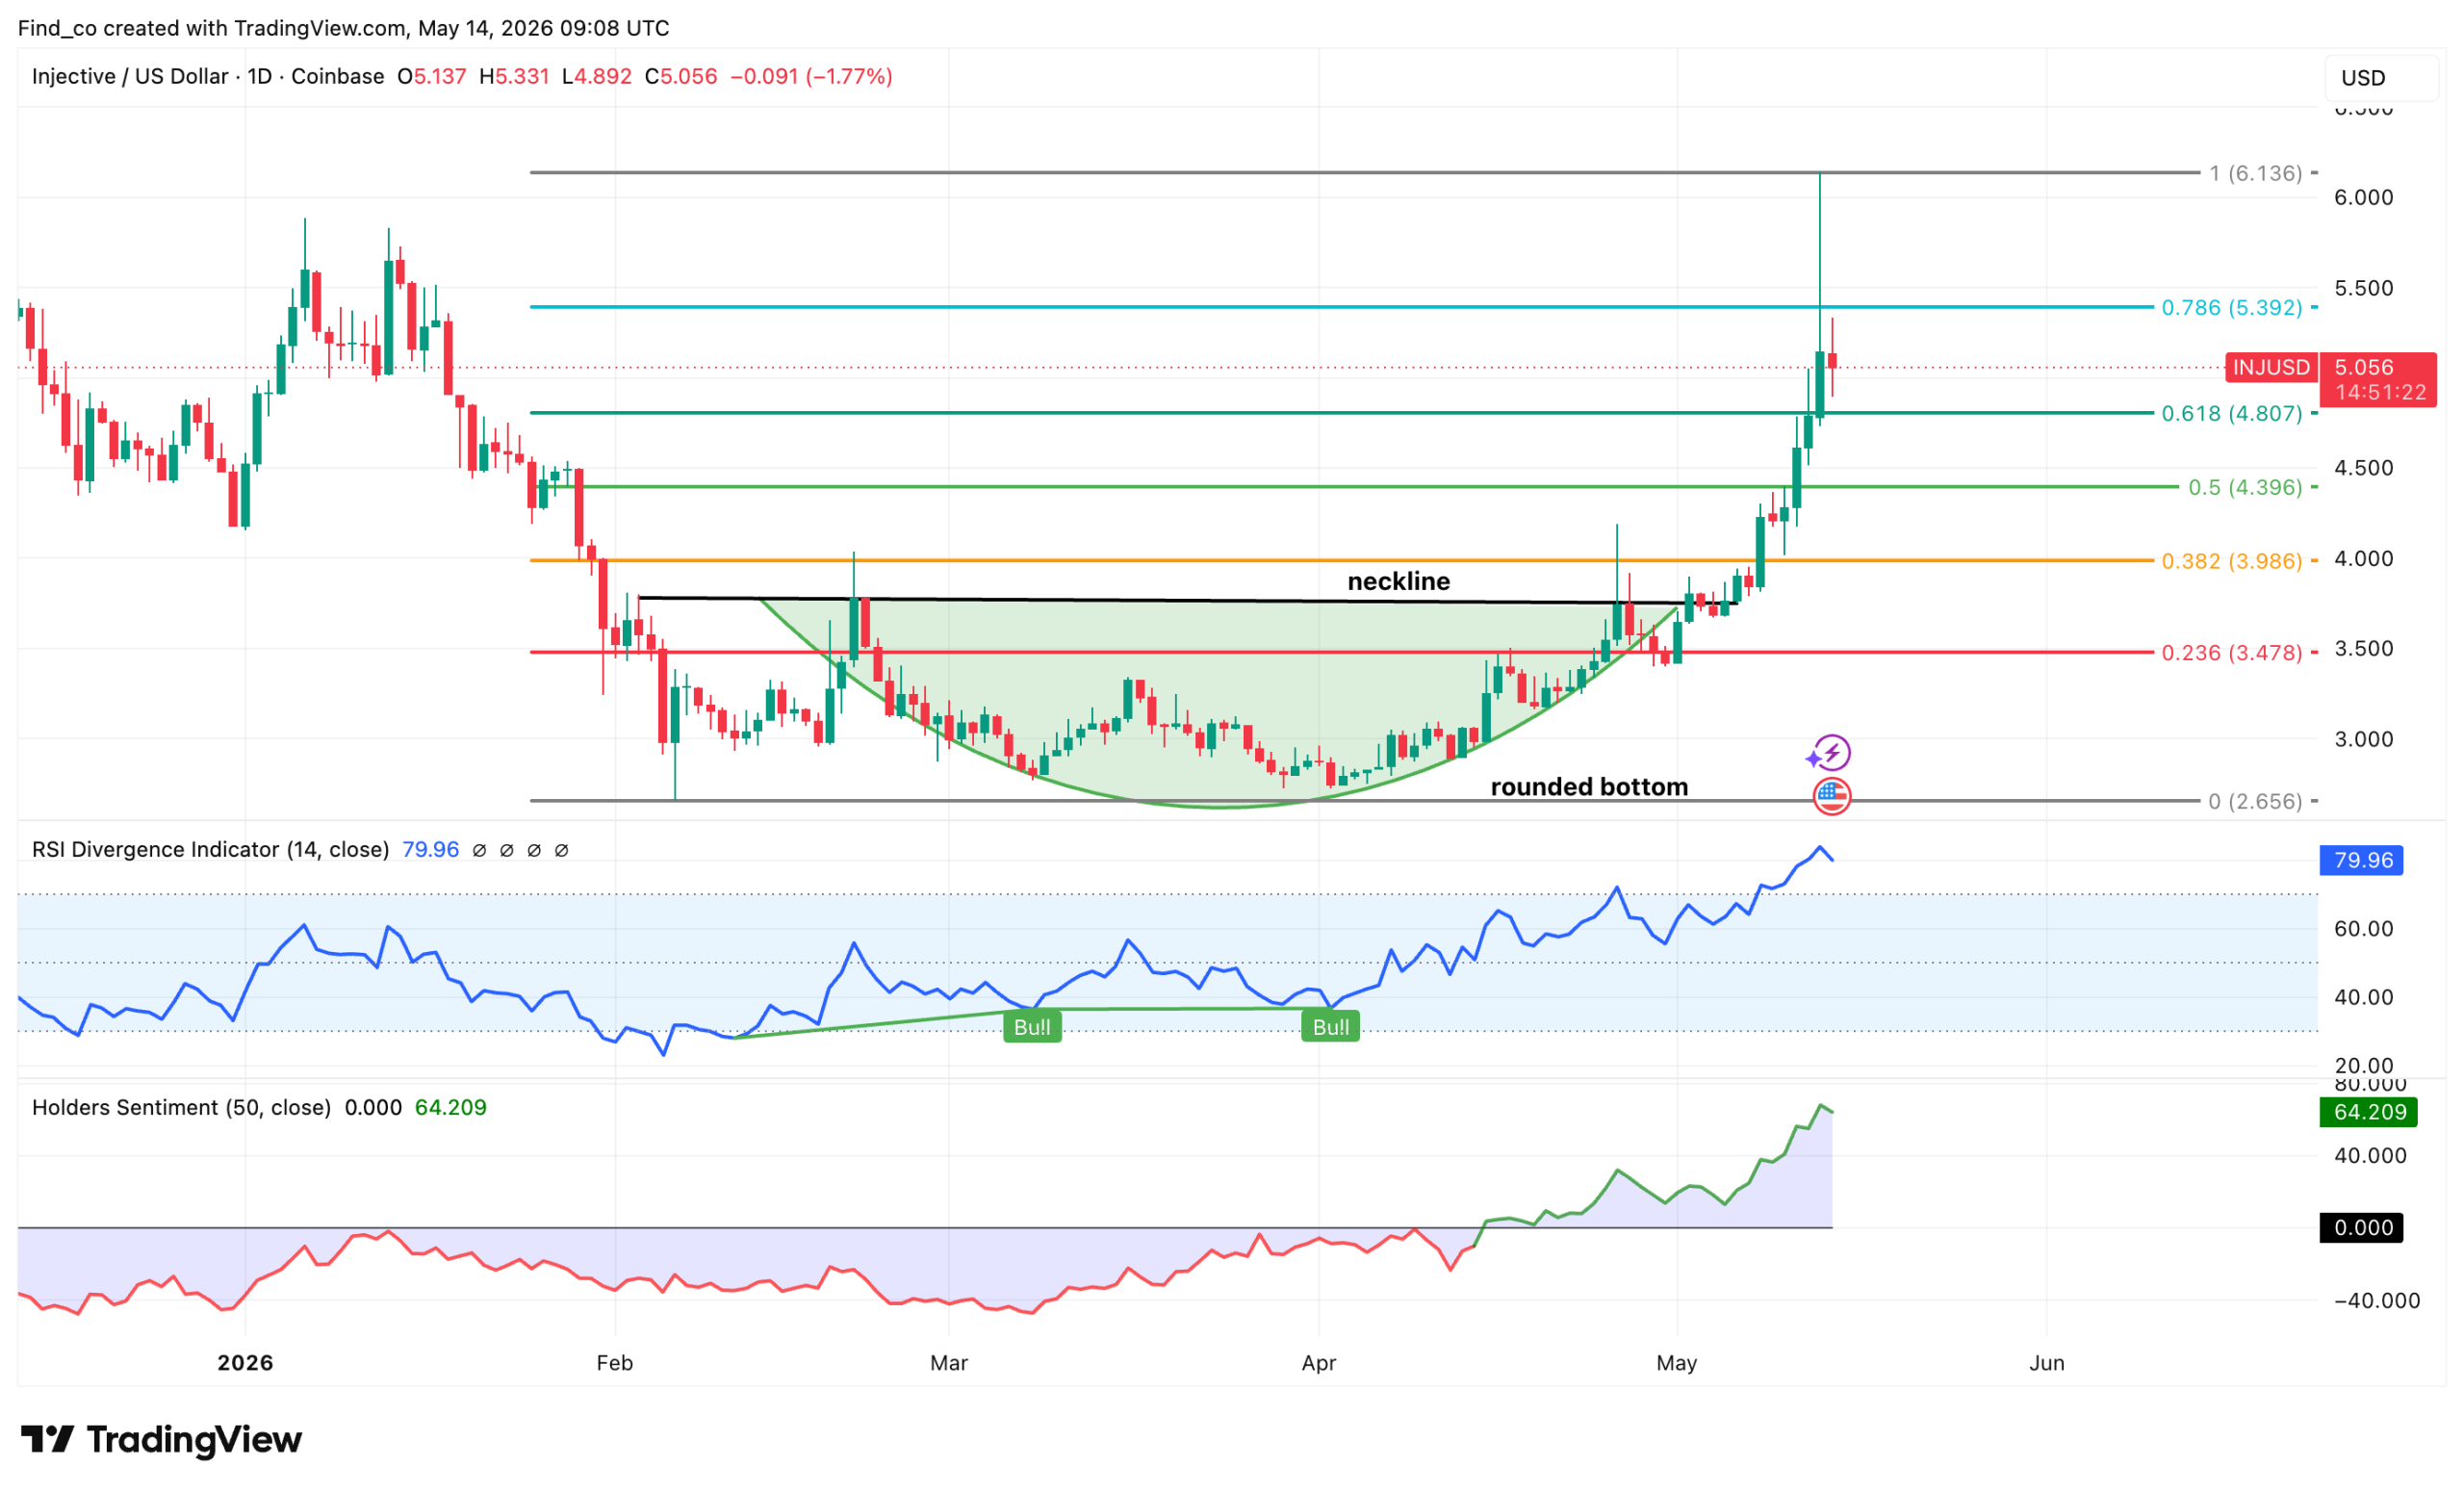
After months of consolidation between roughly $2.60 and $3.80, the price finally broke above the neckline resistance near $3.85.
The breakout has already pushed INJ’s price above the 0.5 Fibonacci level at $4.39 and into the 0.618 resistance zone around $4.80.
Notably, Injective’s price briefly tagged the 0.786 level near $5.39 before seeing some rejection.
For those unfamiliar, this is normal after such an aggressive breakout. This area is now acting as the first major resistance zone.
In addition, the Relative Strength Index (RSI) is near 80, showing strong momentum. However, it also signals that INJ may be overheated in the short term.
At the same time, holders’ sentiment continues to rise, suggesting increasing confidence from market participants.
As long as INJ holds above the neckline breakout zone around $4, the overall structure remains bullish.
A consolidation above the 0.618 Fibonacci level could prepare the market for another attempt toward the $5.40 resistance and eventually the psychological $6 region.
Alternatively, an increase in selling pressure might invalidate the move. In that scenario, INJ might drop to $3.48.
Disclaimer:
The information provided in this article is for informational purposes only. It is not intended to be, nor should it be construed as, financial advice. We do not make any warranties regarding the completeness, reliability, or accuracy of this information. All investments involve risk, and past performance does not guarantee future results. We recommend consulting a financial advisor before making any investment decisions.
Victor Olanrewaju is a crypto analyst and reporter at CCN with deep roots in on-chain research and technical analysis. His crypto journey began in 2017, but it was the 2020 Uniswap airdrop that sparked a full-time pivot into the space.
With a foundation in copywriting, Victor honed his craft creating high-converting content for leading crypto brokers — most notably an XRP price prediction that ranked #1 on Google during the 2021 bull run.
He later joined AMBCrypto in 2022, where he combined storytelling with technical and on-chain analysis to cover key market narratives.
In 2024, he expanded his expertise at BeInCrypto, collaborating with analysts and using tools like Glassnode, Santiment, and IntoTheBlock to break down Bitcoin and altcoin trends.
At CCN, Victor covers the top cryptocurrencies, memecoins, macro shifts, blending real-time insights with deep-dive metrics.
He holds a Bachelor’s degree in Physics from the University of Ibadan, equipping him to simplify complex data for a wide audience. Follow his work or connect on LinkedIn or X.