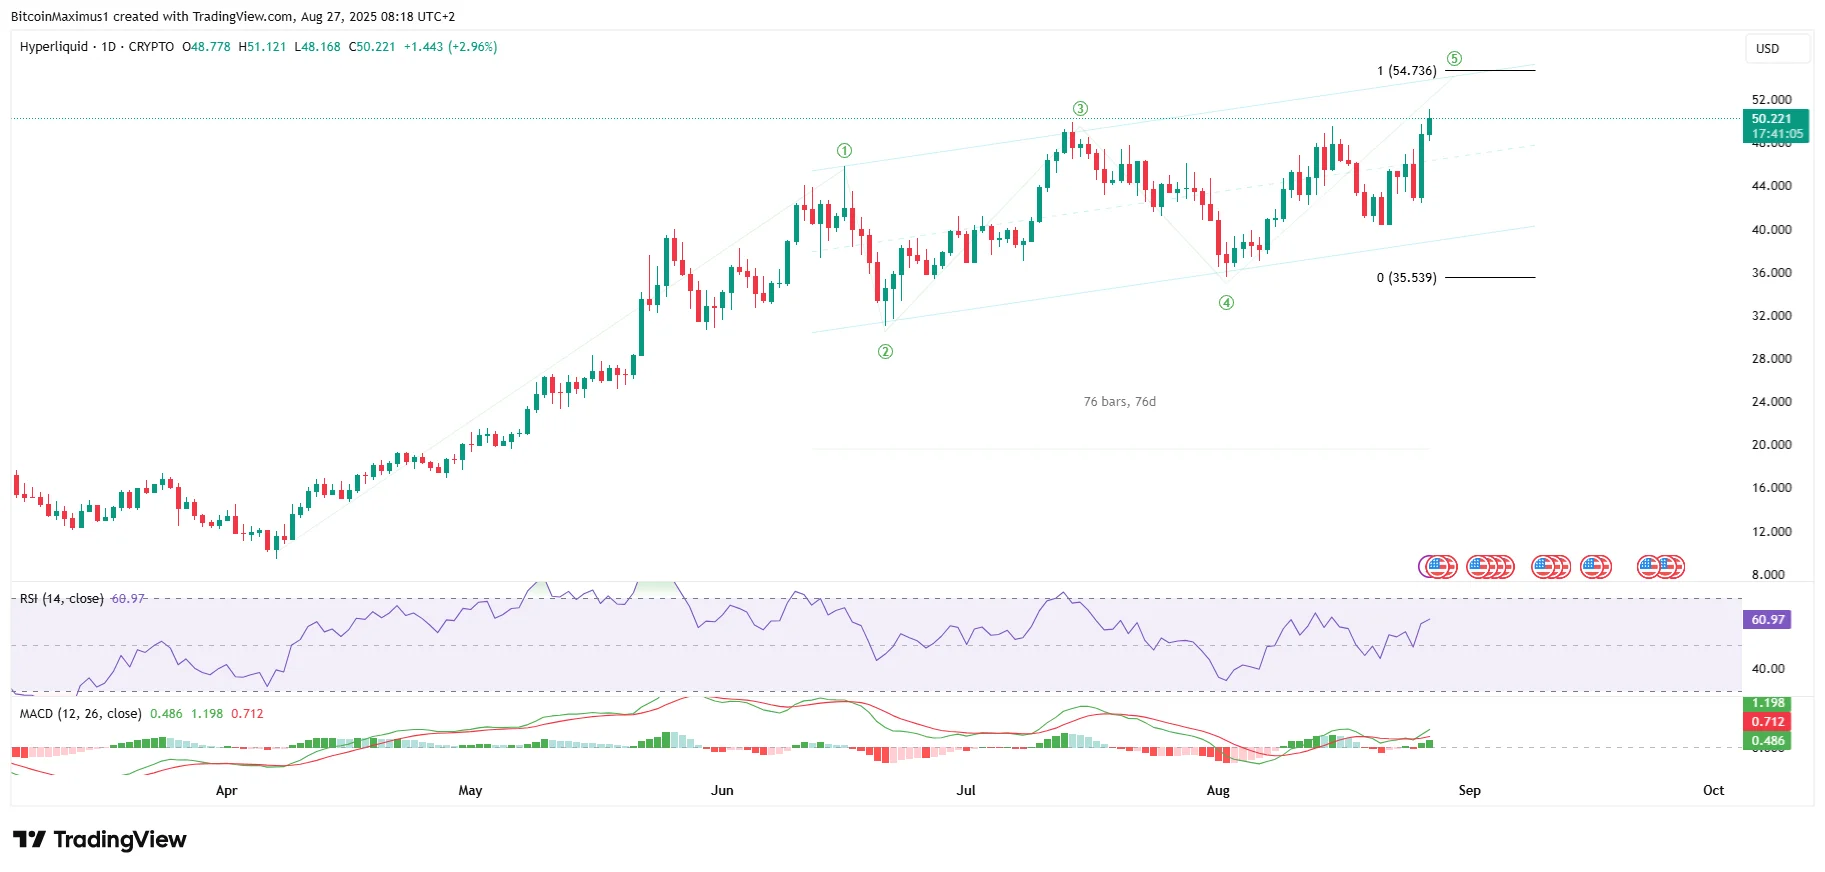
Hyperliquid (HYPE) reached a new all-time high today.
XPL launched on Hyperliquid today, triggering a short squeeze.
Hyperliquid has surpassed Robinhood in monthly volume.
Hyperliquid’s native token HYPE has hit a fresh all-time high price, cementing its place as the fastest-growing decentralized exchange.
Its volume has outpaced Robinhood for the third straight month, and revenue has soared past $28 million weekly.
With that in mind, let’s analyze the price action and determine how long the upward trend can continue.
Hyperliquid Revenue & Volume
Hyperliquid has quickly become one of the most talked-about decentralized exchanges in crypto, with revenues surpassing $28 million weekly and already outpacing every other Layer-1.
Its trading activity is even more impressive. It handled $330 billion, 39% more than Robinhood, which it has beaten for the third consecutive month.
Its volume has surpassed Robinhood’s for three consecutive months, handling $330 billion, 39% more than Robinhood.
The platform has also overtaken centralized exchanges (CEX) such as Bitstamp, while its perpetuals ratio compared to other CEXs and decentralized exchanges (DEX) continues to climb.
Get These Top Crypto Casino Offers Now!
Sponsored
Disclosure
We sometimes use affiliate links in our content, when clicking on those we might receive a commission at no extra cost to you. By using this website you agree to our terms and conditions and privacy policy.
As a decentralized exchange, Hyperliquid is attracting traders looking for alternatives to traditional centralized platforms.
That appeal was on full display during today’s XPL launch on Hyperliquid, when a whale later revealed to be Justin Sun deposited $16 million, driving the token price to $1.8 before exiting with a $15 million profit.
The selloff caused the price to crash, leading to more than $16 million in short losses, including one trader who lost $7 million in a single move.
The event highlights both the lucrative opportunities and the liquidity risks that come with emerging DEXs.
Hyperliquid’s growing buzz has served its native token, HYPE, taking it to a new all-time high.
HYPE All-Time High Price
The HYPE price has increased by more than 400% since its all-time low on April 7, hitting a new all-time high of $51.12 on Aug. 27.
While momentum is firmly on the bulls’ side, there are concerning signs developing.
The ascending parallel channel and choppy movement for the past 76 days are chief among them.
These channels usually lead to breakdown, so the rally might be coming to an end soon.
Despite this perceived weakness, technical indicators are bullish. The Relative Strength Index (RSI) and Moving Average Convergence/Divergence (MACD) are both surging.
The wave count can help settle the debate on whether the price action is bullish or bearish.
According to the count, the HYPE price may be in the fifth and final wave of an upward movement that started in April.
If this is the case, the channel contains an ending diagonal, meaning HYPE is in its rally’s final portion.
Elliott Wave theory rules state that wave three cannot be the shortest out of the bullish waves.
Wave five cannot reach $54.70 for this rule to remain unbroken. If it does, a breakout from the channel and parabolic increase to new highs will be likely.
If the HYPE price fails to reach $54.70 and returns to the channel’s support trend line, it will make a breakdown much more likely.
HYPE at a Crossroads
The surge in HYPE’s price reflects the growing momentum behind Hyperliquid, but the chart shows signs of a possible cooldown.
If the rally clears resistance near $54, another breakout could follow, but failure to do so may trigger a sharp pullback.
HYPE faces a make-or-break moment that could define its long-term trend.
Disclaimer:
The information provided in this article is for informational purposes only. It is not intended to be, nor should it be construed as, financial advice. We do not make any warranties regarding the completeness, reliability, or accuracy of this information. All investments involve risk, and past performance does not guarantee future results. We recommend consulting a financial advisor before making any investment decisions.
Valdrin Tahiri is a cryptocurrency analyst and reporter at CCN, specializing in technical analysis with a focus on Elliott Wave theory, on-chain metrics, and fundamental research. He brings over seven years of experience in the crypto space as both a trader and writer.
He discovered cryptocurrencies in 2017 while earning his MSc in Financial Markets at the Barcelona School of Economics, which sparked a deep interest in blockchain and market dynamics. Since then, he’s contributed to top crypto outlets like BeInCrypto and CoinGape.
Valdrin also served as Community Manager of BeInCrypto’s Telegram group for three years, helping grow it into one of the largest crypto communities worldwide. His expertise in market structure and price patterns allows him to break down complex trends into clear, actionable insights.
He’s published thousands of articles covering altcoins, Bitcoin cycles, and macro trends.