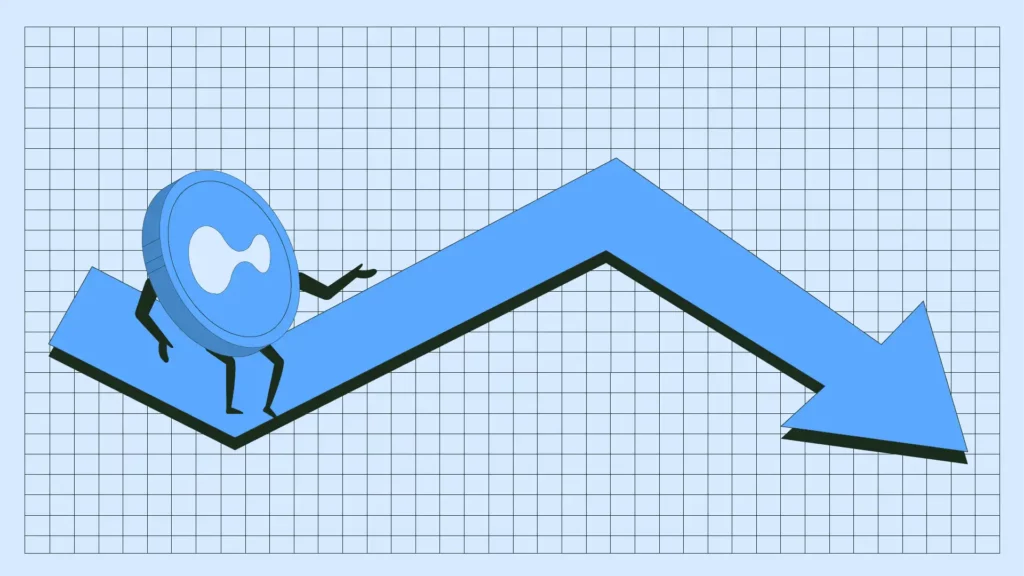
After a mild bounce to $14.85 three days ago, Hyperliquid’s (HYPE) price has flashed a red candlestick for the second consecutive day. This decline has left HYPE’s 30-day performance at a 50% fall.
This makes it one of the worst performers out of the top 100. The steep drop has also shaken confidence in the market, especially as HYPE was one of the top performers some months back.
Is HYPE near the bottom, or is this the beginning of a prolonged bearish trend?
Hyperliquid’s price, which was $35 last December, trades below $13 today. This decline aligns with CCN’s previous analysis, which predicted an extended correction.
According to the daily chart, the Relative Strength Index (RSI) shows this decline has placed HYPE at an oversold region. The RSI measures momentum using the speed and size of price changes.
It also shows when an asset is overbought or oversold. An asset hit the overbought region when the RSI reading is above 70.00.
Conversely, a reading less than 30.00 means it is oversold. On the daily HYPE/USDT chart, the RSI has dropped to 23.52.
Furthermore, despite being oversold, HYPE will unlikely see a bullish turnaround soon. One indicator supporting this bias is the Awesome Oscillator (AO), which also measures momentum
As of this writing, the AO reading is negative, indicating bearish momentum. Therefore, if the trend continues, HYPE might fail to rebound in the short term.
Social Dominance Drops
Amid this price action, the social dominance around HYPE has fallen. Social dominance measures the level of discussions around a cryptocurrency.
When it rises, it means that the asset is getting a lot of attention, which could fuel increased demand. However, according to Santiment, HYPE’s social dominance has dropped to 0.558%, indicating low market interest.
If this remains the same, then demand for the token might continue to fall, possibly negatively affecting the price.
Looking at the daily chart again, CCN observed that the Ichimoku Cloud has risen above HYPE’s price. The Ichimoku Cloud shows if a cryptocurrency has found support or is at a resistance level.
When the cloud is below the price, it indicates support, indicating that the price can increase. However, if the cloud is above the price, it represents resistance.
As of this writing, the resistance around $21 has pushed HYPE’s price further down, leading to a drop below the key support near $15.06.
With no buying pressure, HYPE is likely to continue its correction. If validated, the cryptocurrency’s value might drop to $10.23.
However, if the token reclaims the $15.06 support and rises past $21, this decline might not happen. Instead, HYPE’s price might climb to $28.43 near the 0.786 Fibonacci level.
Disclaimer:
The information provided in this article is for informational purposes only. It is not intended to be, nor should it be construed as, financial advice. We do not make any warranties regarding the completeness, reliability, or accuracy of this information. All investments involve risk, and past performance does not guarantee future results. We recommend consulting a financial advisor before making any investment decisions.
Victor Olanrewaju is a crypto analyst and reporter at CCN with deep roots in on-chain research and technical analysis. His crypto journey began in 2017, but it was the 2020 Uniswap airdrop that sparked a full-time pivot into the space.
With a foundation in copywriting, Victor honed his craft creating high-converting content for leading crypto brokers — most notably an XRP price prediction that ranked #1 on Google during the 2021 bull run.
He later joined AMBCrypto in 2022, where he combined storytelling with technical and on-chain analysis to cover key market narratives.
In 2024, he expanded his expertise at BeInCrypto, collaborating with analysts and using tools like Glassnode, Santiment, and IntoTheBlock to break down Bitcoin and altcoin trends.
At CCN, Victor covers the top cryptocurrencies, memecoins, macro shifts, blending real-time insights with deep-dive metrics.
He holds a Bachelor’s degree in Physics from the University of Ibadan, equipping him to simplify complex data for a wide audience. Follow his work or connect on LinkedIn or X.