HYPE made a decrease after reaching all-time high, but found support at the ascending channel. Will it bounce and recover further?
Share
Key Takeaways
Wave B likely targets $30.15–$31.31 resistance range.
Wave C is projected to test the $25.24–$21.53 support zone.
The current trend remains bearish unless wave 5’s high breaks.
The chart reflects recent price action, showcasing a corrective ABC structure after a significant five-wave impulse made a new all-time high.
Following the peak at wave 5, the price retraced sharply to form wave A and is now attempting a rebound in wave B. Potential resistance is at key Fibonacci levels.
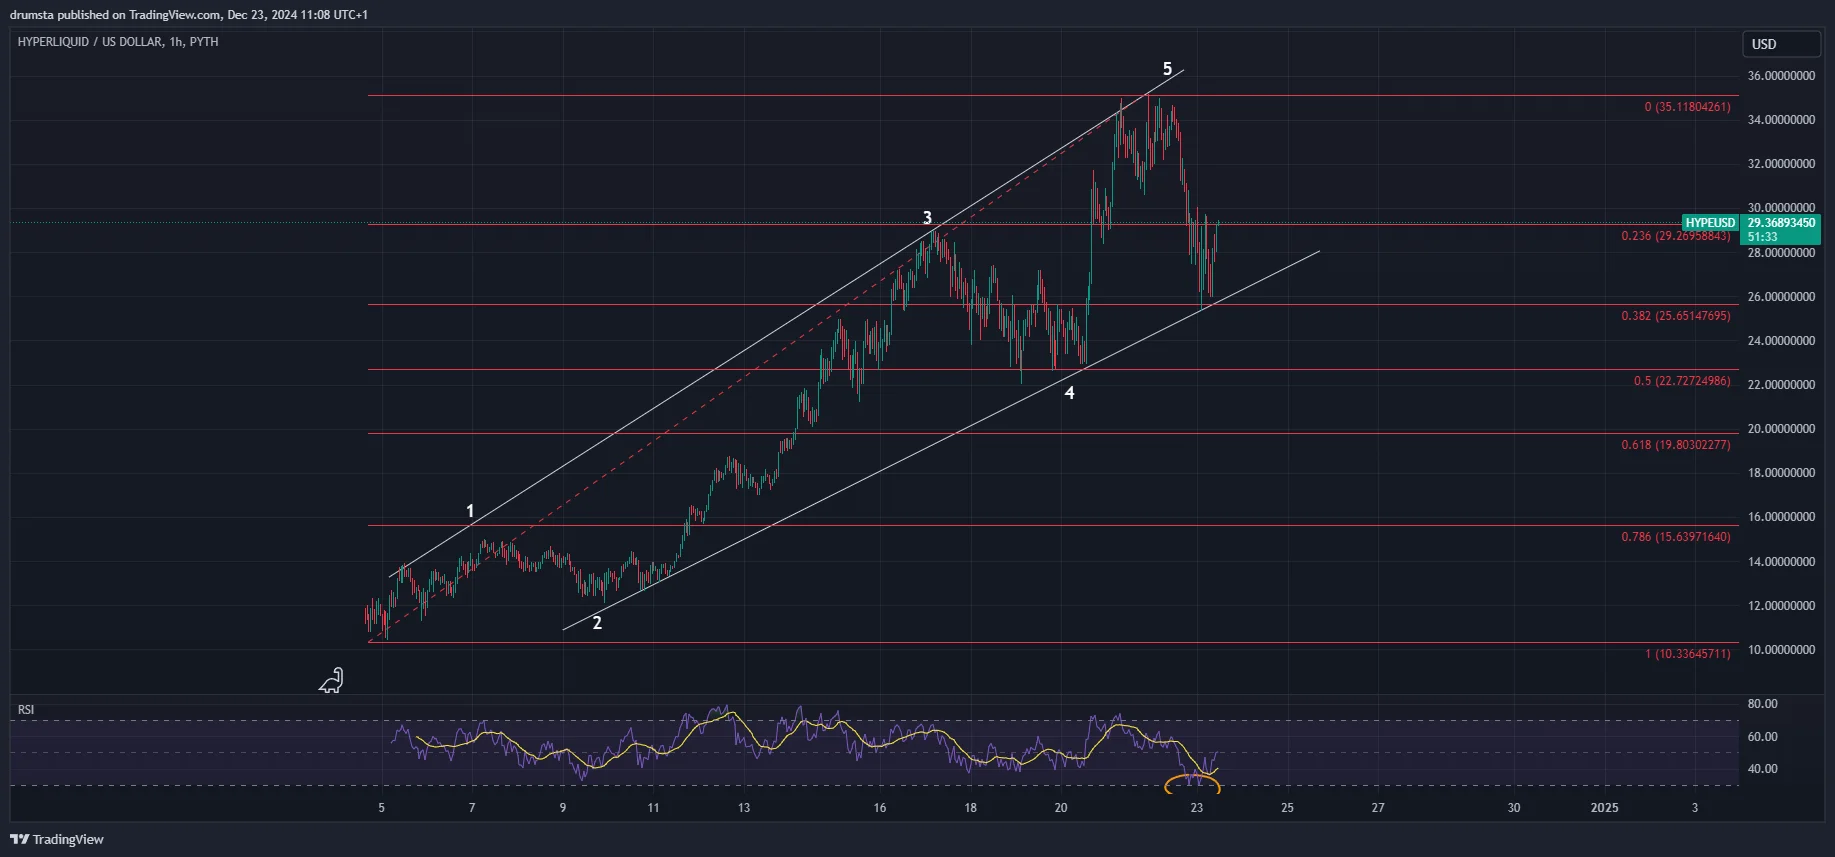
The hourly chart illustrates a five-wave structure, which aligns with the Elliott Wave theory. The price reached a high at wave 5 of $35.20 on Dec. 21 before retracing sharply to test the support trendline. The price fell to retest the ascending support from the ascending channel at $25.
HYPEUSD price bounced from ascending support | Credit: Nikola Lazic/TradingView
The daily Relative Strength Index (RSI) indicated oversold conditions, as evidenced by the recent bounce off the lower levels. This suggests a potential for short-term upward movement, and the price recovered to 17%, a high of $29.
However, the RSI pattern shows weakening bullish momentum during the price rally, implying that the uptrend might be losing strength. The price quickly fell to $27.30 at its lowest point today.
The price currently hovers near the 0.236 Fibonacci retracement level at $29.36, acting as short-term support. The long-term trendline from waves 1 and 2 remains intact, keeping the bullish trend valid unless the price breaks below this structure.
The price respects the ascending trendline and maintains a bullish outlook.
A break below the trendline could signal a shift to a bearish phase.
HYPE Price Prediction
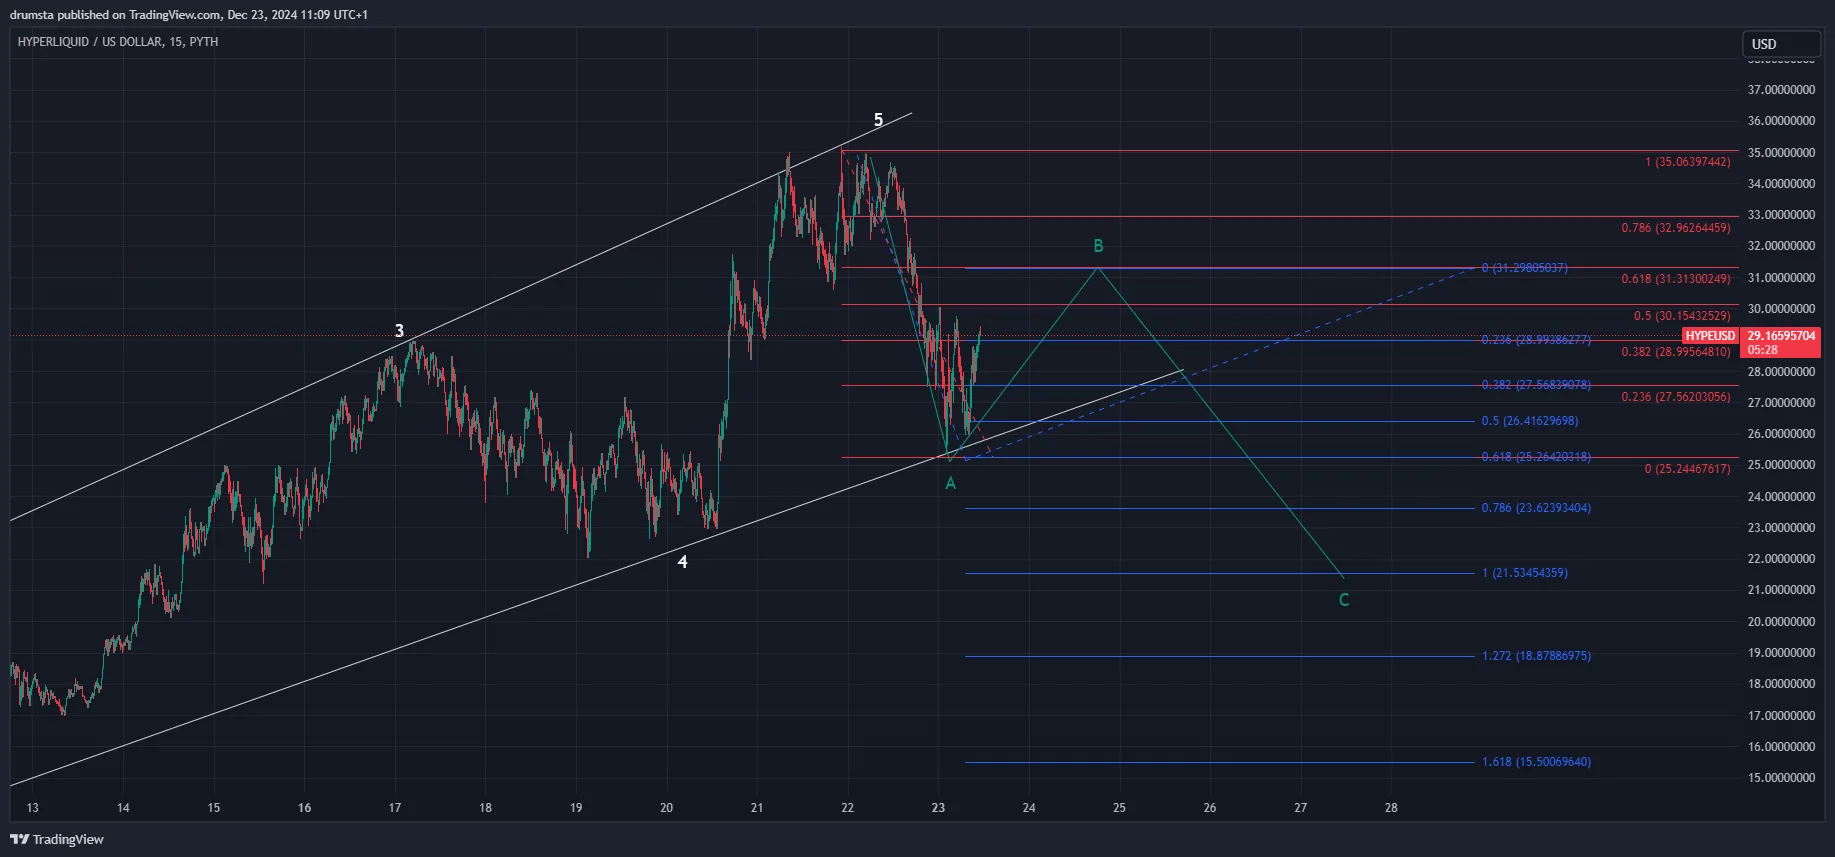
The 15-minute chart displays a corrective ABC structure following the five-wave impulse. The price has completed wave A and is in the early stages of wave B, which could retrace to a key Fibonacci level, possibly 0.5, 0.618, of the drop from wave 5 to A.
Our target is $31, but the recovery could end sooner.
HYPEUSD recovery expected | Credit: Nikola Lazic/TradingView
The projected path for wave C indicates a potential deeper retracement. The Fibonacci extensions highlight targets for wave C, such as 1.0, 1.272, and 1.618 levels.
The overall trend remains bearish unless wave B invalidates the structure by breaking above wave 5’s high.
Key support levels from the Fibonacci retracements include the prior low of $25.14 and $27.56 (0.236).
Potential resistance levels during wave B include $30.15 (0.5) and $31.31 (0.618), which coincide with the downward trendline from wave 5.
Key Levels to Watch:
Support Levels:
$27.56 (0.236 Fibonacci retracement)
$26.41 (0.382 Fibonacci retracement)
$25.24 (prior low)
$21.53 (1.0 Fibonacci extension of wave C)
Resistance Levels:
$30.15 (0.5 Fibonacci retracement of wave B)
$31.31 (0.618 Fibonacci retracement of wave B)
$32.96 (0.786 Fibonacci retracement of wave B)
Disclaimer:
The information provided in this article is for informational purposes only. It is not intended to be, nor should it be construed as, financial advice. We do not make any warranties regarding the completeness, reliability, or accuracy of this information. All investments involve risk, and past performance does not guarantee future results. We recommend consulting a financial advisor before making any investment decisions.
Nikola Lazic is a cryptocurrency analyst and investor working in the industry since 2017. He holds a bachelor's degree in Sociology, which enables him to better understand the psychology behind the crowd´s positioning. Consequently his preferred analytical tool is Elliott Wave Theory in combination with price action analysis.
Combining his experience in trading and investing with knowledge in content writing he strives to bring the most accurate and actionable information.