The Graph (GRT) recently broke out of a long-term falling wedge, confirming the end of its corrective phase and initiating a new impulsive wave structure.
As momentum builds, price action consolidates above key support levels while forming a textbook five-wave impulse on the lower time frame.
The bullish thesis remains intact, provided key retracement levels hold.
GRT Price Analysis
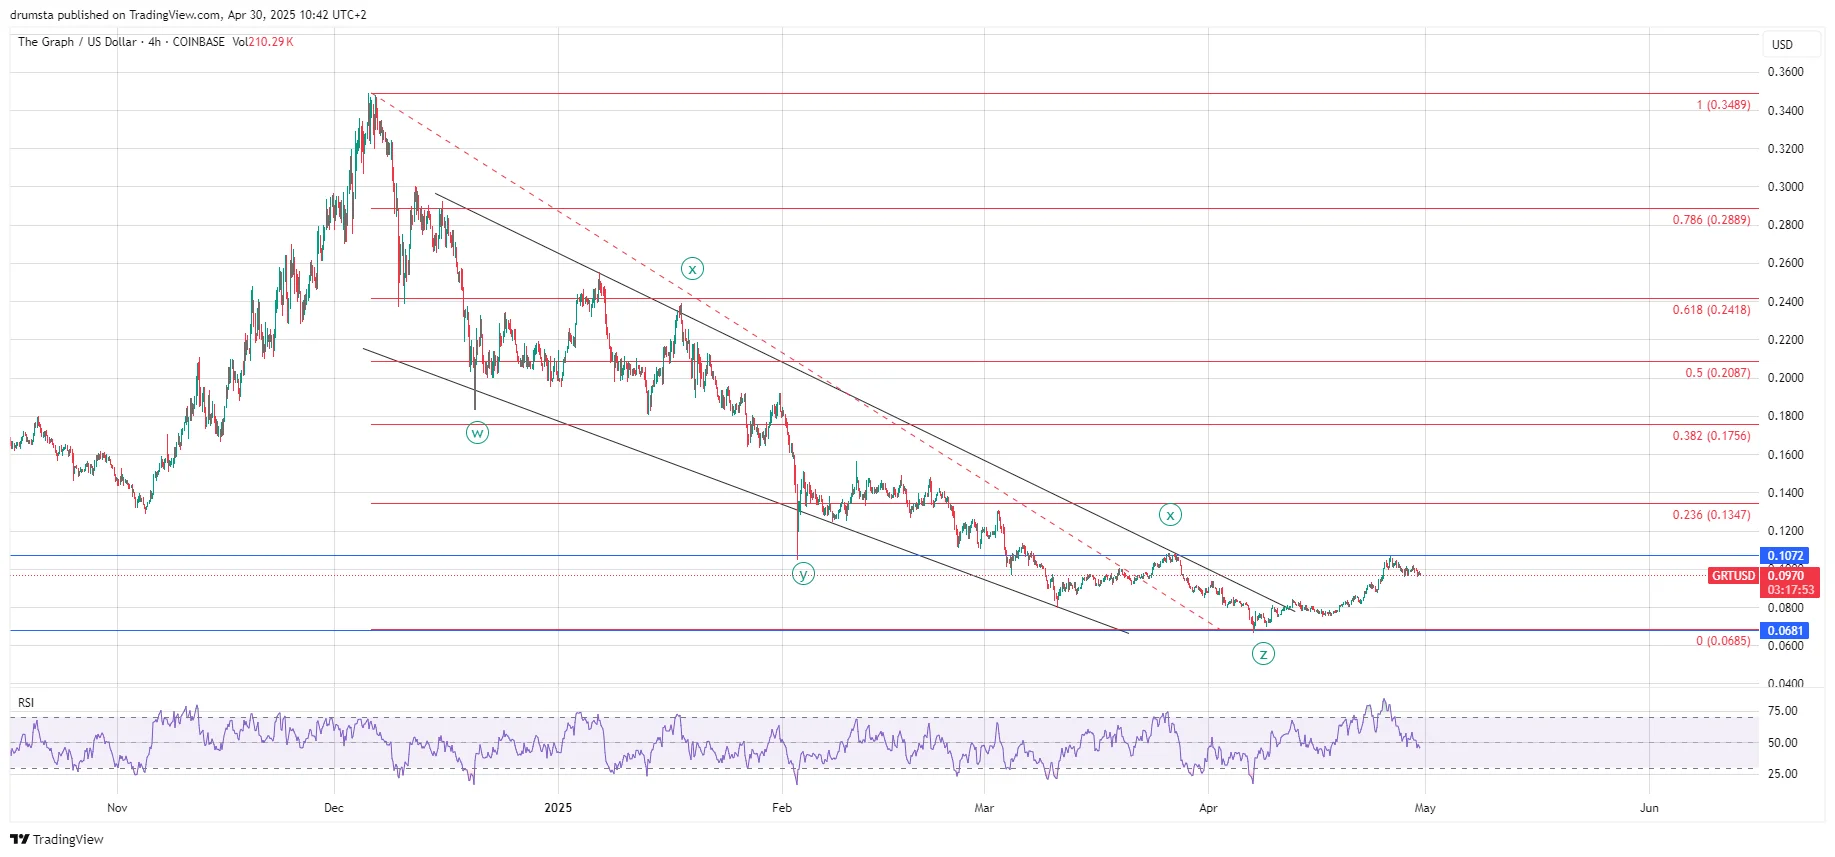
On the 4-hour chart, GRT completed a complex WXYXZ correction at $0.0664 on April 7, lasting since the peak on Dec. 5 at $0.348.
A rise in the Relative Strength Index (RSI) on the 4-hour chart supported the breakout from this wedge, confirming the shift in momentum.
After bottoming at $0.0664, GRT began forming a higher low structure, climbing above the critical resistance level of $0.080 and retesting $0.1072, which now acts as a major horizontal barrier.
If GRT successfully holds above $0.0956 support (the recent swing low), bullish continuation remains the most likely scenario.
A daily close above $0.1072 would signal the next leg higher, targeting $0.1347 and $0.1756, the 0.236 and 0.382 macro Fibonacci retracements.
Failure to hold above $0.0956 would risk a deeper retracement or a full retest of $0.080 support.
However, broader market sentiment and structure favor the bullish side for now.
GRT Price Prediction
The 1-hour chart displays a developing five-wave impulsive structure from the structure low at $0.066.
After a strong rally that peaked in wave (iii) at $0.1067 on April 26, GRT entered a sideways correction, now labeled as wave (iv).
Wave (iv) appears to form a descending triangle, a continuation pattern that typically resolves to the upside.
This retracement has respected the descending triangle structure, consolidating the price around $0.096.
The expected breakout target for wave (v) lies between $0.1146 (0.618 Fib extension) and $0.1198 (0.786 extension).
If the bullish momentum accelerates, the 1.618 Fib at $0.1455 is also a viable target.
The RSI on the 1-hour timeframe is neutral and slightly rising, indicating that wave (v) has sufficient room to develop without prematurely entering overbought territory.
A break above the descending triangle resistance would confirm the next upward impulse.
If the price fails to hold $0.0956 support, the bullish count may be invalidated, possibly delaying the breakout.
However, given the impulsive structure and current consolidation above support, the probability leans toward continuation.
Key Levels to Watch
Major Support: $0.0956 (wave iv low), $0.080 (macro support).
Disclaimer:
The information provided in this article is for informational purposes only. It is not intended to be, nor should it be construed as, financial advice. We do not make any warranties regarding the completeness, reliability, or accuracy of this information. All investments involve risk, and past performance does not guarantee future results. We recommend consulting a financial advisor before making any investment decisions.
Nikola Lazic is a cryptocurrency analyst and investor working in the industry since 2017. He holds a bachelor's degree in Sociology, which enables him to better understand the psychology behind the crowd´s positioning. Consequently his preferred analytical tool is Elliott Wave Theory in combination with price action analysis.
Combining his experience in trading and investing with knowledge in content writing he strives to bring the most accurate and actionable information.