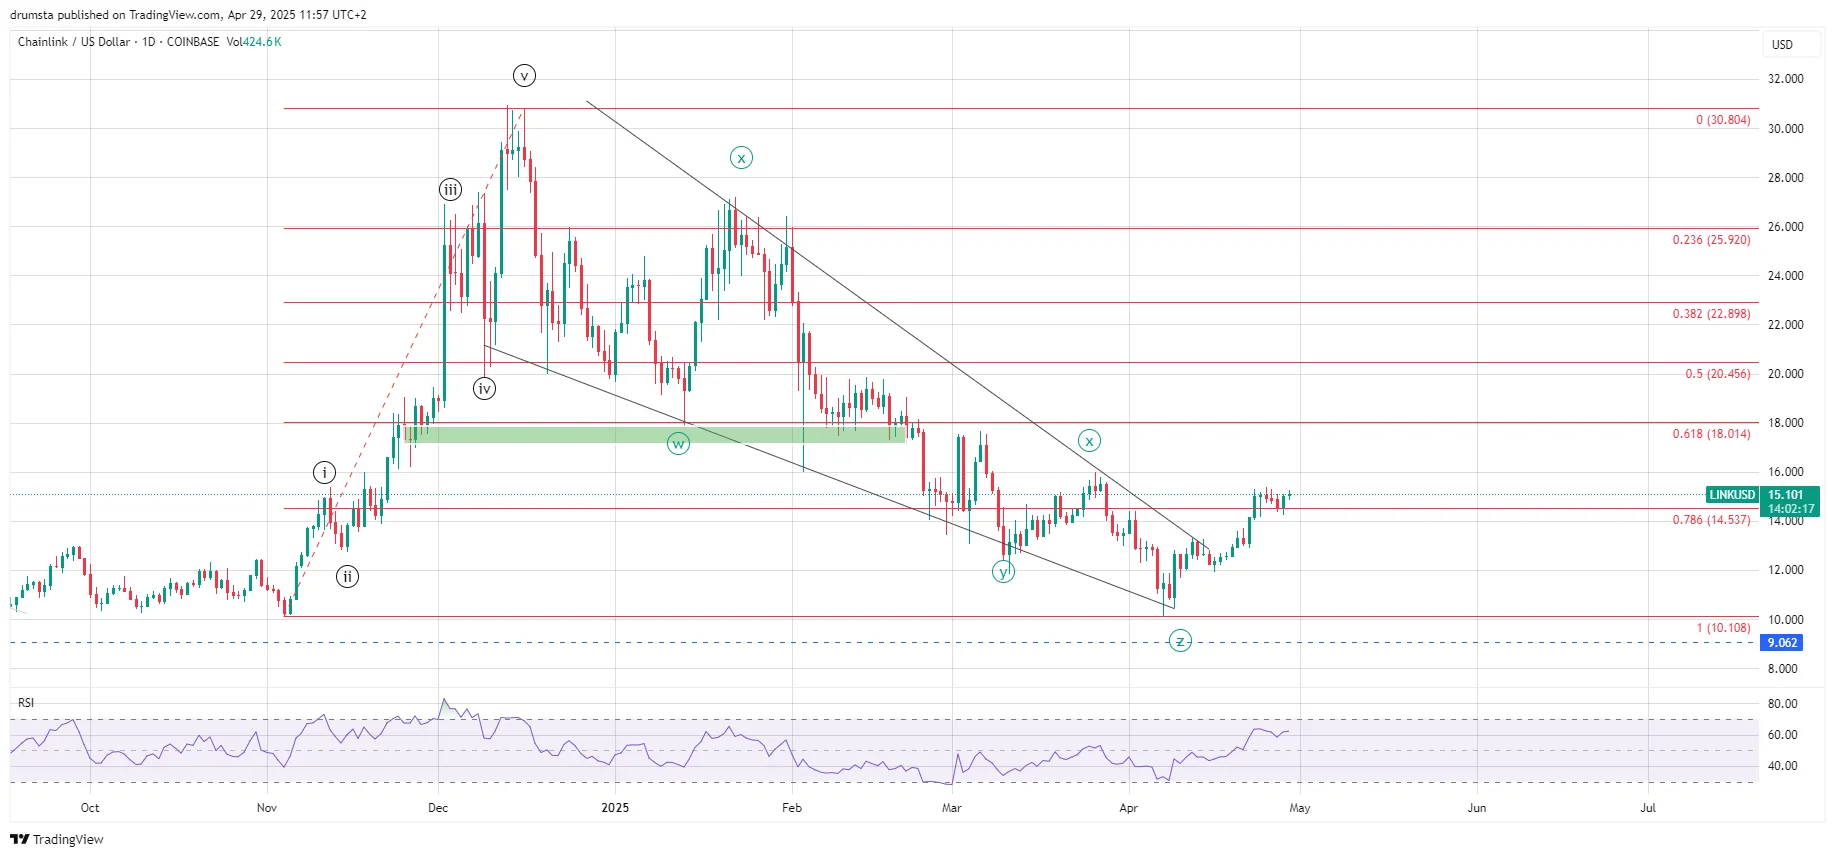
The decline formed a WXYXZ pattern within a falling wedge structure that bottomed on April 7 at $10 (1.0 Fib), marking the completion of the corrective pattern.
The daily Relative Strength Index (RSI) reached oversold conditions when the structure bottomed, suggesting that the correction is complete.
An impulsive move was initiated from the structure low, breaking above the descending trendline on April 19.
The breakout marked the end of a prolonged correction and the beginning of a recovery.
The upward move surpassed the 0.786 resistance ($14.53) on April 23, which currently trades at that level.
The price action recently reached a local high of $15.35, a 50% rise from the previous low.
LINK could continue upward movement if momentum sustains, with the resistance at $18 (0.618 Fib) marked as the next key target.
Failure to hold above 0.786 likely means another leg down will unfold before LINK continues its upward trajectory.
LINK Price Prediction
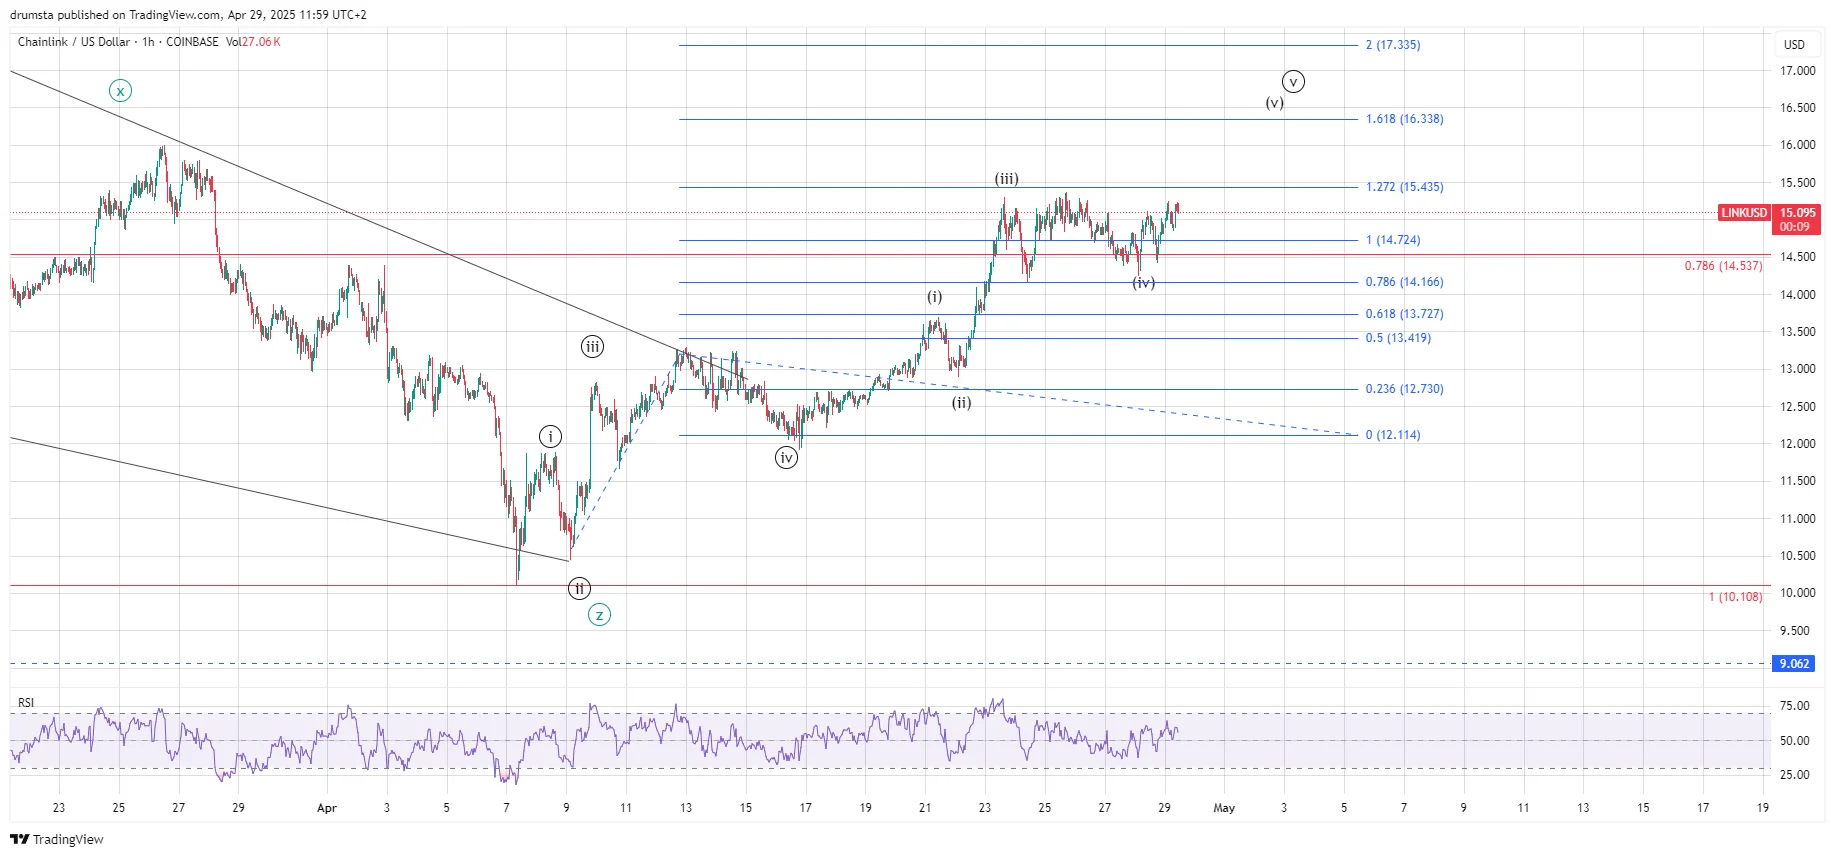
On the one-hour chart, LINK initiated a five-wave impulse from the wave Z low, completing a wave (4) pullback to $11.95. Wave (5) is currently unfolding.
If we examine the chart more closely, we can see a lower-degree five-wave impulse within the larger-scale wave (5).
Wave (v) faces resistance at 1.272 at $15.43. The next projected target is the 1.618 level at $16.33 if surpassed.
The sub-wave recently completed a wave (iv) pullback to $14.25, setting the stage for an upward move to 15.43 (1.272 Fib extension) next.
From the larger-scale five-wave impulse, we can see a similar setup. The price previously consolidated within wave (iv), which was followed by a sharp upward move.
The RSI coincides with the price consolidation. It is currently in neutral conditions, leaving room for more upside.
If the price reaches $15.43 (1.272 Fib) and holds above that level, it would confirm the bullish outlook.
On the other hand, if the price fails to hold above $14.16 (0.786 Fib extension), we could see a deeper retracement and an invalidation of the bullish scenario.
Disclaimer:
The information provided in this article is for informational purposes only. It is not intended to be, nor should it be construed as, financial advice. We do not make any warranties regarding the completeness, reliability, or accuracy of this information. All investments involve risk, and past performance does not guarantee future results. We recommend consulting a financial advisor before making any investment decisions.
Nikola Lazic is a cryptocurrency analyst and investor working in the industry since 2017. He holds a bachelor's degree in Sociology, which enables him to better understand the psychology behind the crowd´s positioning. Consequently his preferred analytical tool is Elliott Wave Theory in combination with price action analysis.
Combining his experience in trading and investing with knowledge in content writing he strives to bring the most accurate and actionable information.