Has FLOKI Started Its Bear Market? | Credit: Hameem Sarwar
Share
Key Takeaways
The FLOKI price has created a long-term triple-top pattern.
FLOKI broke down from a long-term horizontal support level.
Can FLOKI still rally to new highs, or is its bullish cycle over?
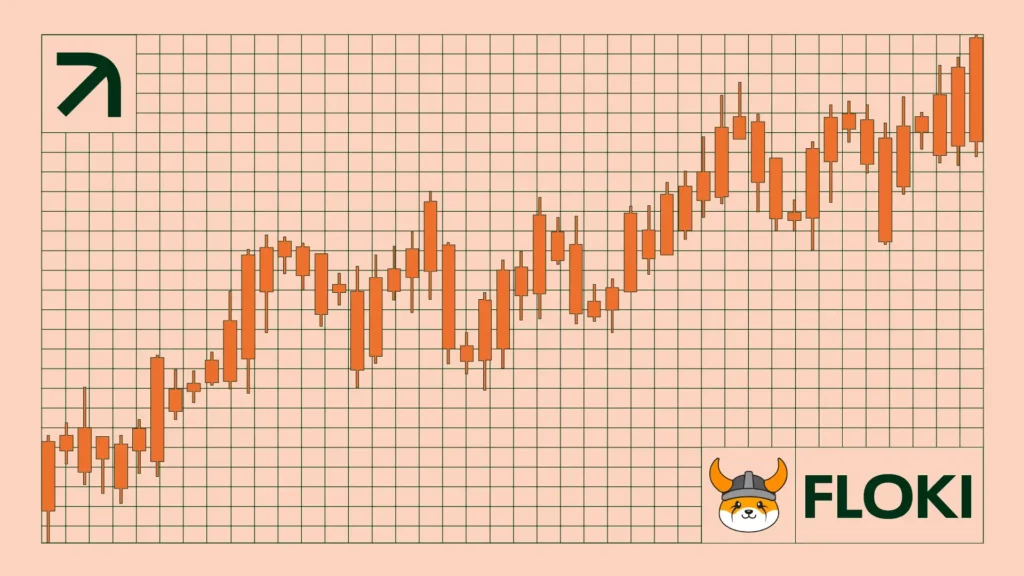
FLOKI had a remarkable rise in 2024, increasing over 1,000% in just a few months. The increase culminated with a new all-time high price of $0.000348 in June before falling.
Even though the price mustered enough strength to begin a rally later in the year, FLOKI failed to sustain its momentum, leading to a downturn in 2025. A recent breakdown from a critical support level intensified fears that a bear market has started.
Since sentiment is shifting, the question is whether FLOKI can begin a reversal or if new lows await.
The weekly time frame FLOKI chart shows that the price has fallen since creating a triple top pattern (white icons) at the $0.000265 horizontal resistance area. The decline started in December 2024, and the FLOKI price has fallen by 65% since then, culminating in a low of $0.000071 on Feb. 3, 2025.
The low was important because it caused a breakdown from the $0.000120 horizontal support area, which had existed for nearly a year and is the final horizontal support until $0.000046.
Technical indicators also provide a bearish outlook. The Relative Strength Index (RSI) and Moving Average Convergence/Divergence (MACD) are both falling and have crossed their bearish thresholds at 50 and 0, respectively.
So, the weekly chart suggests the FLOKI trend is bearish, and new lows will follow. Reclaiming the $0.000120 support area will invalidate this, though there are no signs that this will happen.
If the bearish outlook from the weekly time frame persists, FLOKI will start to wave three in a five-wave downward movement that will likely take the FLOKI price to new lows.
The sub-wave count is in yellow, showing that the meme coin has completed sub-wave one in this decline.
If the count is accurate, a significant bounce will follow soon, completing sub-wave two. Afterward, the price will likely resume its descent.
The more bullish alternative suggests that FLOKI has completed an A-B-C corrective structure (black) instead. In this possibility, the price would begin an upward movement soon, taking it to a new all-time high.
However, this does not fit the bearish long-term readings and the general weakness in Bitcoin (BTC) and the rest of the crypto market.
The reaction on the next bounce will be critical to determine the future trend.
corrective upward movement that stalls at important Fibonacci resistance levels will confirm the bearish count, while an impulsive bounce without retracements will suggest the trend is still bullish.
Bounce Before New Lows
FLOKI might have completed its bullish cycle after the meme coin created a long-term triple-top pattern. The breakdown below the $0.000120 horizontal support area supports this possibility.
While the wave count predicts FLOKI will bounce, it is unlikely that this will be a bullish trend reversal.
Disclaimer:
The information provided in this article is for informational purposes only. It is not intended to be, nor should it be construed as, financial advice. We do not make any warranties regarding the completeness, reliability, or accuracy of this information. All investments involve risk, and past performance does not guarantee future results. We recommend consulting a financial advisor before making any investment decisions.
Valdrin Tahiri is a cryptocurrency analyst and reporter at CCN, specializing in technical analysis with a focus on Elliott Wave theory, on-chain metrics, and fundamental research. He brings over seven years of experience in the crypto space as both a trader and writer.
He discovered cryptocurrencies in 2017 while earning his MSc in Financial Markets at the Barcelona School of Economics, which sparked a deep interest in blockchain and market dynamics. Since then, he’s contributed to top crypto outlets like BeInCrypto and CoinGape.
Valdrin also served as Community Manager of BeInCrypto’s Telegram group for three years, helping grow it into one of the largest crypto communities worldwide. His expertise in market structure and price patterns allows him to break down complex trends into clear, actionable insights.
He’s published thousands of articles covering altcoins, Bitcoin cycles, and macro trends.