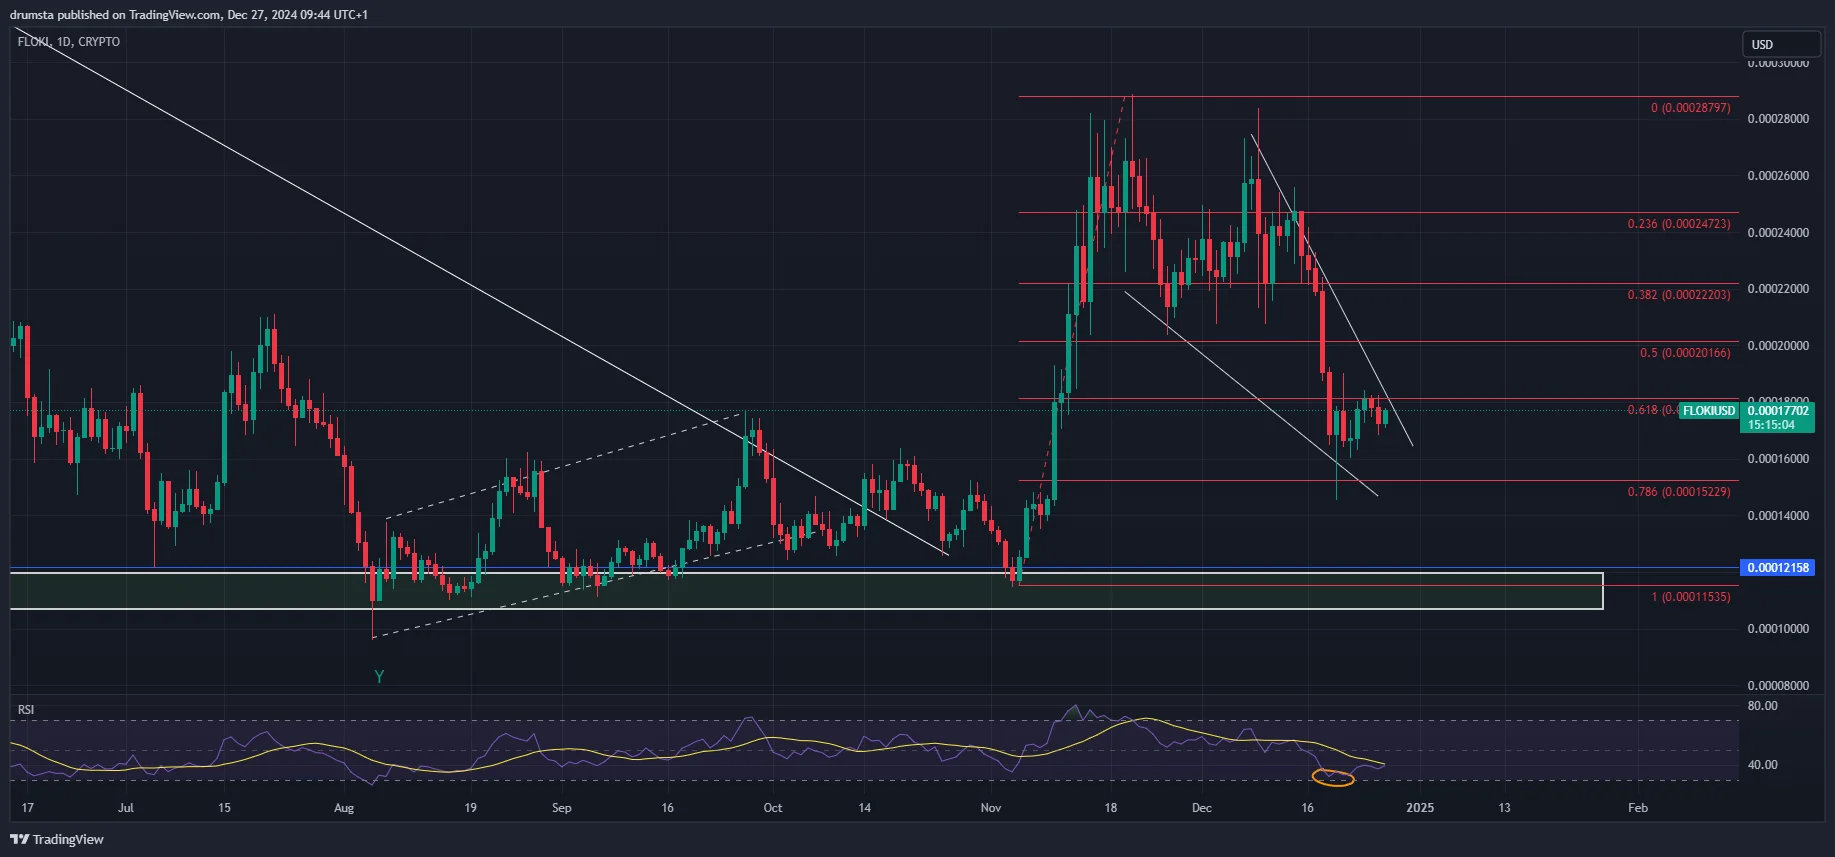
After a sharp dip to $0.000145 on Dec. 20, FLOKI attempted to break above the 0.618 Fibonacci level of $0.000181. However, resistance has held, and the price remains below this key threshold.
FLOKIUSD testing descending resistance | Credit: Nikola Lazic/TradingView
The recent 20% recovery suggests the corrective phase could be ending.
However, downward-sloping trendlines and persistent selling pressure indicate that bearish forces are still at play.
The Relative Strength Index (RSI), though showing slight divergence, remains below the neutral 50 mark, suggesting that the downtrend lacks momentum for now.
A key support zone is forming between $0.00012158 and $0.0001535, an area of historical accumulation.
Despite recent attempts at recovery, the price continues to face resistance at the descending trendline. Bulls are likely hesitant and are awaiting confirmation of a breakout before committing further.
FLOKI Price Prediction
On the hourly chart, the formation of a tightening symmetrical triangle suggests that a breakout could be imminent.
An Elliott Wave structure appears to be forming, with the recent low on Dec. 20 possibly marking the end of a corrective ABC wave. This setup could signal the start of a new bullish impulse, but a breakout above or below key levels will determine the direction.
FLOKIUSD symmetrical triangle indicates consolidation | Credit: Nikola Lazic/TradingView
If the price breaks above the descending trendline, it may target the 0.382 Fibonacci level at $0.00022 or higher. Conversely, a breakdown would likely push the price toward the critical support at $0.00015, with the next support zone at $0.00012.
The current consolidation phase could either mark the end of a corrective structure or the beginning of a bullish phase. The key will be the breakout direction from the symmetrical triangle, which will provide clarity on the next major move.
Disclaimer:
The information provided in this article is for informational purposes only. It is not intended to be, nor should it be construed as, financial advice. We do not make any warranties regarding the completeness, reliability, or accuracy of this information. All investments involve risk, and past performance does not guarantee future results. We recommend consulting a financial advisor before making any investment decisions.
Nikola Lazic is a cryptocurrency analyst and investor working in the industry since 2017. He holds a bachelor's degree in Sociology, which enables him to better understand the psychology behind the crowd´s positioning. Consequently his preferred analytical tool is Elliott Wave Theory in combination with price action analysis.
Combining his experience in trading and investing with knowledge in content writing he strives to bring the most accurate and actionable information.