Meet the Top 101 in Crypto

Ethena (ENA) Breaks 84-Day Resistance — Bulls Eye 25% Price Increase

Published 08 December 2025
Valdrin Tahiri
Authors
Edited by Insha Zia

Key Takeaways

  • Ethena (ENA) broke out from a diagonal resistance trend line.
  • The ENA price has shown bullish signs for the first time since September.
  • Can ENA build on its breakout and surge toward its main resistance at $0.35?

Ethena has been one of the most heavily punished altcoins in the past few months, losing nearly 90% of its value since early September.

Yet something has shifted on the charts.

After weeks of bleeding, ENA has finally flashed a technical signal that could mark the start of a short-term reversal.

With momentum indicators flipping bullish and a key 84-day resistance trend line now breaking, traders are watching closely for a potential relief rally.

ENA Price Analysis

ENA has struggled mightily since Sept. 9, plunging by nearly 90% since its highs.

Despite the massive decline, bulls have a reason to be optimistic.

Get These Top Crypto Casino Offers Now!
Sponsored
Disclosure
Opened in 2023
Promotions
200% deposit bonus up to 20,000 USDT + up to 100 FS (promo code: CG100)
Coins
Tether Bitcoin Ethereum USD Coin TRON +7
Promotions
Casino No Wagering 100 Free Spins
Coins
Bitcoin Tether USD Coin Ethereum Solana +11
Opened in 2018
Promotions
500% Welcome Bonus up to $90,000 + 100 Free Spins
Coins
Bitcoin Ethereum Litecoin Tether Dogecoin +3
Show More

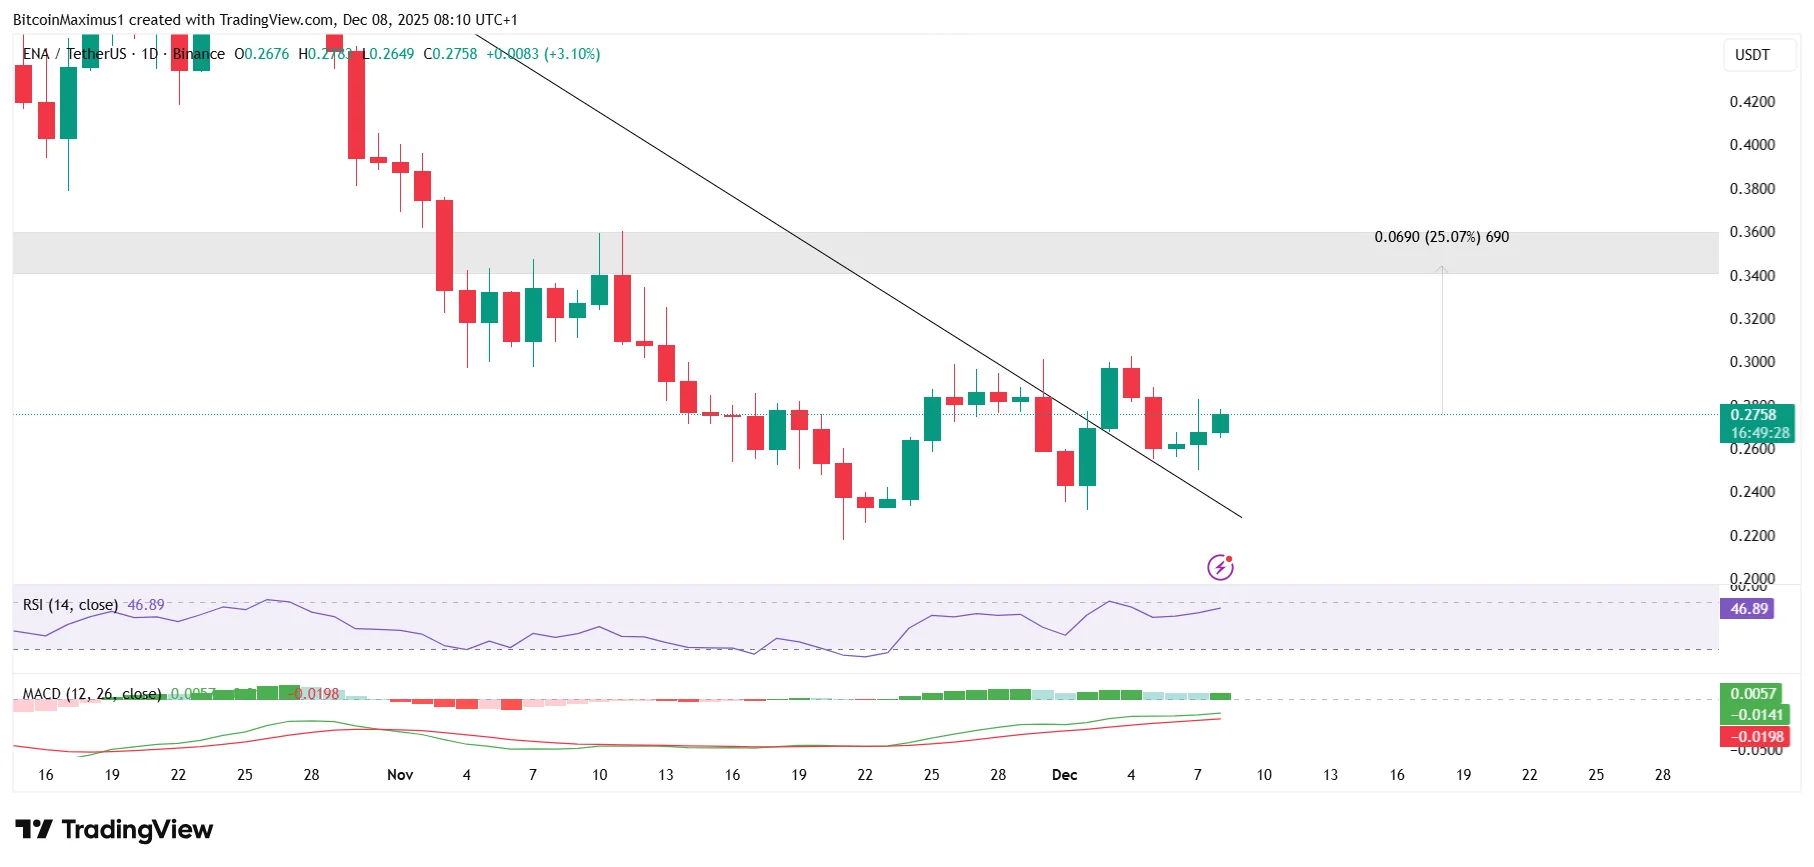
More specifically, the ENA price broke out from a diagonal resistance trend line that had existed for 84 days.

Today, Ethena is validating it as support (green icon), preparing to continue its breakout.

ENA Price Movement
ENA/USDT Daily Chart | Credit: Valdrin Tahiri/TradingView

The upside may be limited, since the $0.350 resistance area is only 25% above the current price.

Nevertheless, the ENA price could surge higher if the breakout transpires as expected.

Momentum Flips Bullish

Momentum indicators show just how close the ENA price is to confirming its bullish trend reversal.

  • The Relative Strength Index (RSI) is almost above 50.
  • The Moving Average Convergence/Divergence (MACD) is nearly positive.

Both are signs that bulls have taken over and legitimized the upward movement.

ENA Daily
ENA/USDT Daily Chart | Credit: Valdrin Tahiri/TradingView

If the ENA price rallies to the $0.350 horizontal resistance area, it will push these indicators into bullish territory.

So, not only will the price action be bullish, but momentum indicators will also cross into positive territory.

Long-Term Trend Remains Bearish

The daily outlook gives a bullish ENA price prediction.

However, the weekly chart paints a much gloomier picture.

The charts show that ENA has been creating lower highs since the start of the year.

Moreover, the bounces have all occurred at the $0.23 horizontal support area.

Combined, these create a descending triangle, which is considered a bearish pattern.

ENA Long-Term
ENA/USDT Weekly Chart | Credit: Valdrin Tahiri/TradingView

Additionally, the RSI and MACD are both bearish.

The RSI is below 50, and the MACD is negative, confirming that bears have taken over.

All these factors combined suggest that ENA’s long-term prediction is bearish.

Therefore, any bounces are treated as relief rallies.

A weekly close below $0.230 will confirm that the long-term trend is bearish.

ENA Price Bounce Incoming

The ENA price analysis shows a pivotal moment for the token.

The breakout from the 84-day resistance trend line gives bulls a real chance to reclaim short-term momentum.

A push toward R0.350 remains realistic if support holds and indicators continue improving.

However, the broader weekly structure still leans bearish, reminding traders that the larger downtrend is not yet broken.

Until ENA reclaims $0.350, bullish moves should be viewed as potential relief rallies rather than full trend reversals.

Disclaimer: The information provided in this article is for informational purposes only. It is not intended to be, nor should it be construed as, financial advice. We do not make any warranties regarding the completeness, reliability, or accuracy of this information. All investments involve risk, and past performance does not guarantee future results. We recommend consulting a financial advisor before making any investment decisions.
Valdrin Tahiri

Valdrin Tahiri is a cryptocurrency analyst and reporter at CCN, specializing in technical analysis with a focus on Elliott Wave theory, on-chain metrics, and fundamental research. He brings over seven years of experience in the crypto space as both a trader and writer.

He discovered cryptocurrencies in 2017 while earning his MSc in Financial Markets at the Barcelona School of Economics, which sparked a deep interest in blockchain and market dynamics. Since then, he’s contributed to top crypto outlets like BeInCrypto and CoinGape.

Valdrin also served as Community Manager of BeInCrypto’s Telegram group for three years, helping grow it into one of the largest crypto communities worldwide. His expertise in market structure and price patterns allows him to break down complex trends into clear, actionable insights.

He’s published thousands of articles covering altcoins, Bitcoin cycles, and macro trends.

Related

Survey Icon
Help us improve
1 of 4
Is this your first time here?
What brought you here today?
What are you most interested in?
Would you be interested in:
Thank you icon
Thank you for your feedback!
DMCA.com Protection Status