Why is ENA Leading the Crypto Market Recovery? | Credit: Derek Fenech
Share
Key Takeaways
Ethena’s USDe stablecoin has surged to a new all-time high.
The ENA price recovered, crossing above the $0.60 level.
Can ENA mount another rally toward its 2025 high?
Ethena’s USDe stablecoin is on a tear, hitting a new all-time high in supply and climbing to become the third-largest stablecoin in the market.
At the same time, ENA is starting to show signs of a recovery, backed by growing bullish momentum and a promising wave structure.
With that in mind, let’s take a closer look at the charts to see what August might have in store.
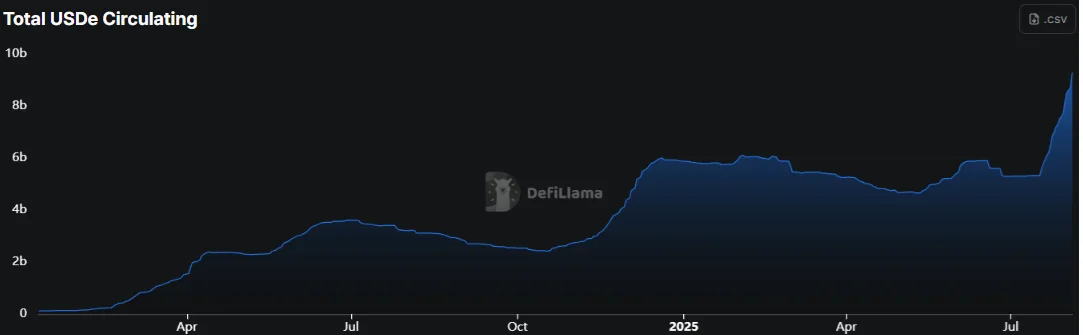
USDe Supply Increase
Ethena’s USDe stablecoin has seen a major boost, with supply jumping 75% over the past month to hit $9.5 billion, its highest level yet.
With this surge, USDe has overtaken FDUSD to become the third-largest stablecoin, now trailing only USDC and USDT.
Try Our Recommended Crypto Exchanges
Sponsored
Disclosure
We sometimes use affiliate links in our content, when clicking on those we might receive a commission at no extra cost to you. By using this website you agree to our terms and conditions and privacy policy.
This explosive growth is largely driven by a loop baked into USDe’s design.
As crypto prices rise, perpetual funding rates increase, and Ethena captures those higher rates to offer attractive yields.
In turn, those yields draw in more users, fueling further USDe issuance, a cycle that feeds itself.
We’ve seen this pattern before: big jumps in USDe supply happened during crypto rallies in May and December 2024, and the same trend is playing out again now.
Ethena’s TVL and revenue also spike during these periods, highlighting how tightly its performance is tied to market cycles and USDe demand.
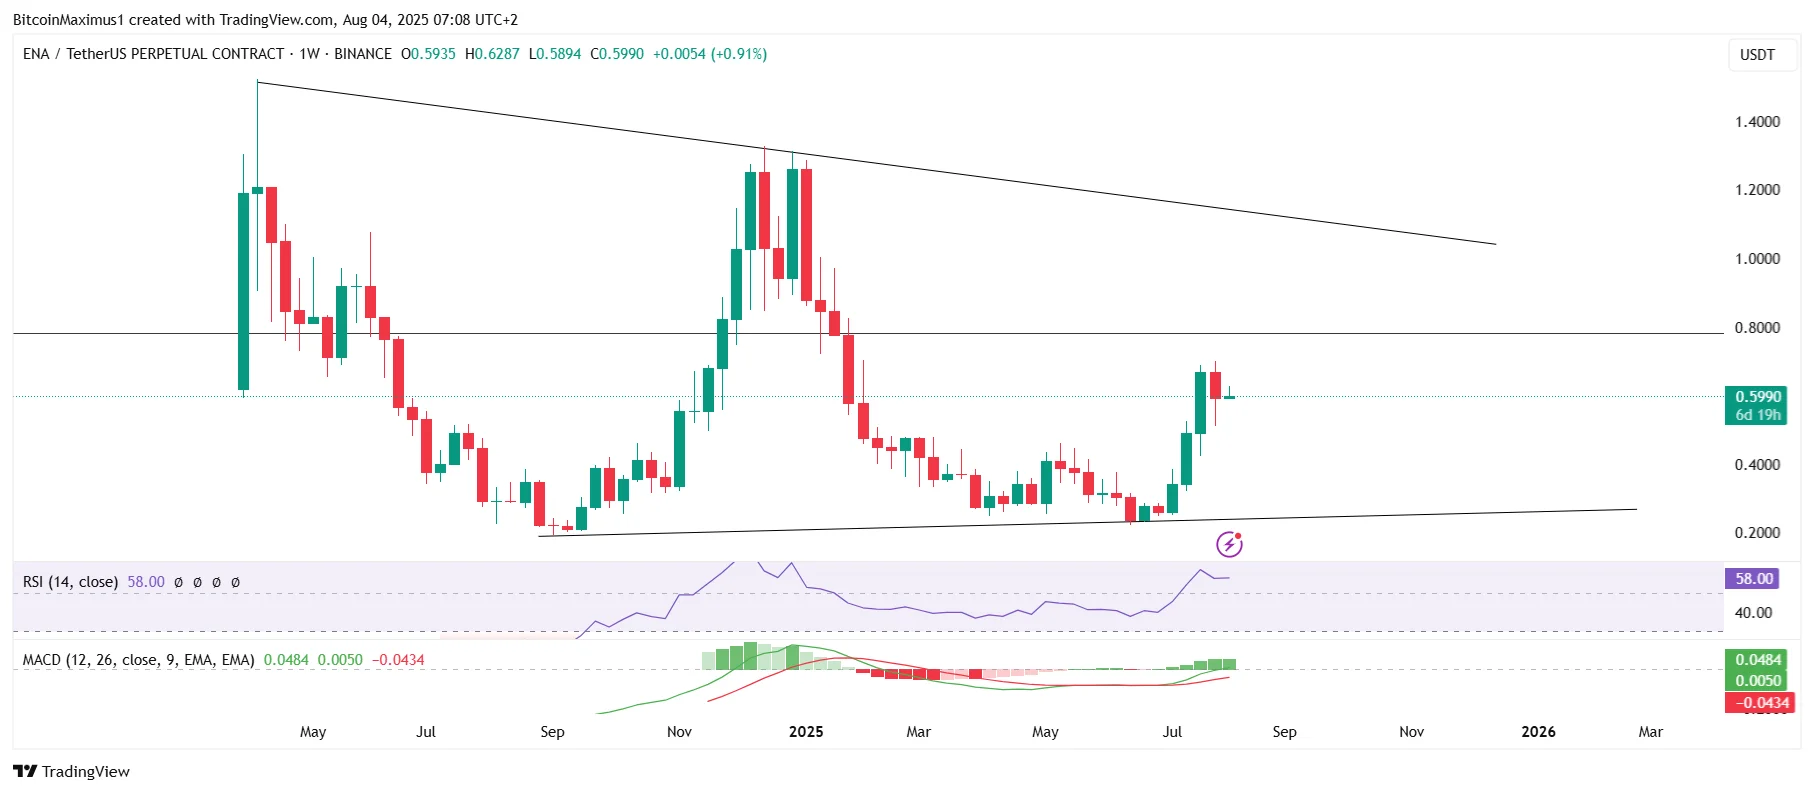
ENA Price Analysis
Since launching in April, ENA’s price has mostly trended downward, but things started to shift in September 2024, when it formed its first long-term higher low and entered into a symmetrical triangle pattern.
The pattern shows both lower highs and higher lows, signaling indecision in the market, making the next move hard to predict.
At the moment, ENA is trading just below the triangle’s midline, slightly leaning bearish.
Before last week, the token posted three strong bearish weekly candles, hinting that sellers were in control.
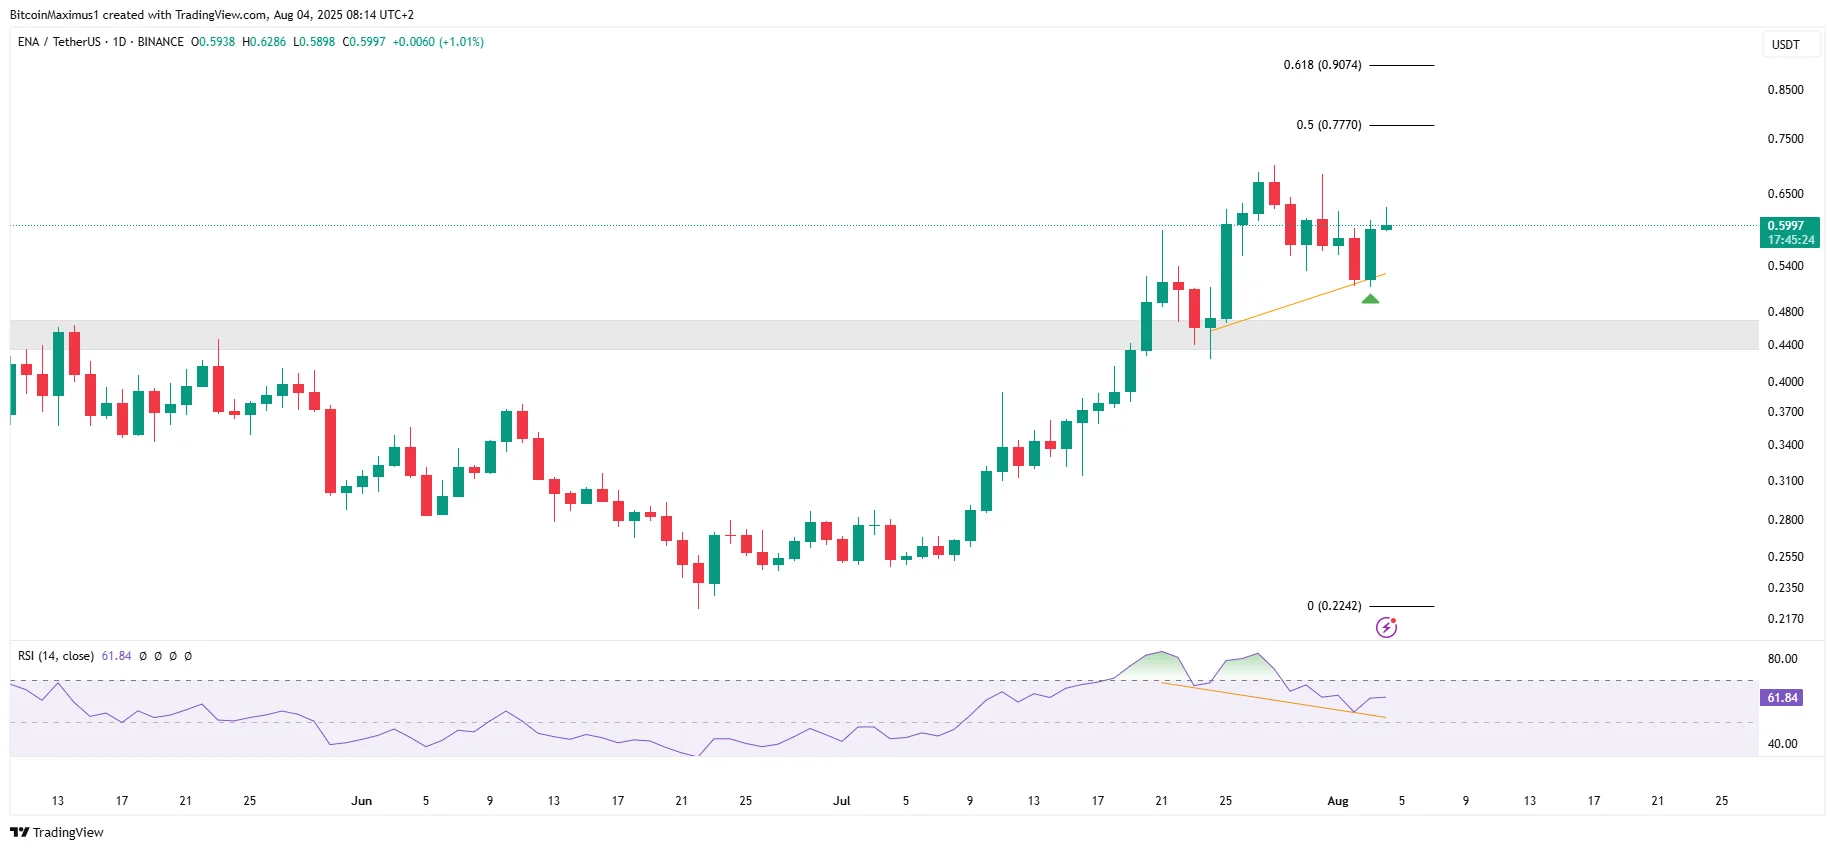
However, last week’s candle printed a long lower wick, a classic sign of buying pressure stepping in.
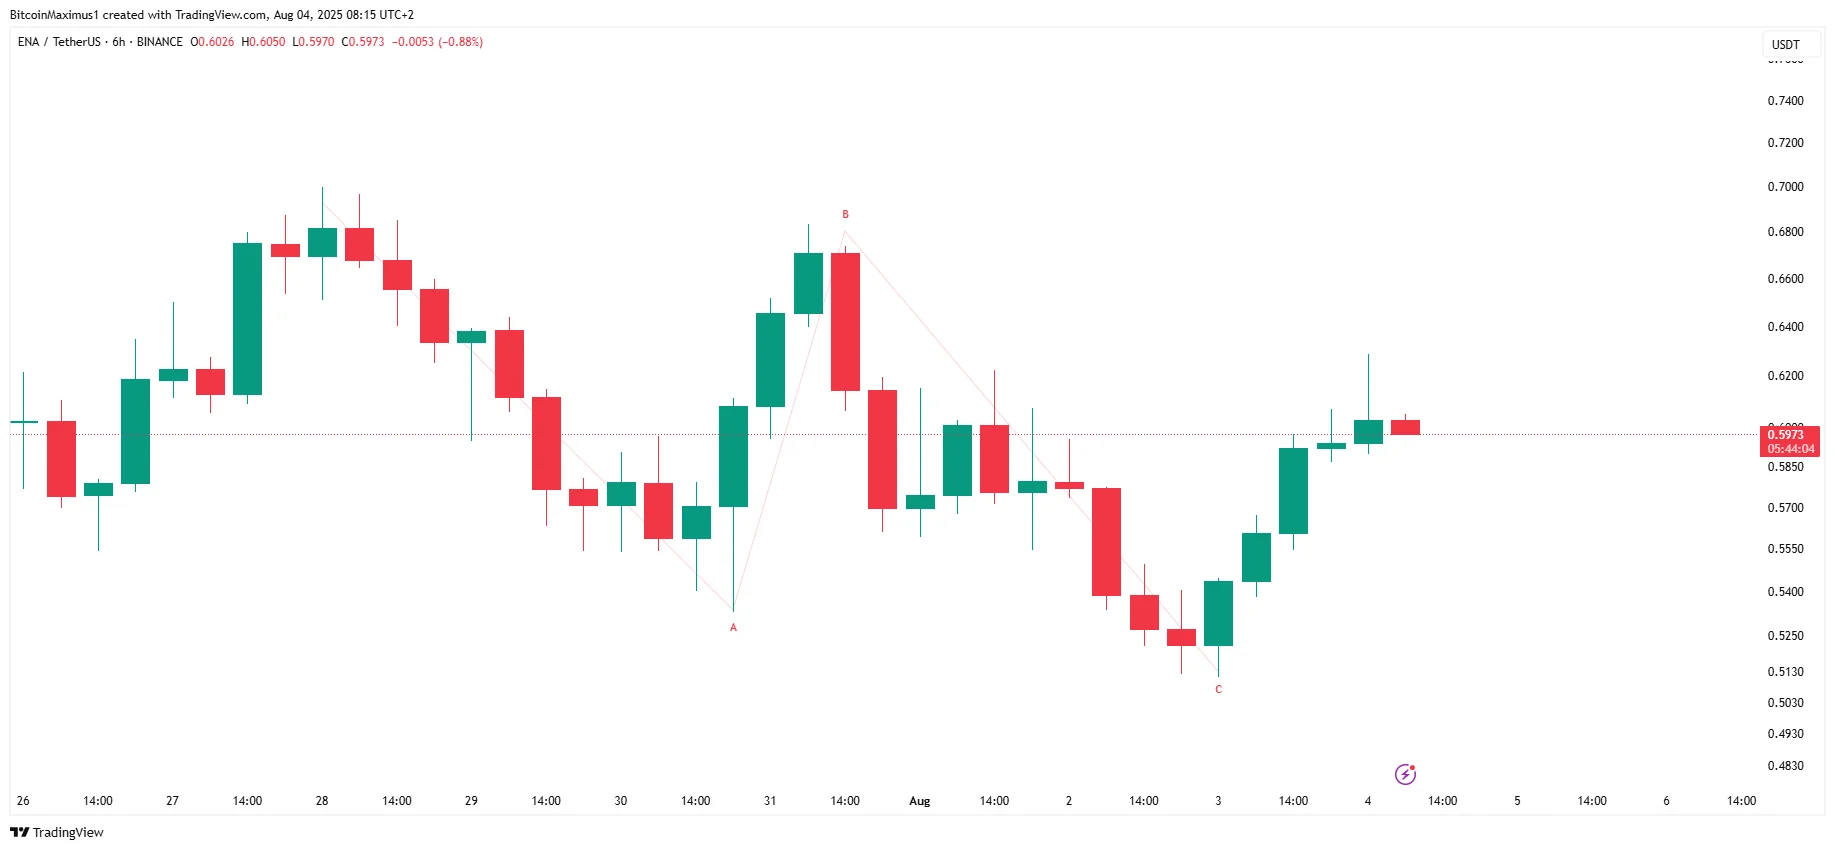
Combined with yesterday’s bullish engulfing candlestick (green icon), the ENA price today could be well on its way to confirming a bullish trend reversal.
The six-hour time frame further confirms this possibility, showing a completed A-B-C corrective structure (red).
Disclaimer:
The information provided in this article is for informational purposes only. It is not intended to be, nor should it be construed as, financial advice. We do not make any warranties regarding the completeness, reliability, or accuracy of this information. All investments involve risk, and past performance does not guarantee future results. We recommend consulting a financial advisor before making any investment decisions.
Valdrin Tahiri is a cryptocurrency analyst and reporter at CCN, specializing in technical analysis with a focus on Elliott Wave theory, on-chain metrics, and fundamental research. He brings over seven years of experience in the crypto space as both a trader and writer.
He discovered cryptocurrencies in 2017 while earning his MSc in Financial Markets at the Barcelona School of Economics, which sparked a deep interest in blockchain and market dynamics. Since then, he’s contributed to top crypto outlets like BeInCrypto and CoinGape.
Valdrin also served as Community Manager of BeInCrypto’s Telegram group for three years, helping grow it into one of the largest crypto communities worldwide. His expertise in market structure and price patterns allows him to break down complex trends into clear, actionable insights.
He’s published thousands of articles covering altcoins, Bitcoin cycles, and macro trends.