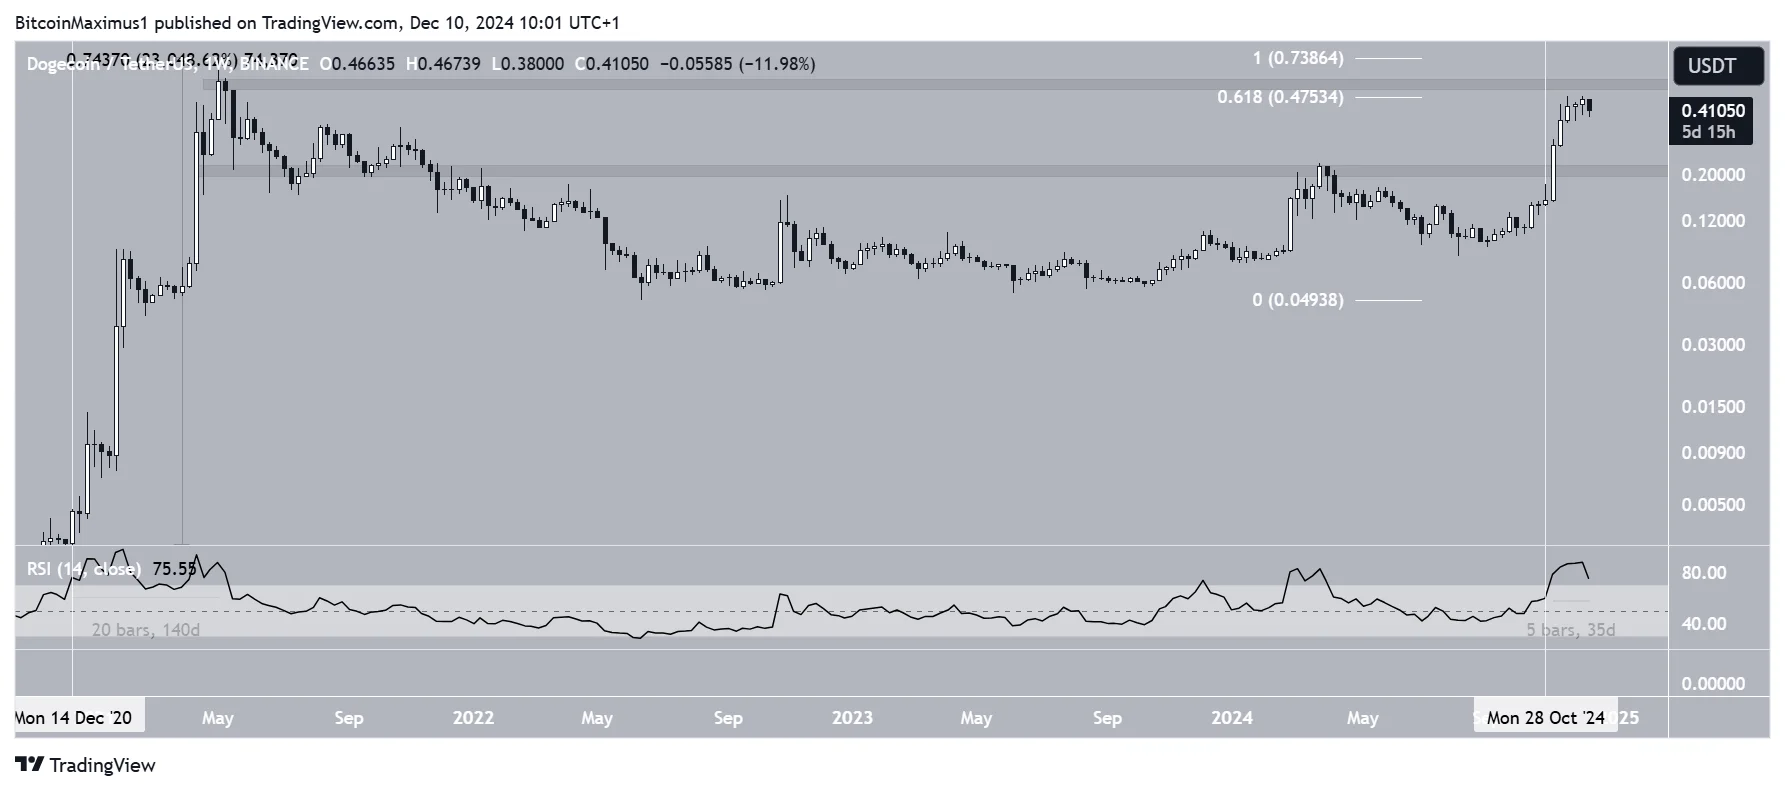
The weekly time frame chart shows that DOGE has increased parabolically since the beginning of November. The upward movement caused a breakout from the long-term horizontal resistance at $0.210, culminating with a yearly high of $0.484 in December.
This was roughly 40% below the all-time high price of $0.738, reached in May 2021.
DOGE has fallen slightly since, suffering rejection from the 0.618 Fibonacci retracement resistance level of $0.475. Above it, DOGE only faces resistance at $0.545 before it can reach a new all-time high price.
On the other hand, there is no support below the current price until the aforementioned $0.210 area.
Technical indicators are bullish, and the Relative Strength Index (RSI) gives an interesting signal. The indicator has crossed above 70, reaching overbought territory, staying there for 35 days.
The previous time the indicator crossed into this territory was in December 2020 (white), leading to a 23,000% increase. Then, the all-time high price was reached 140 days after the RSI moved above 70.
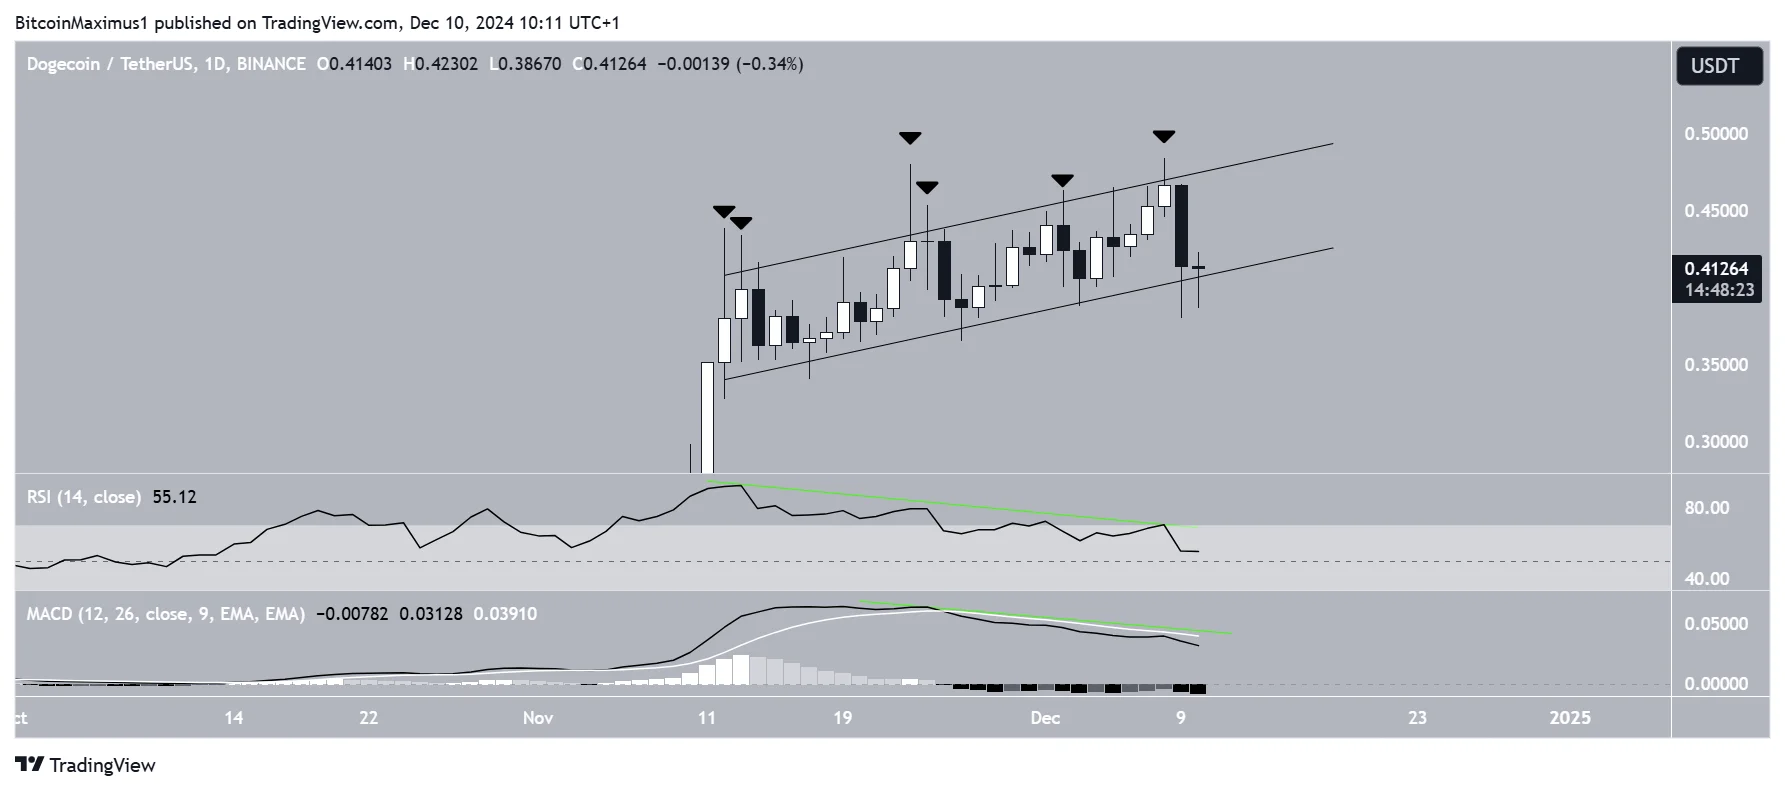
While the weekly chart is bullish, the daily one gives a bearish Dogecoin prediction. This is because the memecoin trades at the support trend line of an ascending parallel channel that has contained the movement since Nov. 12. Such channels usually contain corrective movements, meaning that a breakdown is more likely.
Additionally, the channel’s resistance has thwarted all previous breakout attempts, creating long upper wicks (black icons) and signs of selling pressure.
Furthermore, the daily RSI and MACD have both generated bearish divergences (green), a bearish signal that often precedes downward movements.
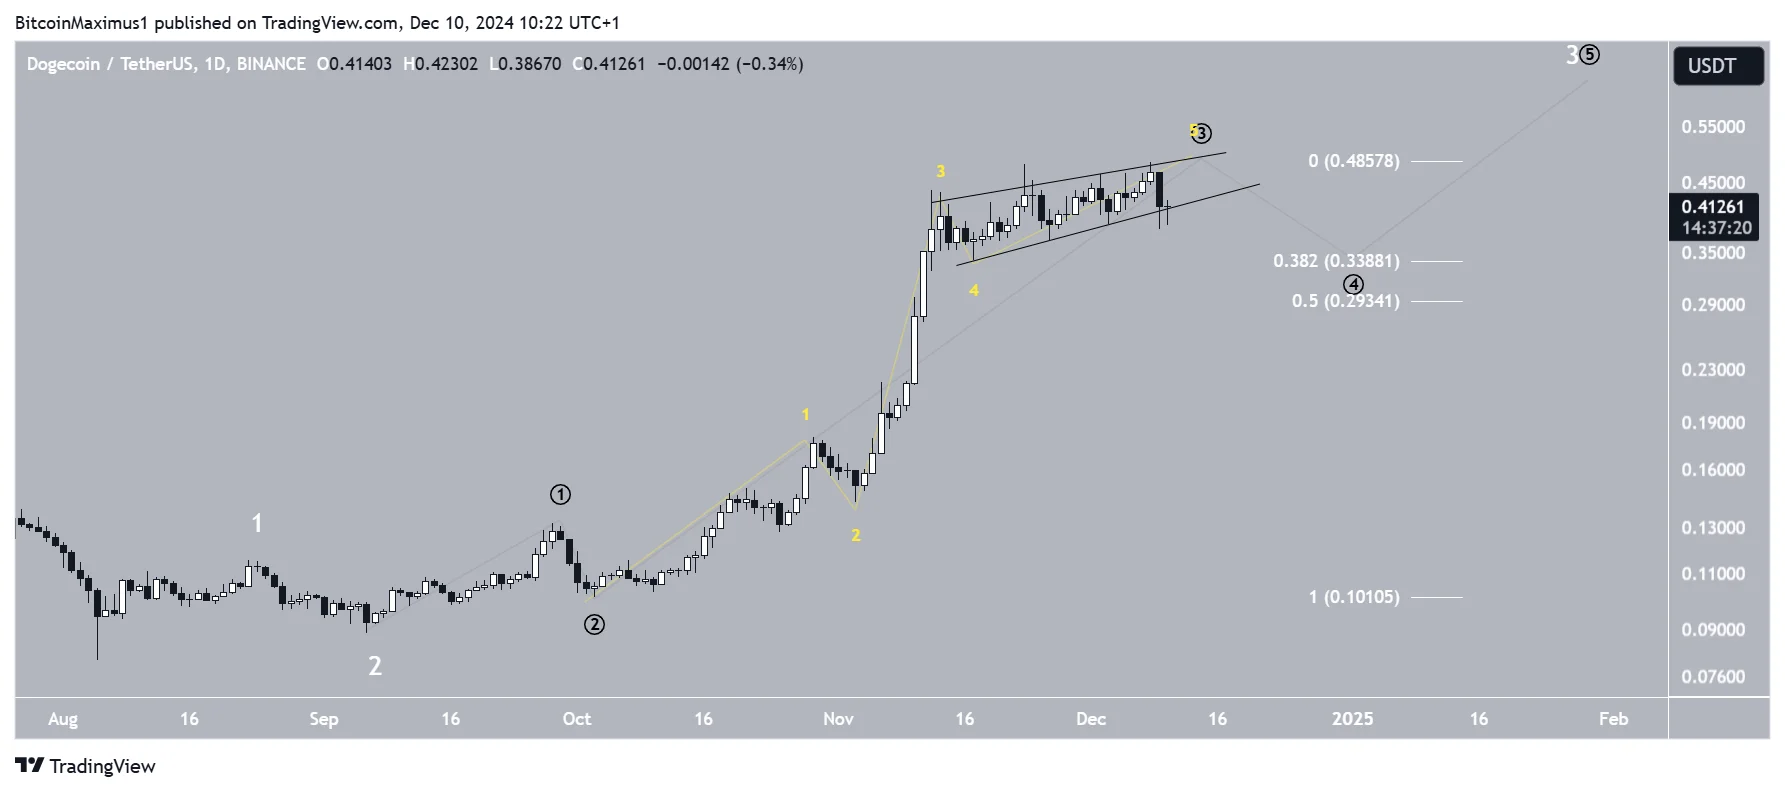
The wave count aligns with this bearish short-term outlook. It shows a 1-2/1-2/1-2 wave formation, an extremely bullish structure that led to the parabolic upward movement. The wave, sub-wave, and minor sub-wave counts are in white, black, and yellow, respectively.
The most likely count suggests that sub-wave three has ended, and DOGE is now correcting inside sub-wave four. The minor sub-wave count shows a completed ending diagonal, aligning with the possibility.
As a result, the daily time frame suggests the Dogecoin price will correct toward the 0.382-0.5 Fibonacci retracement support area of $0.234-$0.338 before resuming its long-term upward movement.
Dogecoin Price Correction
After an impressive rally in November, the DOGE price may be nearing a local top. Dogecoin risks a breakdown from its ascending parallel channel, which could trigger a decline of at least 20%.
A close below the channel’s support trend line at $0.410 will confirm this bearish short-term outlook.
Disclaimer:
The information provided in this article is for informational purposes only. It is not intended to be, nor should it be construed as, financial advice. We do not make any warranties regarding the completeness, reliability, or accuracy of this information. All investments involve risk, and past performance does not guarantee future results. We recommend consulting a financial advisor before making any investment decisions.
Valdrin Tahiri is a cryptocurrency analyst and reporter at CCN, specializing in technical analysis with a focus on Elliott Wave theory, on-chain metrics, and fundamental research. He brings over seven years of experience in the crypto space as both a trader and writer.
He discovered cryptocurrencies in 2017 while earning his MSc in Financial Markets at the Barcelona School of Economics, which sparked a deep interest in blockchain and market dynamics. Since then, he’s contributed to top crypto outlets like BeInCrypto and CoinGape.
Valdrin also served as Community Manager of BeInCrypto’s Telegram group for three years, helping grow it into one of the largest crypto communities worldwide. His expertise in market structure and price patterns allows him to break down complex trends into clear, actionable insights.
He’s published thousands of articles covering altcoins, Bitcoin cycles, and macro trends.