On March 28, the price of DOGE reached its yearly peak of $0.22, completing a five-wave formation that started in October 2023.
Following this high, DOGE entered a corrective phase, forming a descending triangle and retracing to $0.090, finding key horizontal support. After bouncing off this level, DOGE encountered descending resistance on Sept. 14, leading to a temporary pullback.
The overall sentiment remained optimistic, as DOGE formed a higher low during the retracement. A new upward movement began on Sept. 16, breaking past descending resistance and reaching $0.13 by Sept. 28.
However, this rally was short-lived, as a swift 24% drop erased prior gains, casting doubts on the bullish outlook.
DOGEUSD recovery seen | Credit: Nikola Lazic/TradingView
The correction appeared to follow an ABCDE structure, with the upward movement from Sept. 6 marking the start of a five-wave impulse. After finding support at horizontal resistance, DOGE made another upward push, hitting a high of $0.15—an increase of 40% from the start of the month. The daily RSI indicates DOGE got overbought on Oct. 21, and a downturn was expected from its $0.15 high.
It fell by 14%, but since Oct. 26, it has significantly recovered and remains in an uptrend. Despite the recovery, DOGE could still be in a corrective stage with more downside.
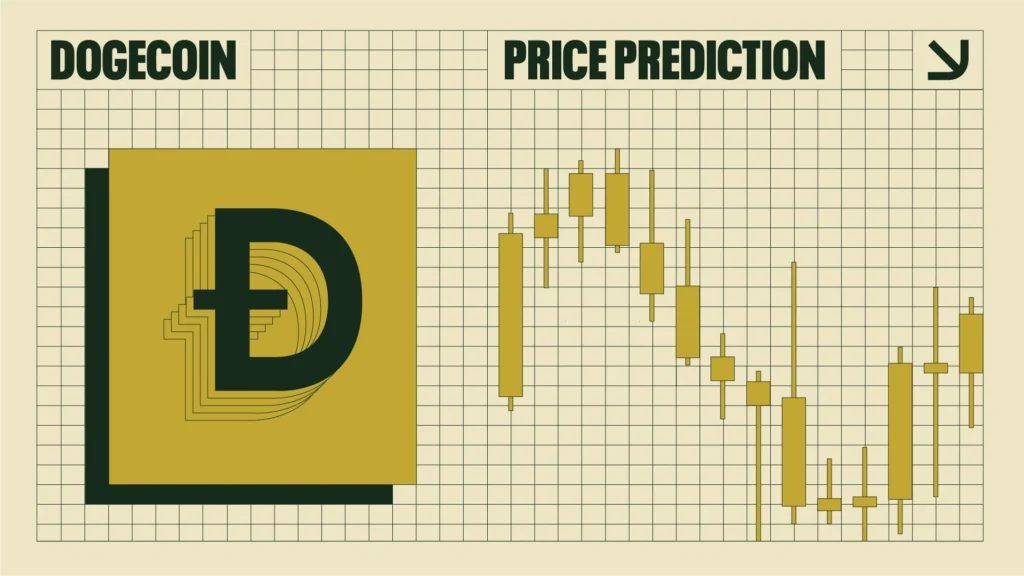
DOGE Price Prediction
The hourly chart shows DOGE appears in an ascending channel, with resistance tested for the third time on Oct. 21.
Although the five-wave impulse count has some inconsistencies, this ascending channel could represent the first sub-wave of a potential bullish phase.
A downward correction was anticipated as the price reached a higher high at significant resistance, and the daily chart shows an overbought RSI. This downward movement could correct to the 0.5 Fibonacci level at $0.11.
DOGEUSD still on a lower high | Credit: Nikola Lazic/TradingView
Alternatively, if the ascending channel’s structure proves corrective, this could signal a continuation of the downtrend, possibly bringing DOGE to new lows below August levels.
In the third scenario, we could see only a minor pullback before further upward movement.
The momentum and depth of the expected downturn will clarify the most likely path forward.
Ideally, a strong upside move followed by a retest of the support level would present an optimal setup for DOGE.
Disclaimer:
The information provided in this article is for informational purposes only. It is not intended to be, nor should it be construed as, financial advice. We do not make any warranties regarding the completeness, reliability, or accuracy of this information. All investments involve risk, and past performance does not guarantee future results. We recommend consulting a financial advisor before making any investment decisions.
Nikola Lazic is a cryptocurrency analyst and investor working in the industry since 2017. He holds a bachelor's degree in Sociology, which enables him to better understand the psychology behind the crowd´s positioning. Consequently his preferred analytical tool is Elliott Wave Theory in combination with price action analysis.
Combining his experience in trading and investing with knowledge in content writing he strives to bring the most accurate and actionable information.