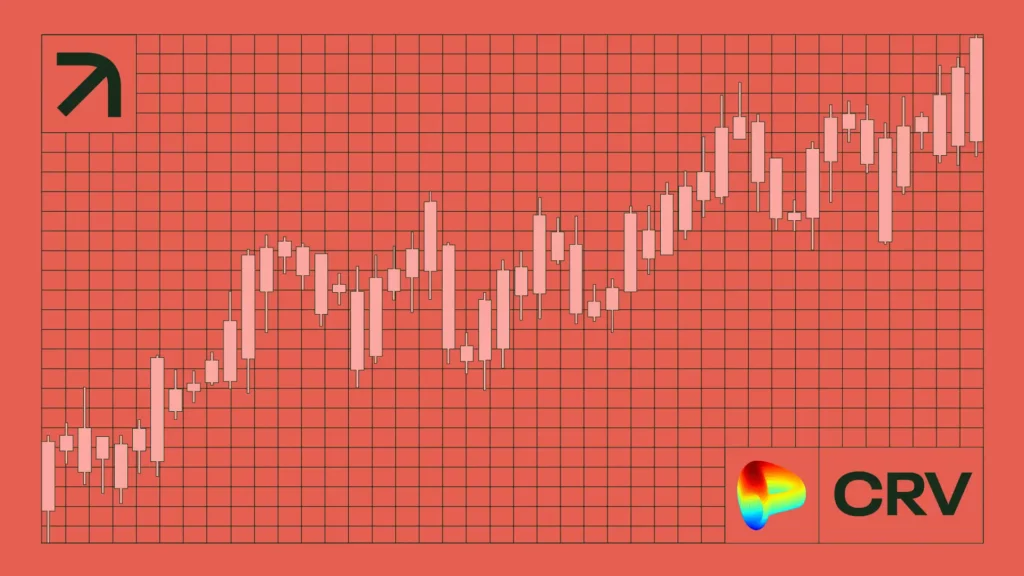
CRV has mounted an impressive rally since March 11, pacing the crypto market in the past 24 hours.
The price broke out from a short-term bullish pattern and aims to break out from a long-term descending resistance trend line.
The trend line has existed for 110 days, so a breakout above it could accelerate the upward movement even further. Let’s look at the charts and see if this will happen.
The downward movement culminated with a low of $0.346, a decrease of 73% since the high. CRV has rebounded since and mounted a rally.
After a 70% increase, the CRV price reached the resistance trend line with a high of $0.59. If the price breaks out, the next resistance will be at $0.80.
Technical indicators are decisively bullish, suggesting that CRV will break out.
The Relative Strength Index (RSI) and Moving Average Convergence/Divergence (MACD) generated bullish divergences before the upward movement.
The RSI is above 50 while the MACD is above 0, both signs of a positive trend. As a result, CRV’s daily time frame suggests a breakout is likely.
CRV Correction is Over
The Curve DAO wave count supports the bullish price action and indicator readings from the daily time frame, showing a completed A-B-C correction (red) since the cycle high.
The sub-wave count is in black, showing a finished five-wave decline, with wave five an ending diagonal, a fitting end for such a structure.
If the count is accurate, CRV has started a significant relief rally that could take it to the 0.5-0.618 Fibonacci retracement resistance at $0.80-$0.95, aligning with the horizontal resistance.
While it is still unclear if the ongoing increase is a new five-wave movement or another corrective rally, both predict a significant CRV price increase.
Since the cycle high, the trend line has existed, so a breakout above it will confirm that the correction is over.
Curve DAO’s price action, indicator readings, and wave count are all bullish, suggesting the price will break out.
Disclaimer:
The information provided in this article is for informational purposes only. It is not intended to be, nor should it be construed as, financial advice. We do not make any warranties regarding the completeness, reliability, or accuracy of this information. All investments involve risk, and past performance does not guarantee future results. We recommend consulting a financial advisor before making any investment decisions.
Valdrin Tahiri is a cryptocurrency analyst and reporter at CCN, specializing in technical analysis with a focus on Elliott Wave theory, on-chain metrics, and fundamental research. He brings over seven years of experience in the crypto space as both a trader and writer.
He discovered cryptocurrencies in 2017 while earning his MSc in Financial Markets at the Barcelona School of Economics, which sparked a deep interest in blockchain and market dynamics. Since then, he’s contributed to top crypto outlets like BeInCrypto and CoinGape.
Valdrin also served as Community Manager of BeInCrypto’s Telegram group for three years, helping grow it into one of the largest crypto communities worldwide. His expertise in market structure and price patterns allows him to break down complex trends into clear, actionable insights.
He’s published thousands of articles covering altcoins, Bitcoin cycles, and macro trends.