Why is copper rising amid the crypto market drop? | Credit: Hameem Sarwar
Share
Key Takeaways
Chip dominance is driving copper demand, as semiconductors now account for a record share of the tech sector.
AI and data centers are major catalysts, as AI infrastructure could consume over 500,000 tons of copper annually.
Tokenization may boost liquidity, not prices; however, the technical setup suggests copper’s price could hit a new high.
While crypto markets have been sliding, copper has started to recover after a seven-day downtrend.
At the time of writing, the metal has climbed back above $6.
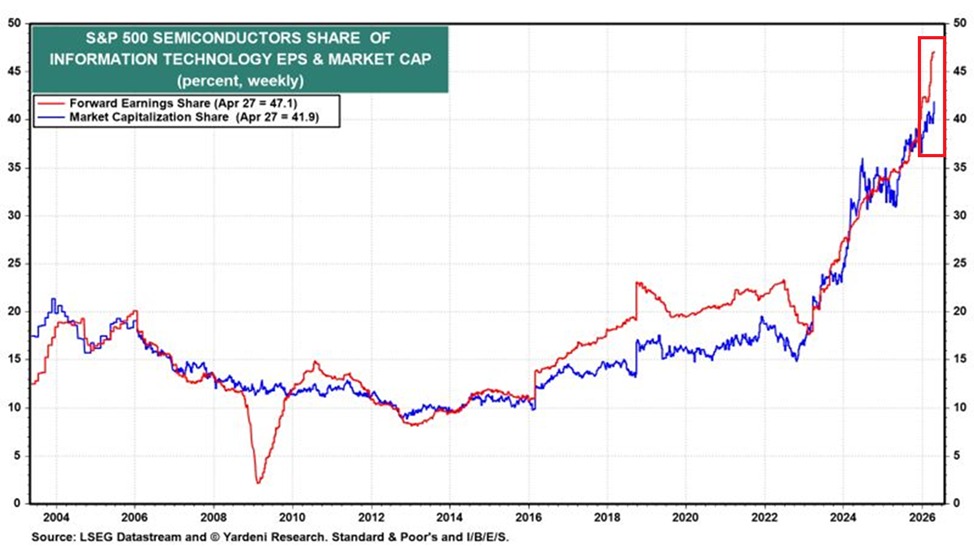
The move comes as the S&P 500 semiconductor industry now accounts for a record 41.9% of the information technology sector’s total market cap.
In this analysis, CCN breaks down what this shift could mean for copper—and the key factors that may shape its price this year.
Why Is Copper Demand Rising?
Copper’s recent strength ties closely to the rapid expansion of the semiconductor sector.
Since the 2022 bear market, semiconductor stocks have more than doubled, taking up a much larger share of the tech landscape.
Back in 2013, they made up less than 10% of the IT sector.
Today, that figure has surged, with semiconductors accounting for a record 47.1% of the sector’s forward earnings—nearly tripling their share since 2023.
Get These Top Crypto Casino Offers Now!
Sponsored
Disclosure
We sometimes use affiliate links in our content, when clicking on those we might receive a commission at no extra cost to you. By using this website you agree to our terms and conditions and privacy policy.
As capital flows into chips and infrastructure, demand for raw materials like copper rises alongside it.
At the same time, this concentration shifts risk dynamics, often pulling liquidity away from more speculative assets.
Semi-Conductor Share of the IT Industry | Credit:
China’s import data reinforces this trend.
The share of EQ-grade copper cathode imports has steadily increased through Q1 2026, rising from 68.12% in January to 70.78% in February, and reaching 73.53% in March.
March is typically a seasonal peak, but this year’s figure surpassed both 2024 and 2025 levels, highlighting stronger underlying demand.
Amid an inverted SHFE/LME price ratio and tighter import conditions, EQ sources have become the dominant driver of China’s cathode supply—further supporting copper’s recovery narrative.
The Link Between Copper and Semiconductors: Explained
For those unfamiliar, the physical link between copper and semiconductors is direct. Inside a chip, copper is the nervous system.
As of 2026, copper is the industry standard for interconnects — the microscopic wires that join millions of transistors.
Besides that, copper offers superior conductivity and thermal management, with 2nm and 3nm nodes.
Those centers consume huge amounts of copper for power distribution and high‑speed connectivity.
A single AI facility can require miles of copper cabling. Analysts estimate AI data centers could consume over 500,000 tons of copper annually by 2030.
In April 2026, a surge in AI orders for high‑speed copper cables pushed several Far‑East cable stocks to daily price limits.
That demand has supported copper’s rebound, with more signs that the price rally could retest $7 soon.
Economically, copper and chips move together. However, this tight link also creates risk.
For instance, high copper prices spur R&D into substitutes.
For sub‑2nm nodes, research into ruthenium, cobalt, and graphene has accelerated to combat the resistivity size effect, where copper becomes less efficient at microscopic scales.
In power semiconductors for EVs, pressure‑assisted copper sintering now challenges silver‑based materials.
Tokenization Comes Into the Picture
In the crypto context, the tokenization of copper also appears to be driving demand.
At the time of writing, copper tokenization has moved beyond experimentation and into a multi-billion-dollar institutional asset class.
The overall tokenized RWA market has grown to approximately $19–30 billion in 2026, with commodities representing a growing segment (around $7 billion, predominantly driven by precious metals so far).
This enables improved price discovery, reduced counterparty risk via verifiable on-chain collateral, and easier participation for both retail and institutional investors.
The timing is particularly relevant amid growing structural supply deficits in physical copper — analysts project shortfalls ranging from 150,000 to 330,000 metric tons in 2026, driven by surging demand from data centers, electric vehicles, and renewable energy infrastructure.
Tokenization is helping channel capital more efficiently into the sector, potentially supporting market liquidity and long-term investment flows.
As custody solutions, pricing oracles, and regulatory frameworks continue to mature, tokenized copper is well-positioned to become a meaningful component of diversified portfolios — following a path similar to that of tokenized precious metals, which gained mainstream traction.
Copper Price Prediction 2026
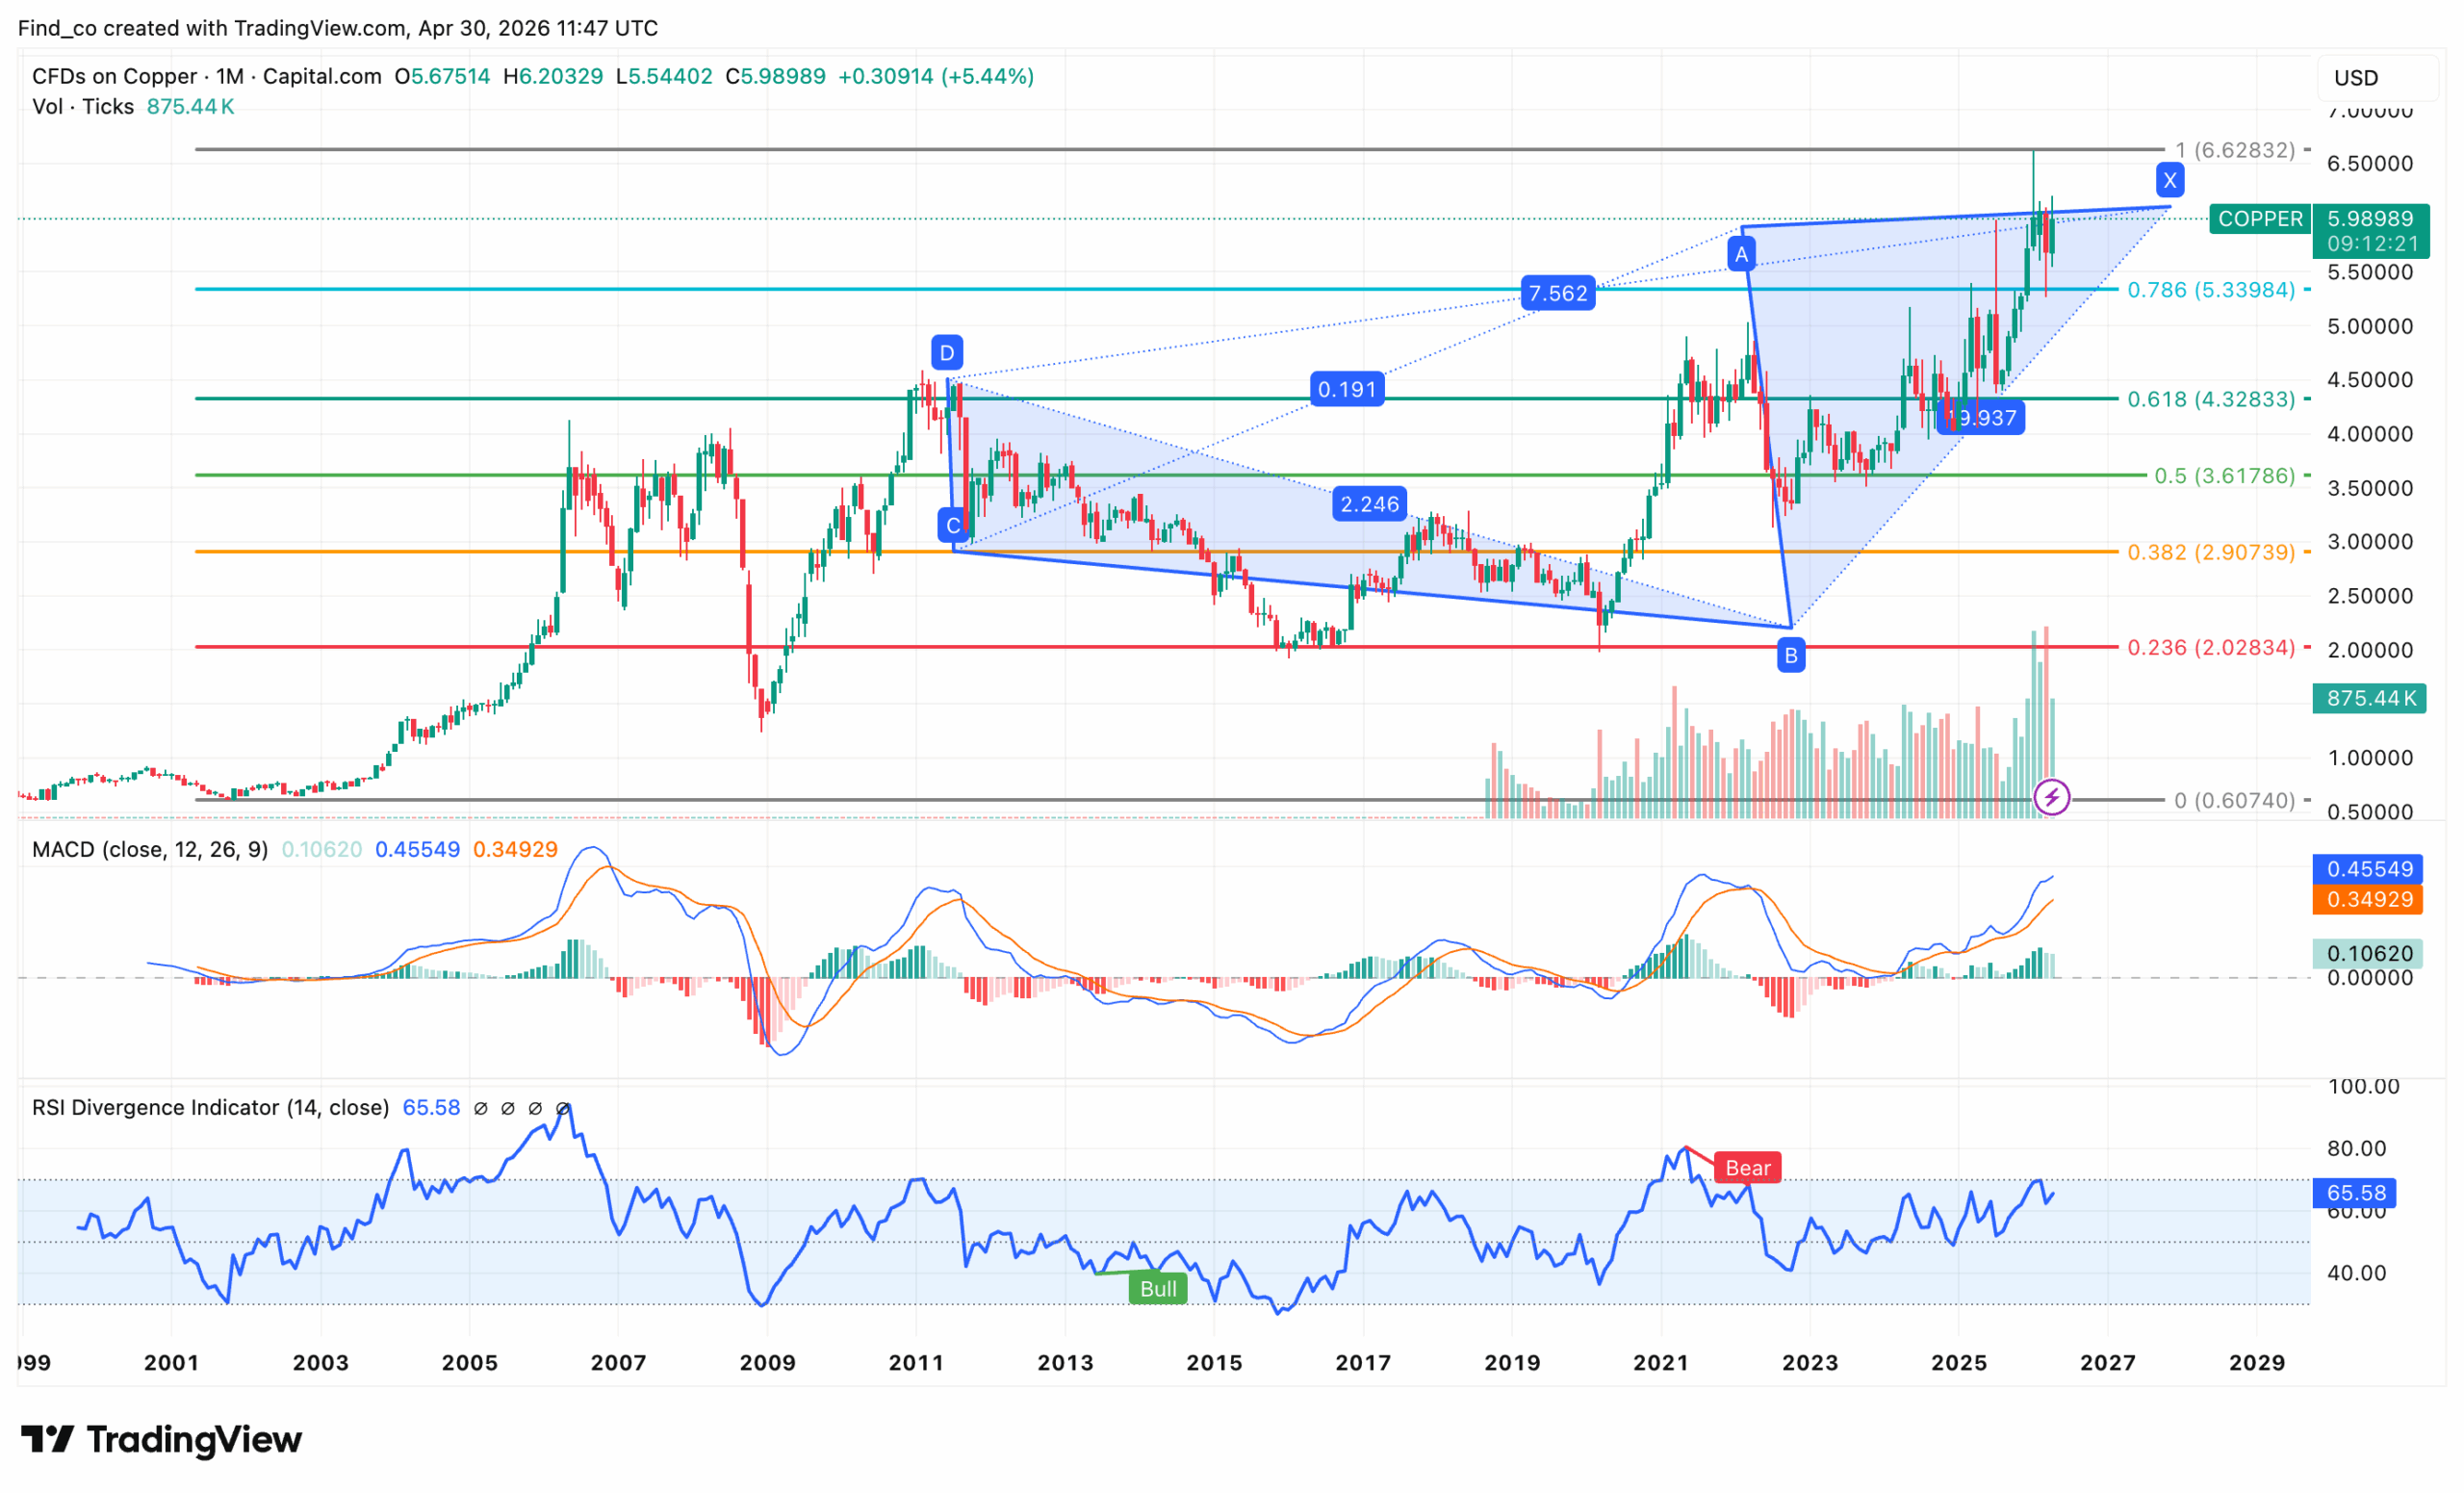
From a technical point of view, Copper is poised for a major breakout after completing a large corrective structure.
As shown below, the monthly chart shows a completed ABCD-type correction, with price bouncing strongly from the B leg near $2 and now driving into the upper boundary of the structure around $6.20.
Furthermore, this closely aligns with the 0.786 fib ($5.33) and prior macro resistance.
Momentum is clearly supportive. MACD is expanding, with both lines trending higher, and RSI is holding above 60, which is strong but not yet at extreme levels.
That suggests buyers are still in control, but the market is approaching a level where reactions are likely.
If copper can hold above $5.8 and consolidate, the structure supports continuation toward the $6.65 region, which is effectively the macro resistance/top of the range.
Disclaimer:
The information provided in this article is for informational purposes only. It is not intended to be, nor should it be construed as, financial advice. We do not make any warranties regarding the completeness, reliability, or accuracy of this information. All investments involve risk, and past performance does not guarantee future results. We recommend consulting a financial advisor before making any investment decisions.
Victor Olanrewaju is a crypto analyst and reporter at CCN with deep roots in on-chain research and technical analysis. His crypto journey began in 2017, but it was the 2020 Uniswap airdrop that sparked a full-time pivot into the space.
With a foundation in copywriting, Victor honed his craft creating high-converting content for leading crypto brokers — most notably an XRP price prediction that ranked #1 on Google during the 2021 bull run.
He later joined AMBCrypto in 2022, where he combined storytelling with technical and on-chain analysis to cover key market narratives.
In 2024, he expanded his expertise at BeInCrypto, collaborating with analysts and using tools like Glassnode, Santiment, and IntoTheBlock to break down Bitcoin and altcoin trends.
At CCN, Victor covers the top cryptocurrencies, memecoins, macro shifts, blending real-time insights with deep-dive metrics.
He holds a Bachelor’s degree in Physics from the University of Ibadan, equipping him to simplify complex data for a wide audience. Follow his work or connect on LinkedIn or X.