BONK price gets rejected at the major descending channel resistance from the all-time high. Will local horizontal support hold?
Share
Key Takeaways
BONK is currently in a corrective phase, consolidating within a descending wedge pattern.
Breaking the key support could signal further downside.
RSI is neutral, indicating no strong overbought or oversold conditions.
Bonk (BONK) is currently navigating a corrective phase following its recent rally.
The price is testing a key support level near the 0.618 Fibonacci retracement.
The market structure indicates a potential breakout, but failing to hold support could lead to a deeper correction, potentially targeting lower Fibonacci levels.
BONK Price Analysis
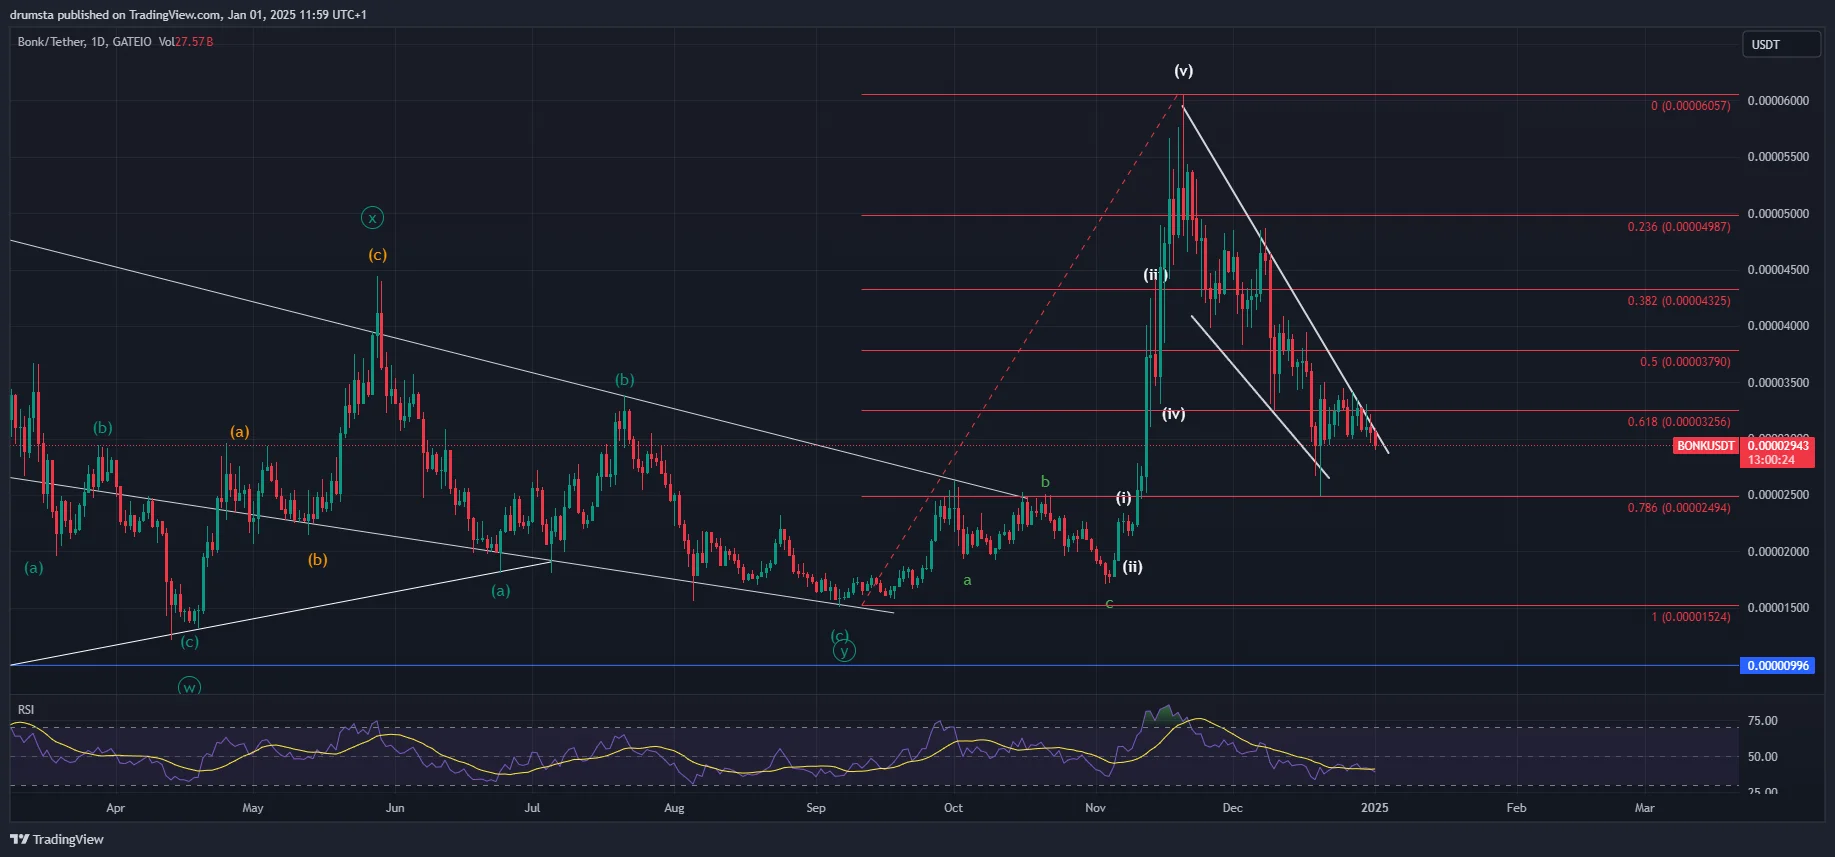
The daily chart of BONK reveals an impulse move that peaked at $0.60 on Nov. 20, followed by a corrective phase marked by a descending channel.
The price has recently tested support around $0.000025, corresponding with the 0.786 Fibonacci retracement level, and is now consolidating above this zone.
BONKUSD still in a descending channel | Credit: Nikola Lazic/TradingView
The market currently reflects a series of lower highs and higher lows, characteristic of a descending triangle pattern.
If BONK fails to maintain support at $0.000029, the price could move lower, potentially testing the 0.000025 Fibonacci retracement level again.
On the other hand, if the price manages to break through the resistance at $0.00004987 (the 0.236 Fibonacci level), it could signal the end of the corrective phase, potentially leading to a bullish recovery.
The Relative Strength Index (RSI) remains neutral, suggesting a balanced market with no clear indication of an overbought or oversold condition. Monitoring the RSI in the coming days will be crucial to gauge momentum, especially as the price tests these critical levels.
BONK Price Prediction
Turning to the hourly chart, we see the price is testing the lower boundary of the descending wedge near the 0.618 Fibonacci retracement at $0.00003256.
This support level is key to the current price action, and a breakdown from this point could lead to further downside, targeting $0.00002494 (0.786 Fibonacci level).
BONKUSD two outcomes in play | Credit: Nikola Lazic/TradingView
The wave count suggests that BONK might be nearing the end of the corrective wave (v), with a possible breakout to the upside.
If the price breaks above the descending wedge resistance, it could initiate a price recovery.
Initial resistance lies at $0.00003790 (0.5 Fibonacci retracement), with additional resistance levels at $0.00004325 (0.382 Fibonacci retracement) and $0.00004987 (0.236 Fibonacci retracement), aligning with previous corrective wave highs.
The RSI, which is currently showing range-bound movement, indicates that momentum is subdued.
However, should the price approach key support levels, a reversal may be in play. A breakout, particularly above the $0.00003790 level, would be a strong bullish signal if accompanied by increasing volume.
Key Levels to Watch
Support: $0.00003256 (0.618 Fibonacci retracement) and $0.00002494 (0.786 Fibonacci retracement).
Disclaimer:
The information provided in this article is for informational purposes only. It is not intended to be, nor should it be construed as, financial advice. We do not make any warranties regarding the completeness, reliability, or accuracy of this information. All investments involve risk, and past performance does not guarantee future results. We recommend consulting a financial advisor before making any investment decisions.
Nikola Lazic is a cryptocurrency analyst and investor working in the industry since 2017. He holds a bachelor's degree in Sociology, which enables him to better understand the psychology behind the crowd´s positioning. Consequently his preferred analytical tool is Elliott Wave Theory in combination with price action analysis.
Combining his experience in trading and investing with knowledge in content writing he strives to bring the most accurate and actionable information.