Why BNB Matters: 5 Drivers of Value That Go Beyond the Price Chart.
Share
Key Takeaways
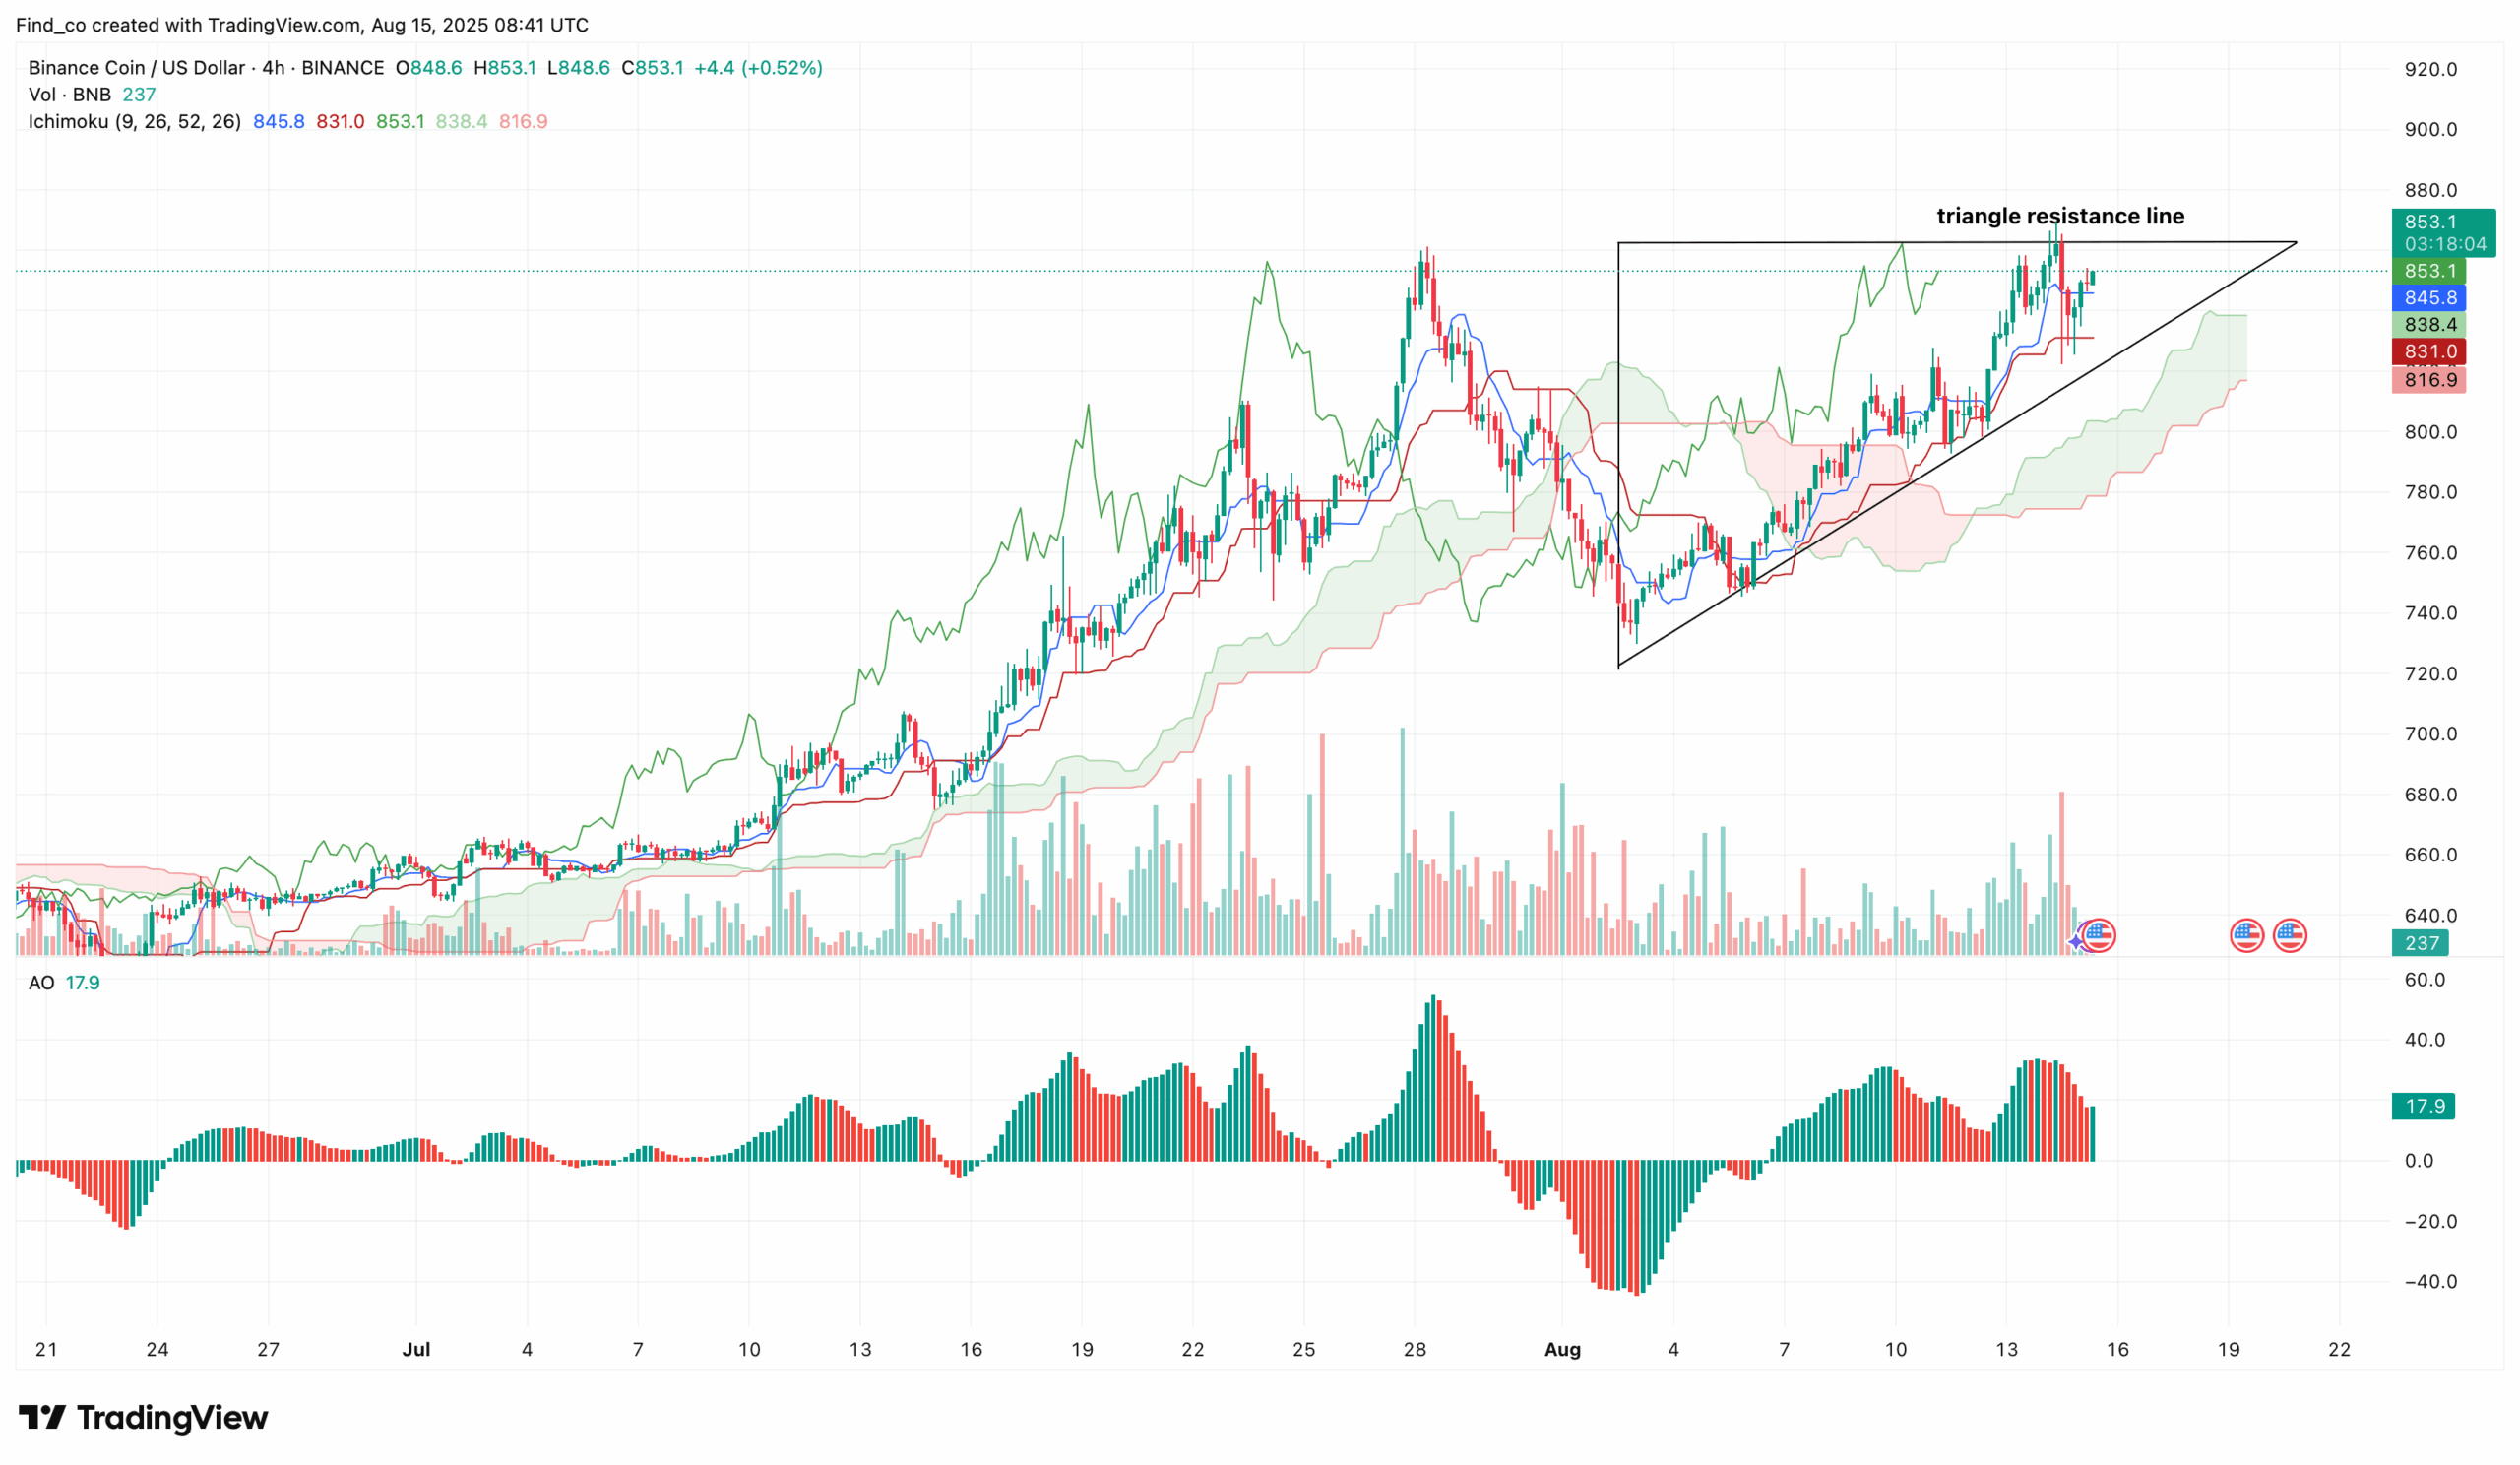
BNB has eased slightly from its record high of $868.68 to $851.97 but remains within an ascending triangle.
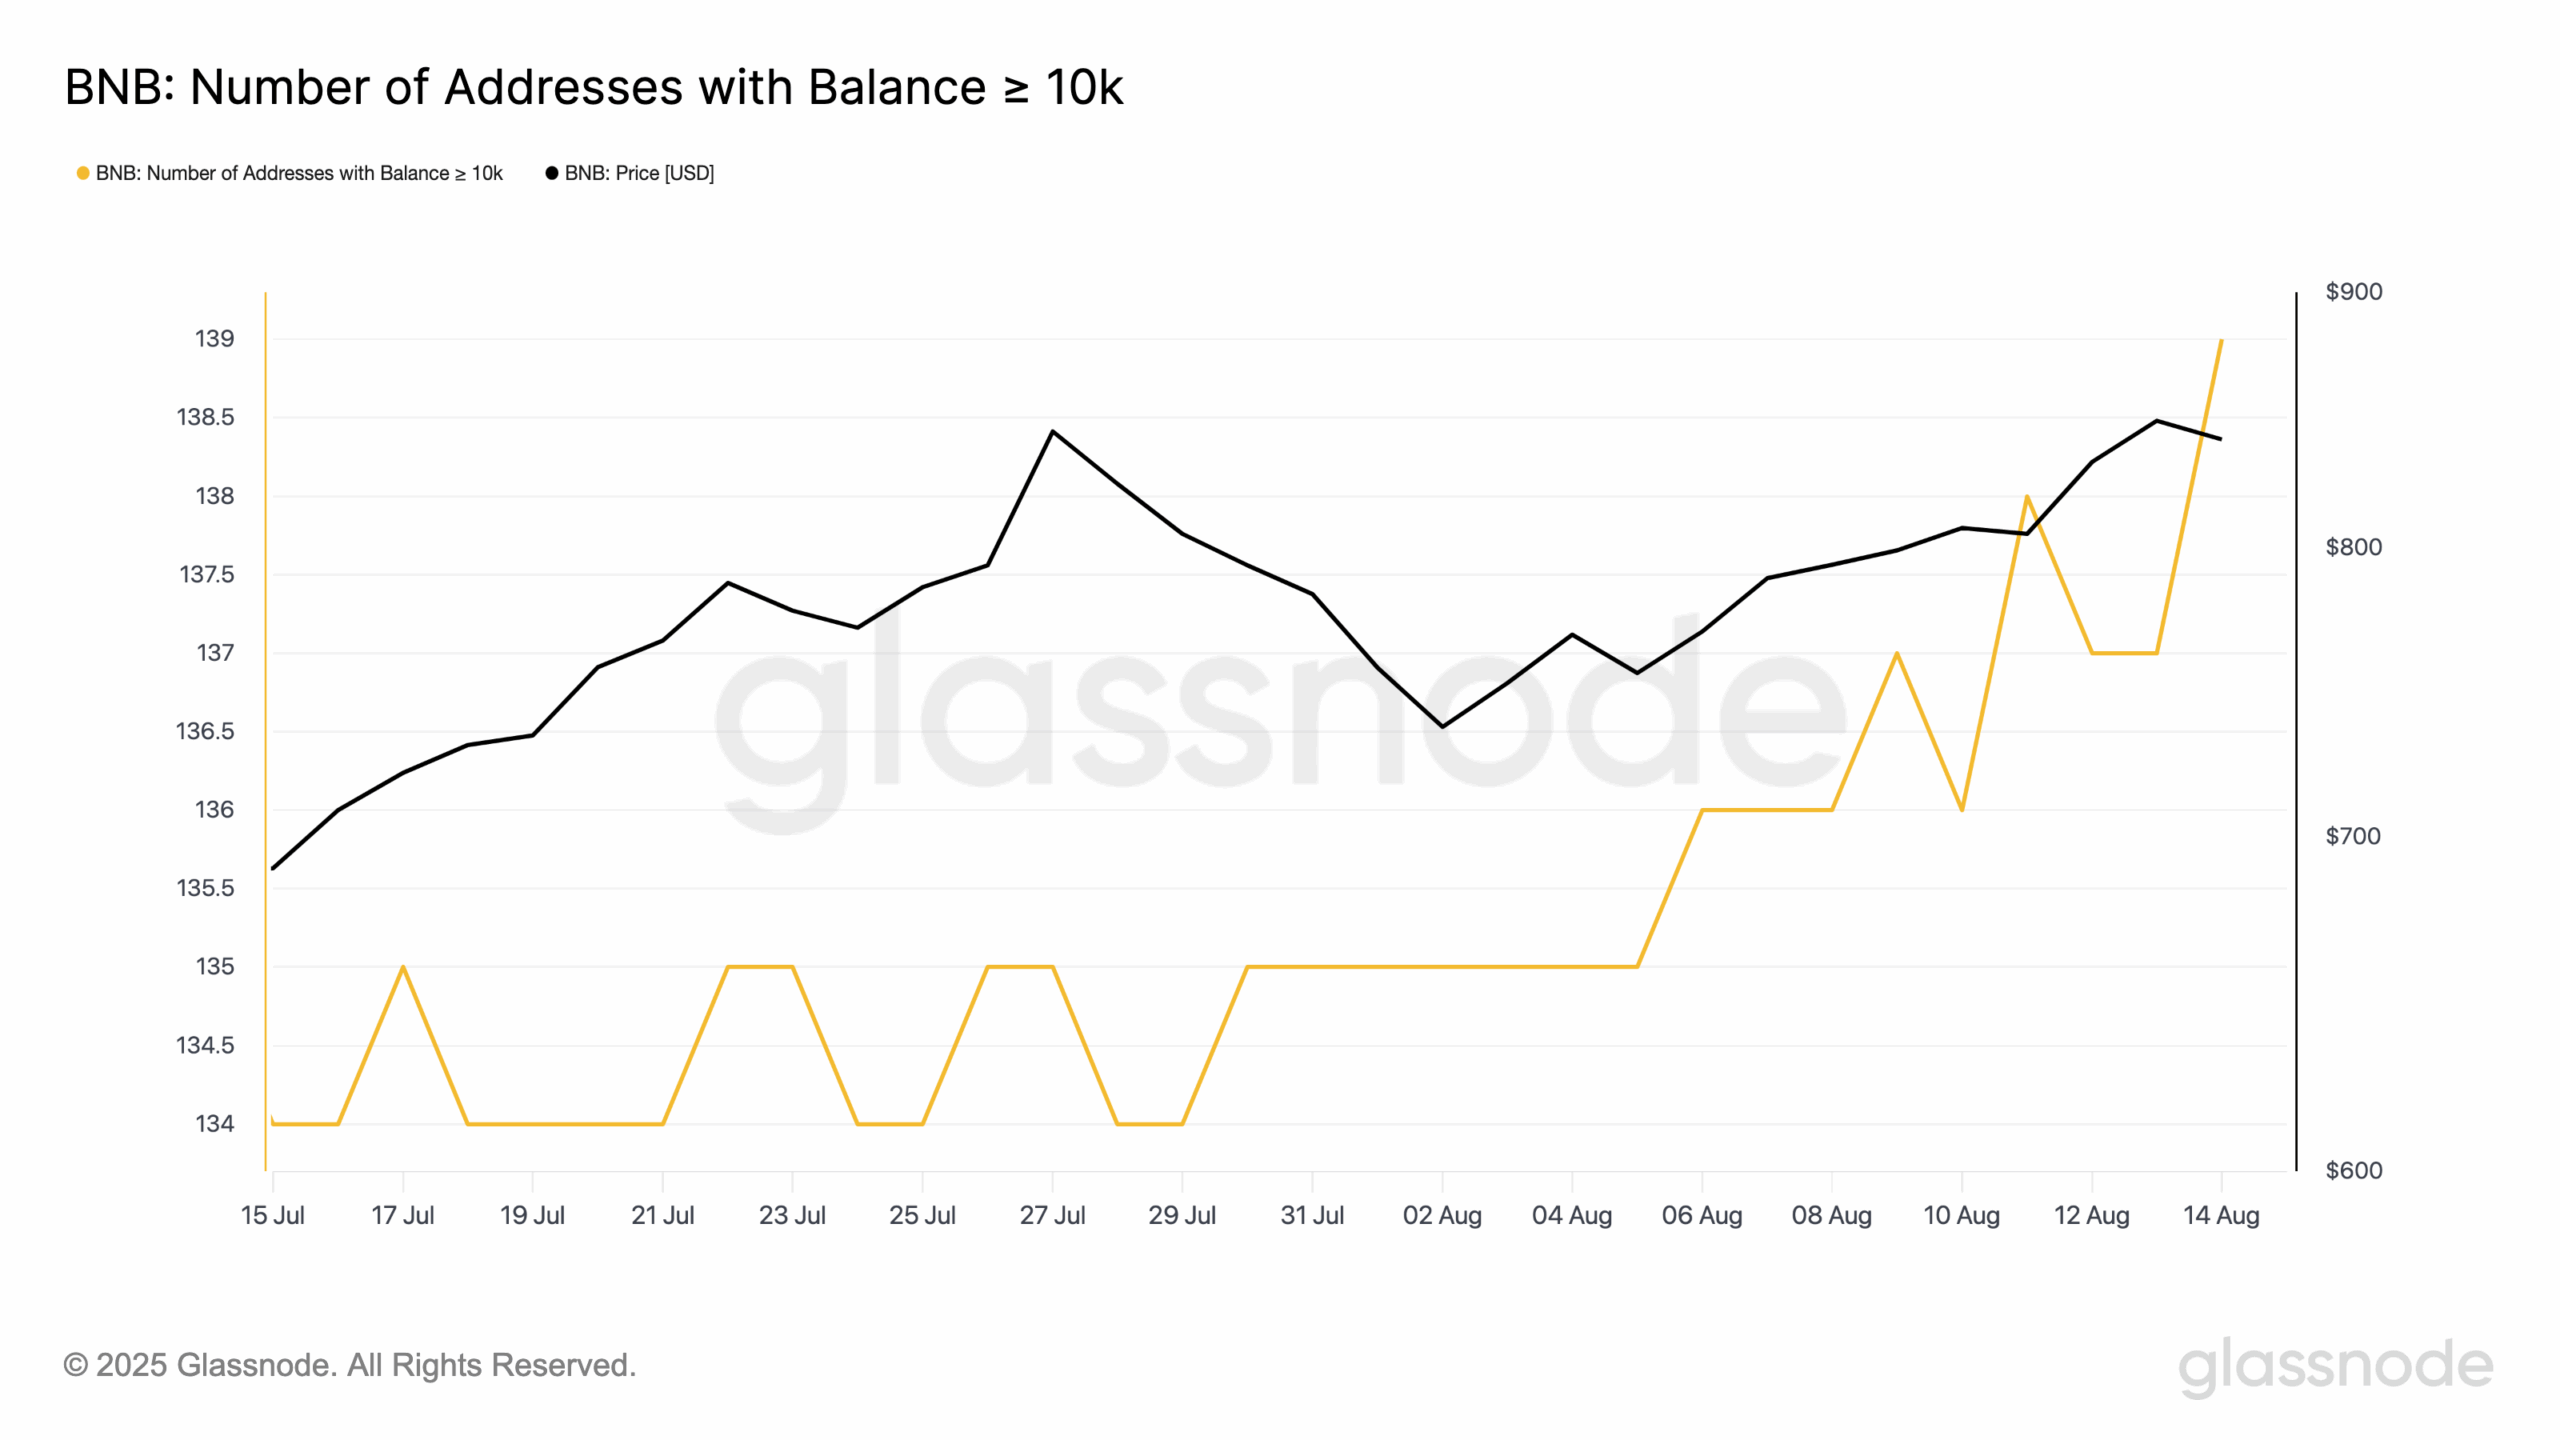
The coin trades above the Ichimoku Cloud, with rising whale holdings suggesting strong bullish momentum.
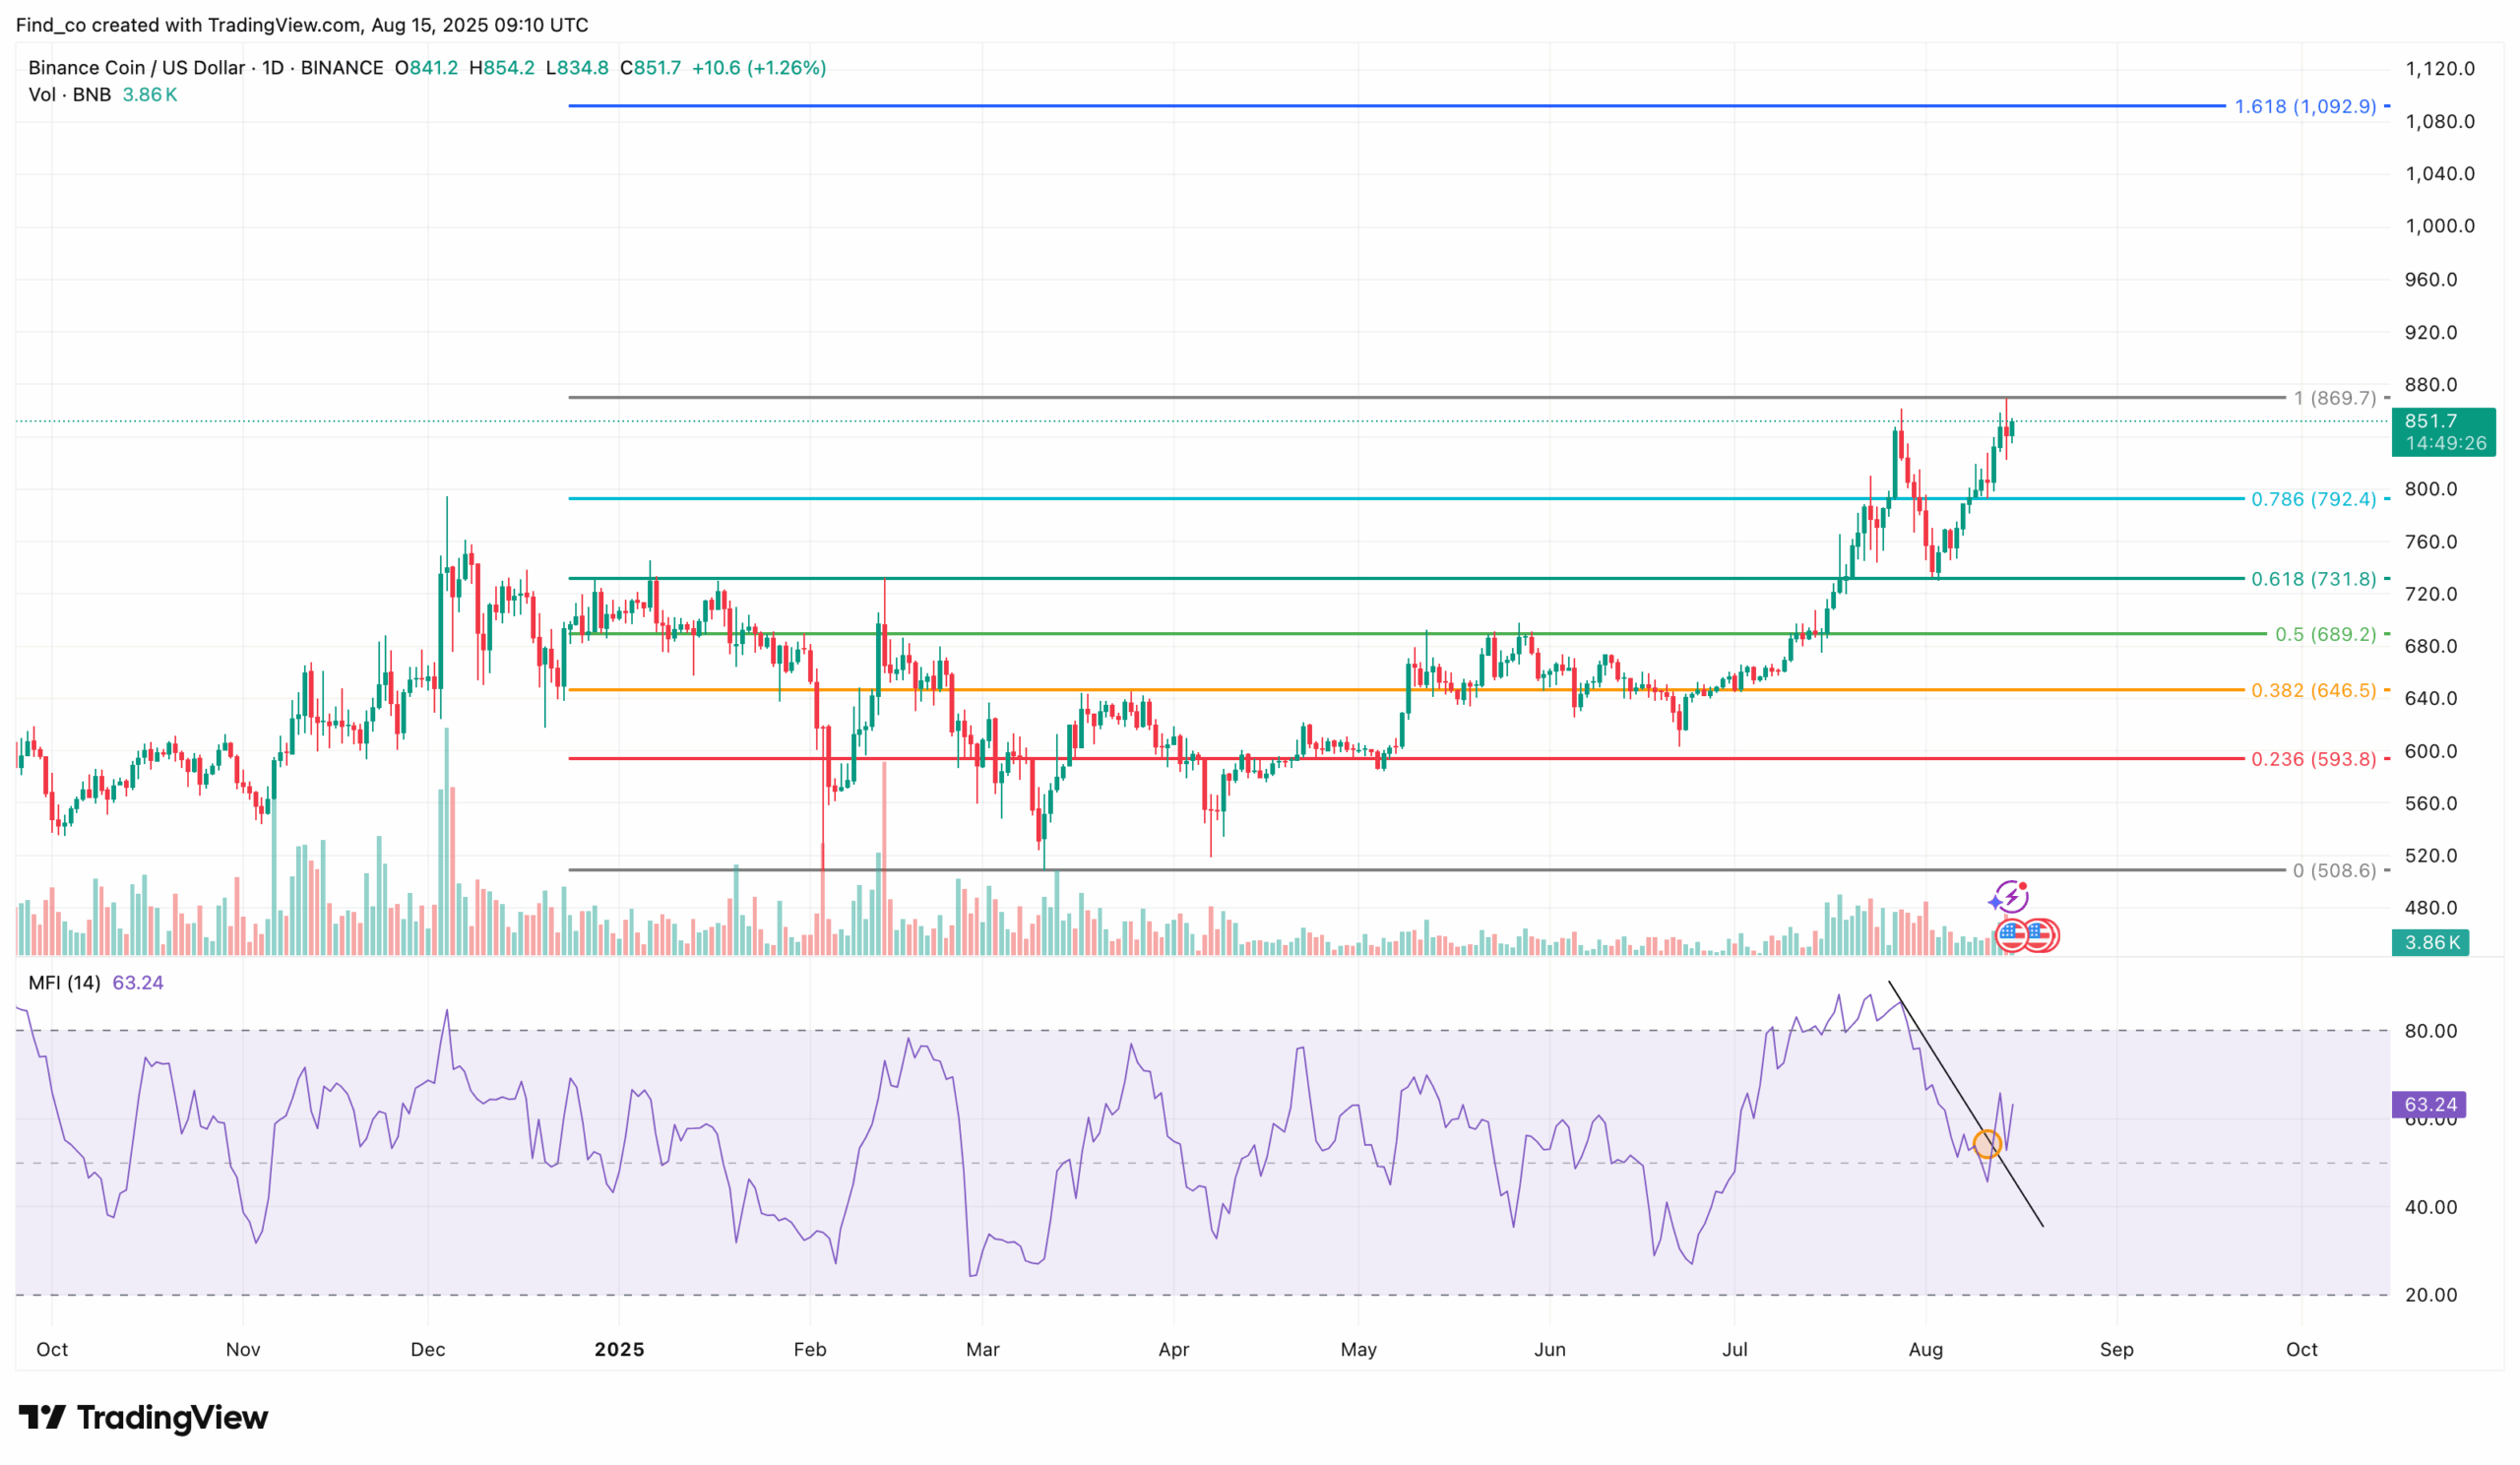
With sustained buying pressure, BNB’s price could surpass $869.70 and hit a new all-time high of $1,092.90.
After reaching a record-breaking high of $868.68 on Aug. 14, BNB’s price has eased off the throttle. At press time, the market value has dropped to $851.97.
While the coin has taken a breather, the current consolidation might not last long.
Instead, BNB’s price only took a step back before making another explosive move. Here are the reasons for this and the targets the cryptocurrency could reach before the year ends.
BNB ATH Pullback Is No Problem
Despite the modest pullback, BNB’s price action still trades within an ascending triangle pattern. This bullish continuation setup signals the potential for an upside breakout once resistance is cleared.
Adding to the outlook, BNB has moved above the Ichimoku Cloud on the 4-hour chart. This position indicates a change in momentum as trading above the cloud typically reflects strong support levels beneath the price and a favorable trend bias.
Try Our Recommended Crypto Exchanges
Sponsored
Disclosure
We sometimes use affiliate links in our content, when clicking on those we might receive a commission at no extra cost to you. By using this website you agree to our terms and conditions and privacy policy.
Therefore, if BNB can maintain its hold above the cloud and press toward the triangle’s resistance line, a breakout could trigger a fresh rally toward higher targets.
On top of this, the Awesome Oscillator (AO) has started printing green histogram bars and is currently in positive territory.
This position reinforces the bullish sentiment, as green bars indicate that short-term momentum is now outpacing the longer-term trend. Should the AO remain in the green area, BNB’s price will likely breach the $862.20 resistance again.
This rise signals increasing accumulation among large holders (whales), significantly influencing the price.
An uptick in such addresses can indicate rising confidence in the asset’s long-term value, as these entities are more likely to maintain significant positions rather than engage in short-term trading.
Combined with the bullish technical setup, the expansion in whale holdings strengthens the case for a continued short-term BNB price upswing.
BNB Price to Reach 4-Figures
Regarding BNB’s short- to mid-term outlook, CCN’s daily chart analysis shows a notable shift in momentum. The Money Flow Index (MFI) has broken above its previously descending trendline, signaling a potential reversal in capital flows.
Crucially, the MFI has also refused to drop below the neutral 50 level, a sign that buying pressure outweighs the selling volume. This resilience suggests that traders are consistently stepping in to accumulate BNB on dips, reinforcing bullish sentiment.
Should this trend remain the same, BNB’s price might surpass the resistance at $869.70. Once this happens, the next target for the cryptocurrency could be $1,092.90, representing a new all-time high.
Alternatively, a rise in selling pressure could invalidate this outlook. If that were to happen, BNB might slide to $792.40 at the 0.786 Fibonacci retracement level.
Disclaimer:
The information provided in this article is for informational purposes only. It is not intended to be, nor should it be construed as, financial advice. We do not make any warranties regarding the completeness, reliability, or accuracy of this information. All investments involve risk, and past performance does not guarantee future results. We recommend consulting a financial advisor before making any investment decisions.
Victor Olanrewaju is a crypto analyst and reporter at CCN with deep roots in on-chain research and technical analysis. His crypto journey began in 2017, but it was the 2020 Uniswap airdrop that sparked a full-time pivot into the space.
With a foundation in copywriting, Victor honed his craft creating high-converting content for leading crypto brokers — most notably an XRP price prediction that ranked #1 on Google during the 2021 bull run.
He later joined AMBCrypto in 2022, where he combined storytelling with technical and on-chain analysis to cover key market narratives.
In 2024, he expanded his expertise at BeInCrypto, collaborating with analysts and using tools like Glassnode, Santiment, and IntoTheBlock to break down Bitcoin and altcoin trends.
At CCN, Victor covers the top cryptocurrencies, memecoins, macro shifts, blending real-time insights with deep-dive metrics.
He holds a Bachelor’s degree in Physics from the University of Ibadan, equipping him to simplify complex data for a wide audience. Follow his work or connect on LinkedIn or X.