As BNB trades within a tight horizontal channel, long-term holders are quietly accumulating.
Derivatives markets tell a different story, with BNB’s long/short ratio sitting below 1 and falling futures open signalling that leveraged traders remain cautious.
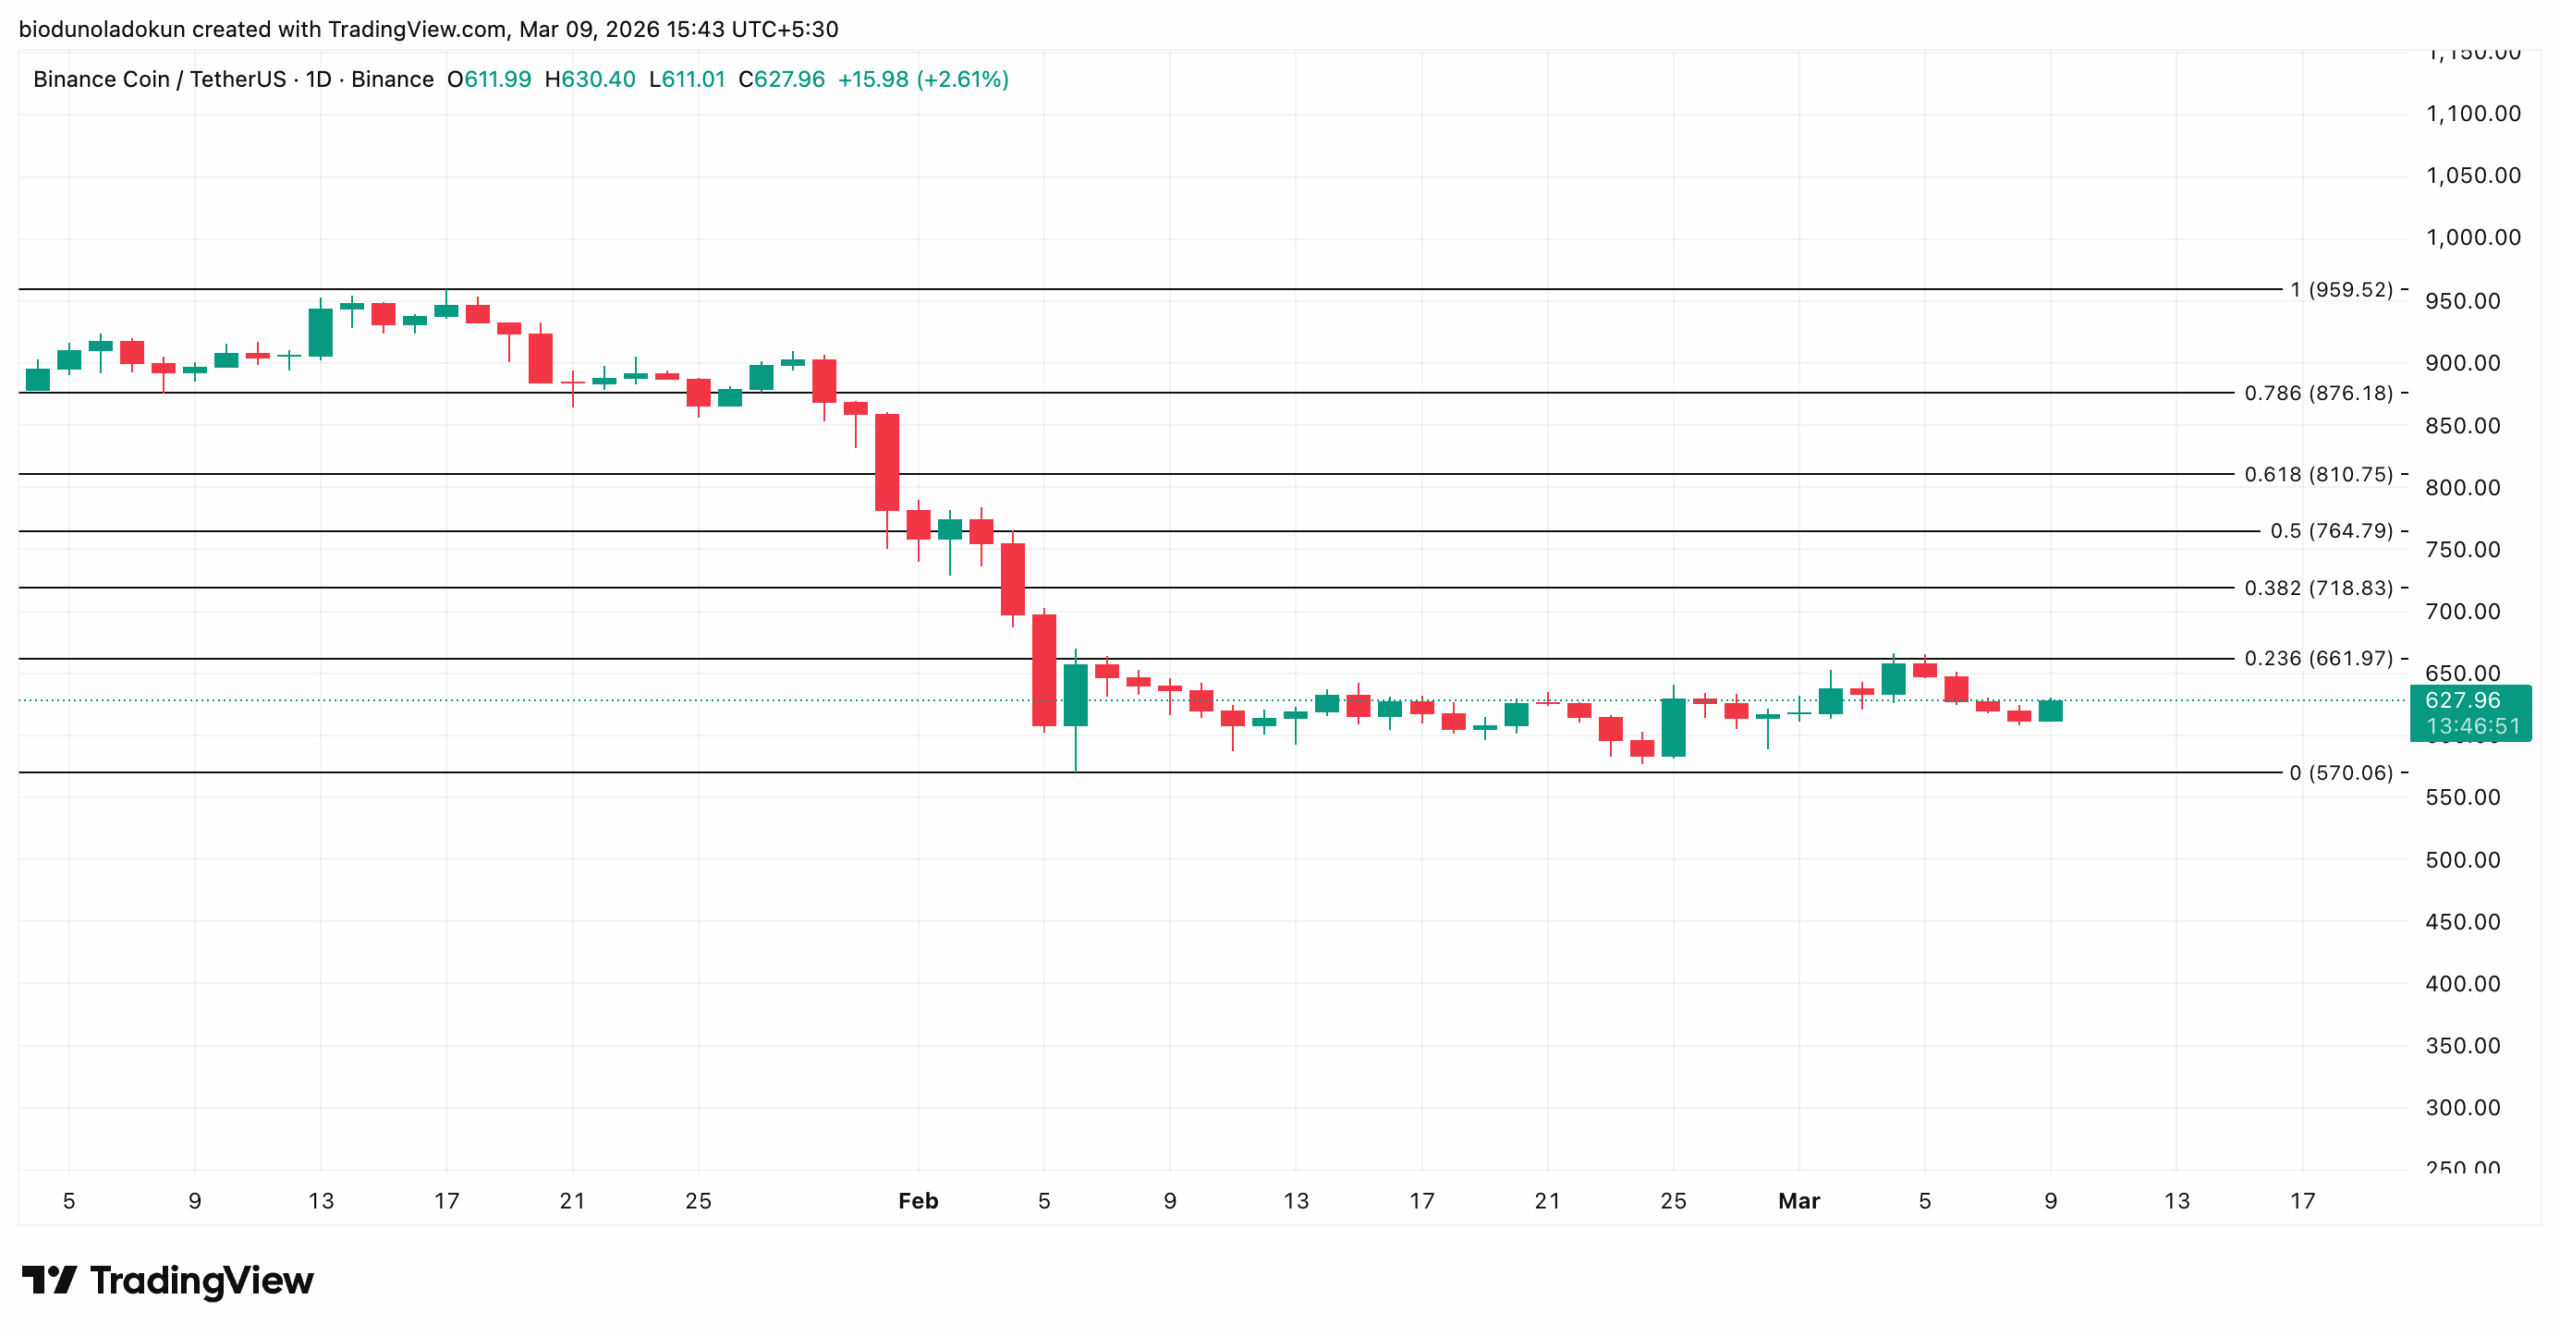
A confirmed break above $661.97 could open the path to $718.83 and $764.79. However, a slip below $570.06 would signal a break of the sideways structure.
The general cryptocurrency market’s lackluster performance has put BNB’s price in a tight horizontal channel on the daily chart.
The altcoin is currently facing resistance at $661.97, with a support floor at $570.06.
Interestingly, some investors are not phased by this.
On-chain data signals growing bullish conviction among BNB’s long-term holders who appear to have interpreted the prolonged price weakness as an opportunity to accumulate.
BNB Long-Term Holders Are Loading Up
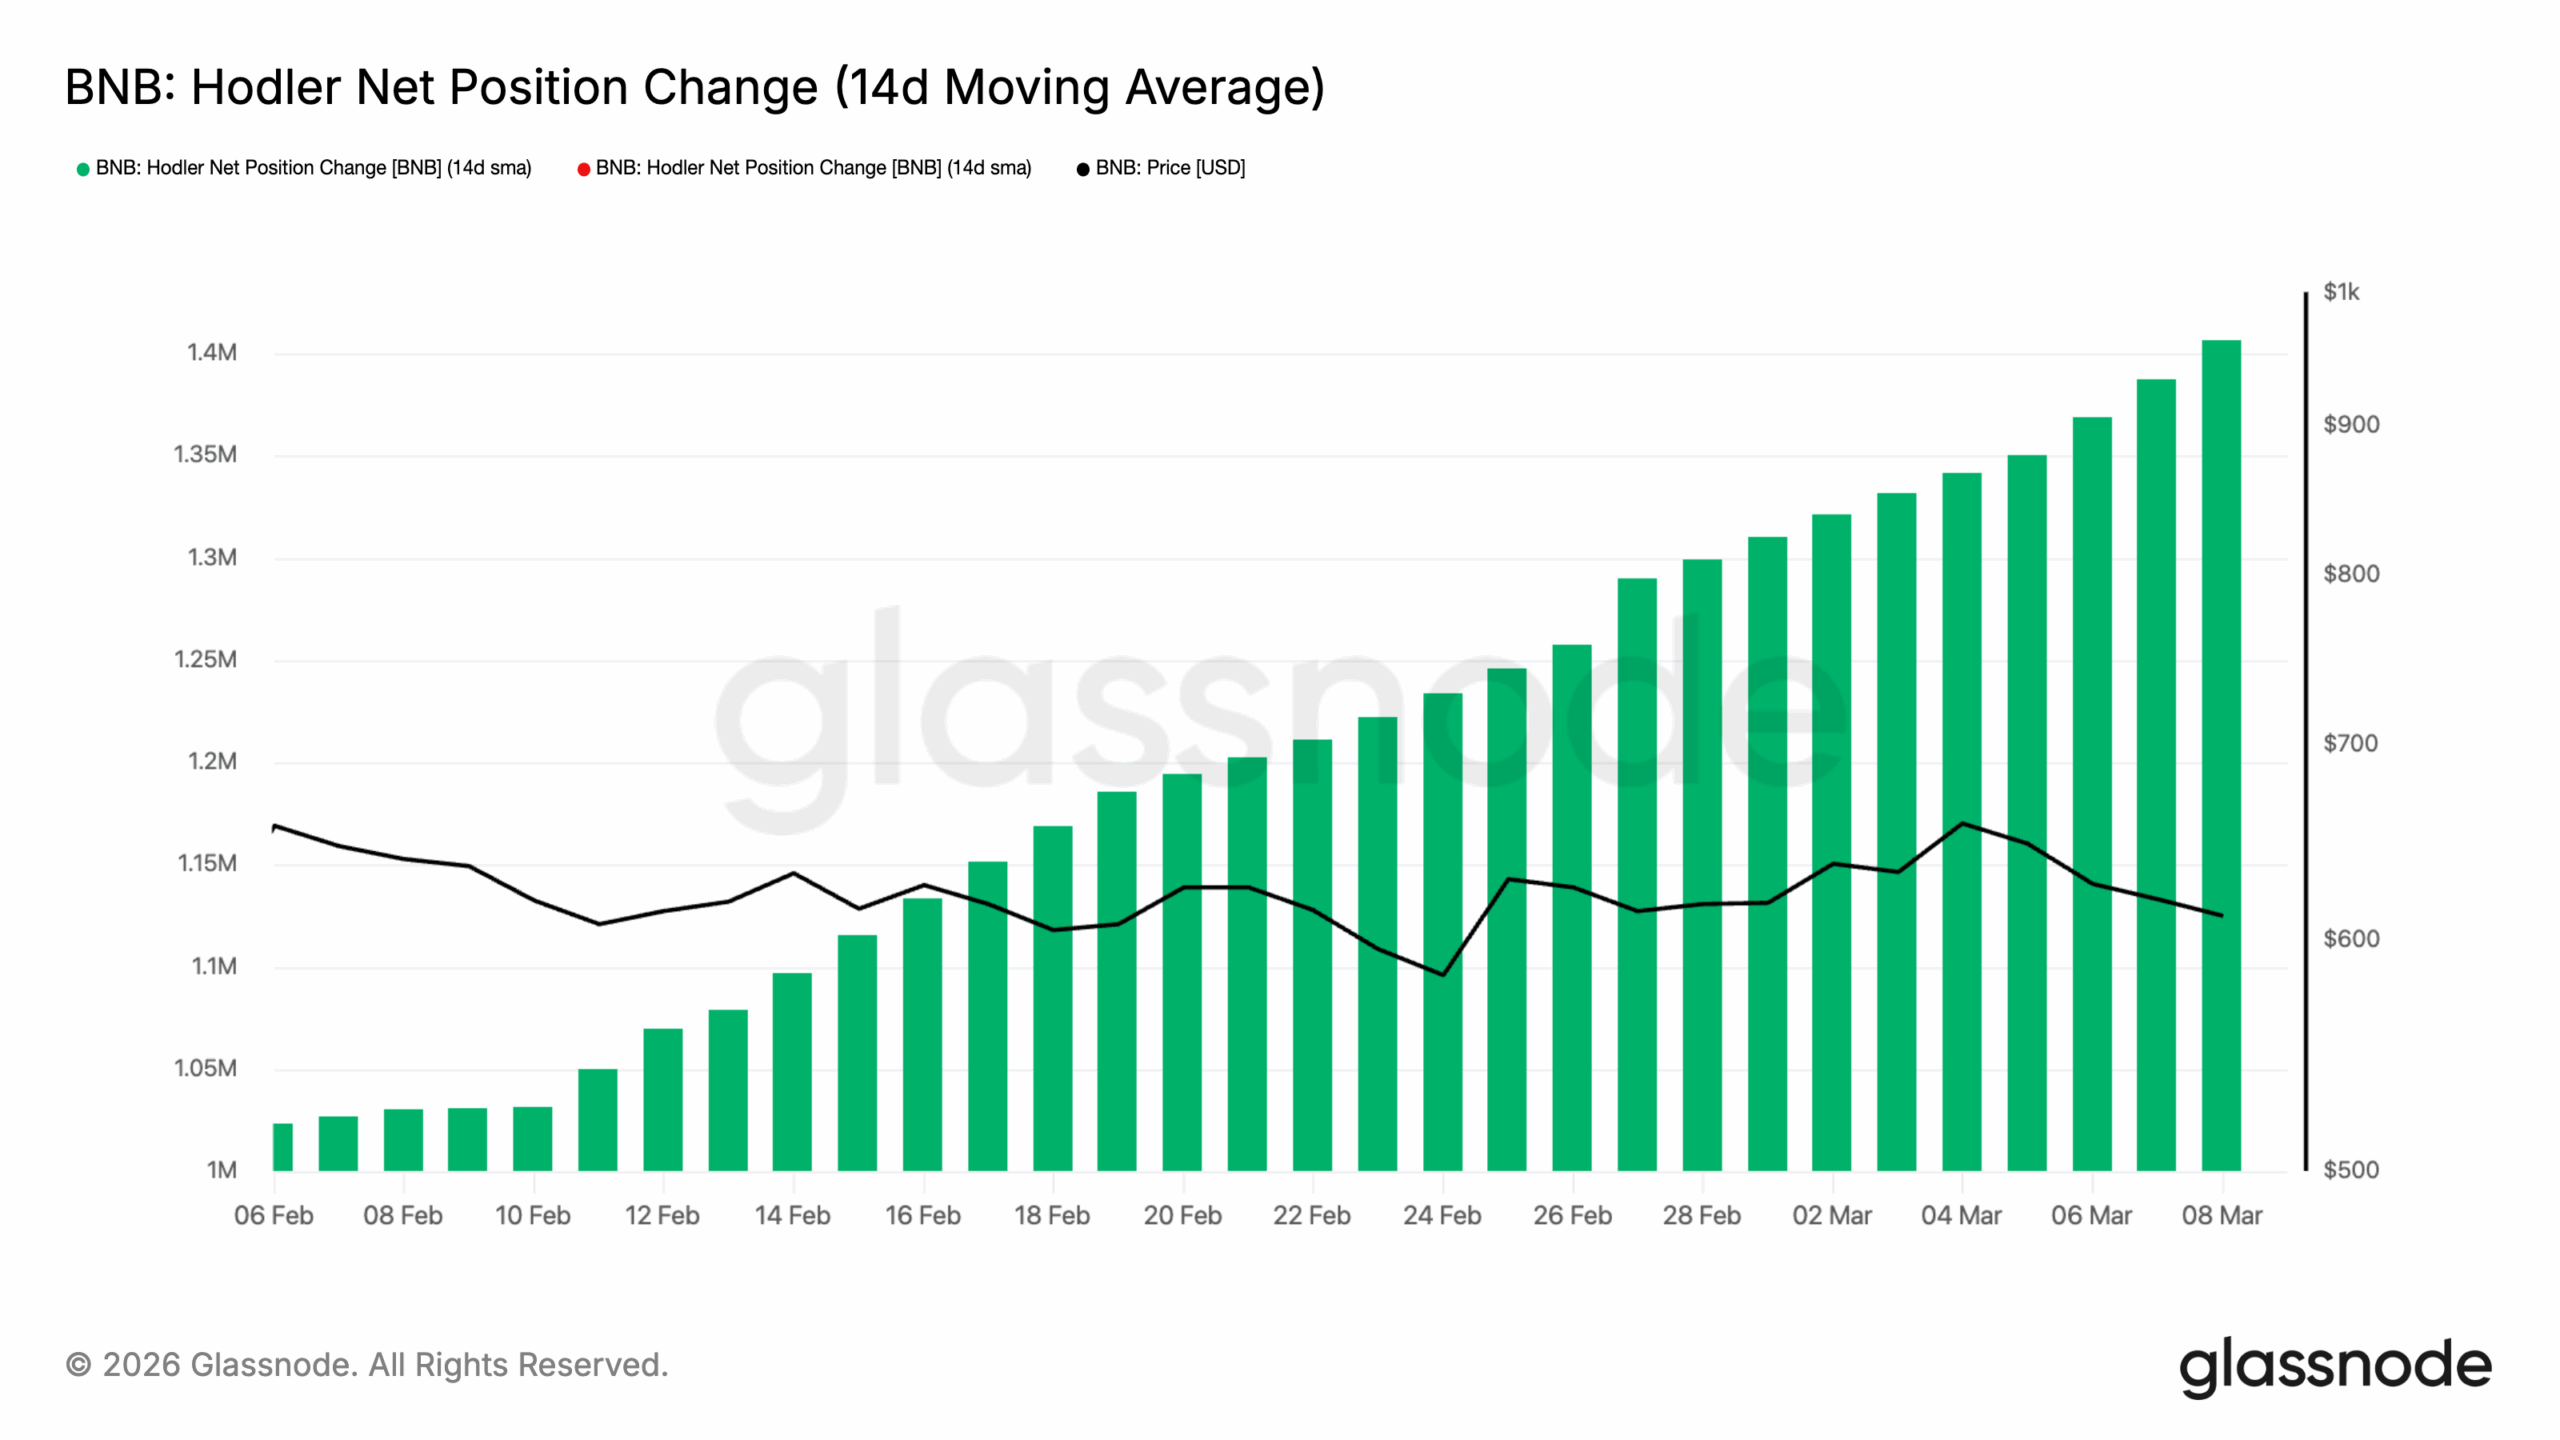
BNB’s long-term holders are investors who have held their coins for more than 155 days. According to Glassnode, BNB’s Hodler Net Position change has climbed despite the sideways price trend, confirming that these investors are net accumulators in the current market.
An asset’s Hodler Net Position tracks the net position of its long-term holders over a given period, measuring whether these investors are increasing or reducing their exposure.
When it falls and returns negative values, it signals that long-term holders are distributing their assets rather than accumulating
Conversely, a positive reading indicates that more coins are being transferred into hodler wallets.
Per Glassnode, BNB’s Hodler Net Position (observed using a 14-day moving average) has risen gradually to close at 1.4 million BNB on March 8.
BNB Hodler Net Position Change | Credit: Glassnode
This growth, despite the sideways price trend, signals that long-term holders are accumulating BNB, hinting at a near-term recovery.
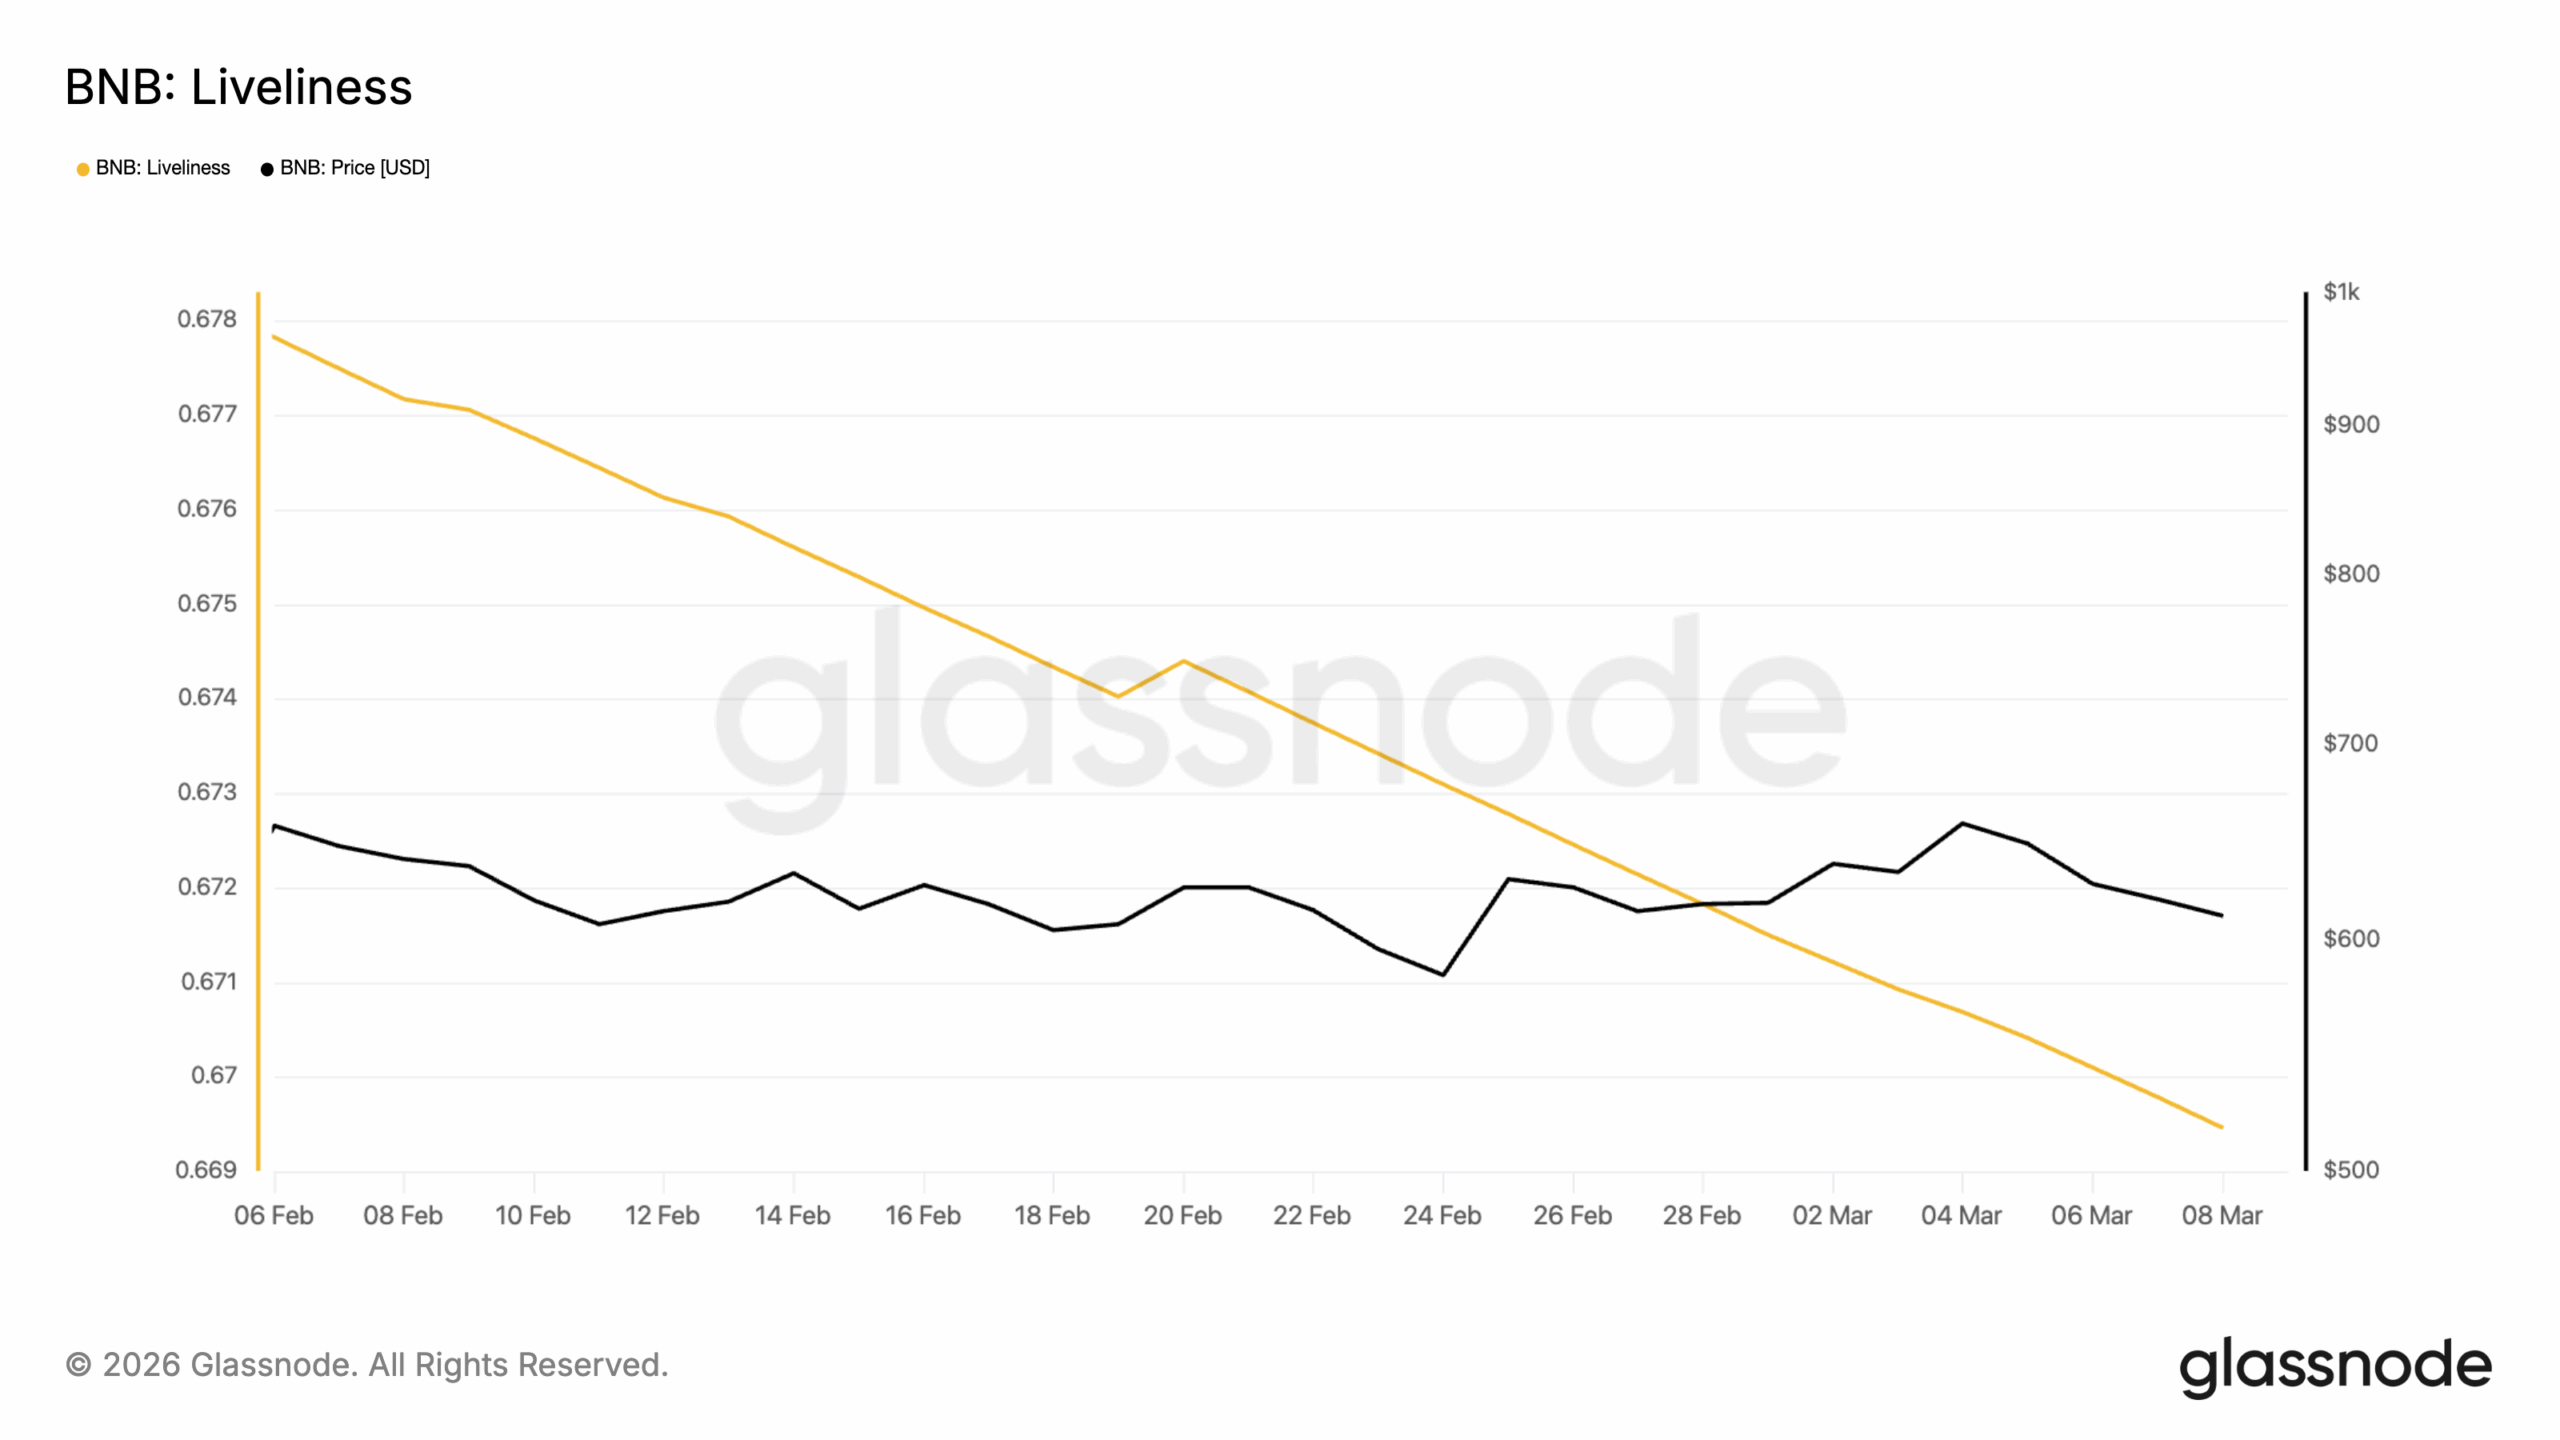
Moreover, BNB’s falling Liveliness confirms this bullish outlook. At press time, this metric, which tracks the movement of previously dormant tokens, sits at a two-year low of 0.66.
When an asset’s Liveliness climbs, it means more dormant coins are being moved or sold, signaling increased profit-taking by long-term holders.
On the other hand, when it falls, as in BNB’s case, long-term holders are moving their assets off exchanges, often a bullish sign of accumulation.
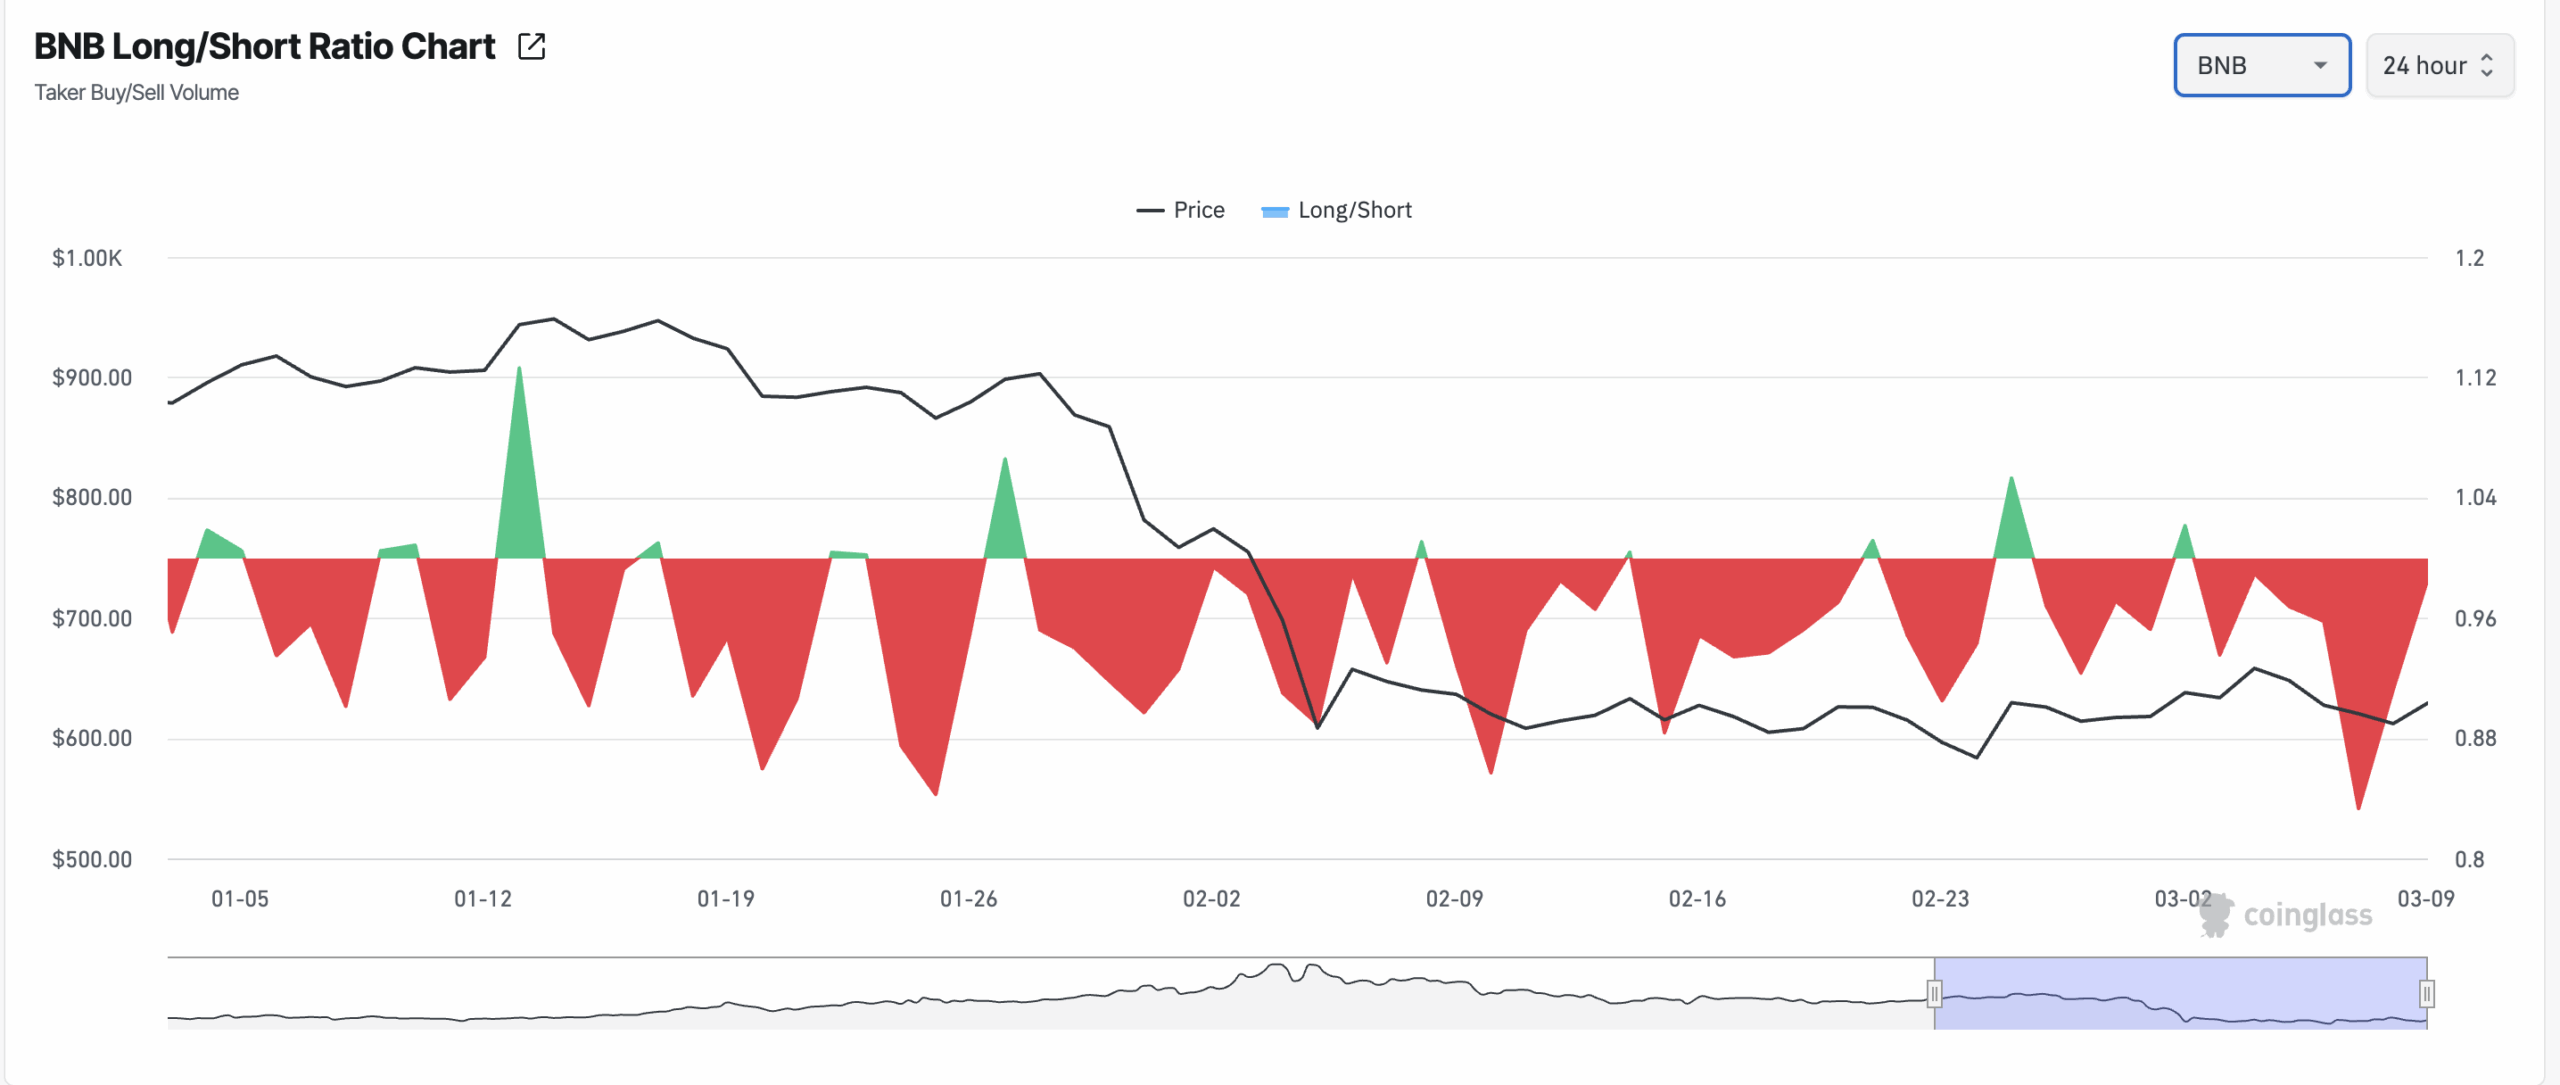
Derivatives Traders Are Not Convinced
While long-term holders are bullish, readings from BNB’s derivatives market paint a more cautious picture. CoinGlass data shows that BNB’s long/short ratio has been predominantly negative since the year began, and the sell-side dominance has only deepened as price has remained sideways.
As of this writing, BNB’s long/short ratio sits below one at 0.98. This ratio tracks the balance between traders betting on price increases (longs) versus those betting on declines (shorts).
When the ratio is above 1, it indicates that long positions dominate, signaling bullish sentiment. Conversely, a ratio below 1, like BNB’s, suggests that short positions are heavier, pointing to bearish expectations.
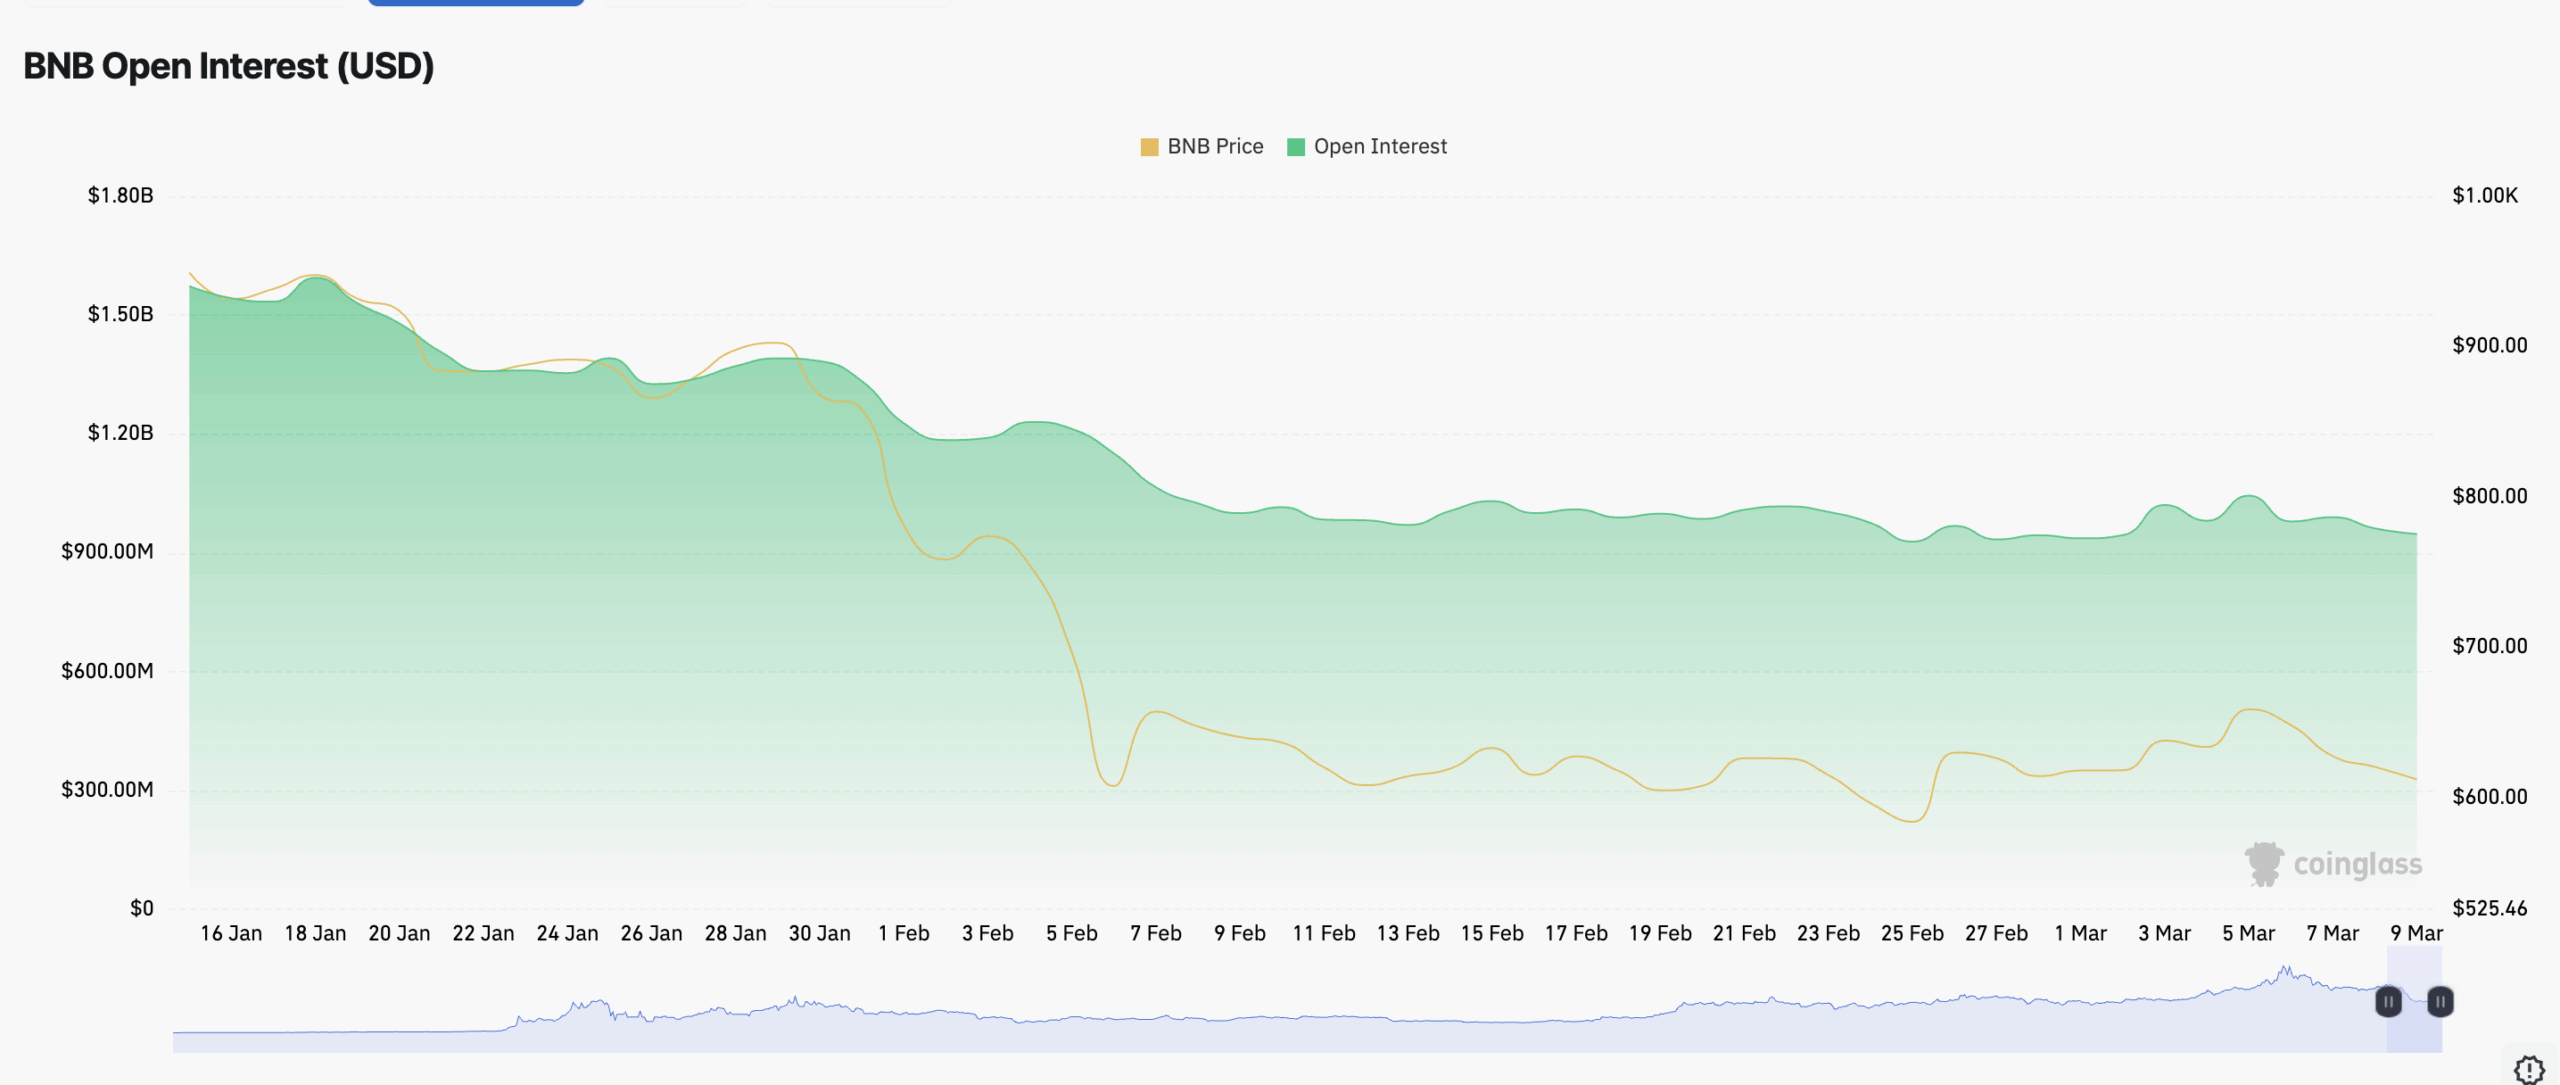
The coin’s plummeting futures open interest validates this negative outlook. At press time, this is at $943 million, down 5% in the past 30 days.
Open interest measures the total number of outstanding futures or options contracts that have not been settled or closed. When it declines like this, it suggests that traders are closing out their positions, leading to fewer active contracts in the market.
It is considered a bearish signal, indicating a decline in market activity and traders’ interest. This dip weighs on BNB’s price performance over time, thereby putting it at risk of breaking below its horizontal channel.
Bulls Need One Thing to Trigger a BNB Breakout
Should long-term holders continue to accumulate, buying pressure could push BNB past the $661.97 resistance.
A confirmed daily close above this level would mark BNB’s first meaningful technical breakout since the February collapse and open the door to the next Fibonacci target at $718.83, the 0.382 retracement level.
If the bulls sustain momentum at this zone, BNB could extend its recovery toward $764.79.
However, if macro headwinds persist and derivatives sell pressure overwhelms on-chain demand, BNB risks falling out of the current consolidation range.
A breakdown below $570.06 would invalidate the horizontal channel structure entirely and expose the coin to a deeper corrective move to $570.06.
Disclaimer:
The information provided in this article is for informational purposes only. It is not intended to be, nor should it be construed as, financial advice. We do not make any warranties regarding the completeness, reliability, or accuracy of this information. All investments involve risk, and past performance does not guarantee future results. We recommend consulting a financial advisor before making any investment decisions.
Abiodun Oladokun is a Research Analyst at CCN, where he covers cryptocurrency markets with a focus on on-chain analysis, technical assessments, and emerging trends across decentralized finance (DeFi), real-world assets (RWA), artificial intelligence (AI), decentralized physical infrastructure networks (DePIN), Layer 2s, and meme coins.
Prior to CCN, he served as a Senior On-Chain Analyst at BeInCrypto, producing market reports spanning diverse crypto sectors.
Before that, he conducted technical analysis and market assessments of various altcoins at AMBCrypto, where he also contributed long-form quarterly research papers on DeFi, NFTs, DAOs, and scaling architectures, leveraging on-chain platforms including Messari, Santiment, DefiLlama, and Dune Analytics.
He began his crypto career as a research analyst at SixthSense DAO, developing blockchain forensic tools to trace the history of stolen assets.
Abiodun is a lawyer called to the Nigerian Bar and the founder of Ilé Ijó, a Lagos-based electronic dance music collective.