Has Bitcoin's Market Cycle Ended | Credit: Hameem Sarwar
Share
Key Takeaways
Bitcoin (BTC) has fallen since its all-time high on Jan. 20.
The BTC price has created a short-term double-top pattern.
Has Bitcoin’s cycle ended, or is this the final dip before new highs?
The Bitcoin price increased 22% since January 13, culminating with a new all-time high price seven days later.
While this sparked optimism of a sustained rally toward $150,000, this was untrue. Rather, BTC fell gradually, accelerating its decrease on Jan. 26.
The ongoing decline has also created a bearish pattern, sparking fears that further lows are in store.
So, the key question is: has Bitcoin started a bearish trend, or is this a temporary dip that will be recovered in the next few weeks? Let’s analyze the charts and find out.
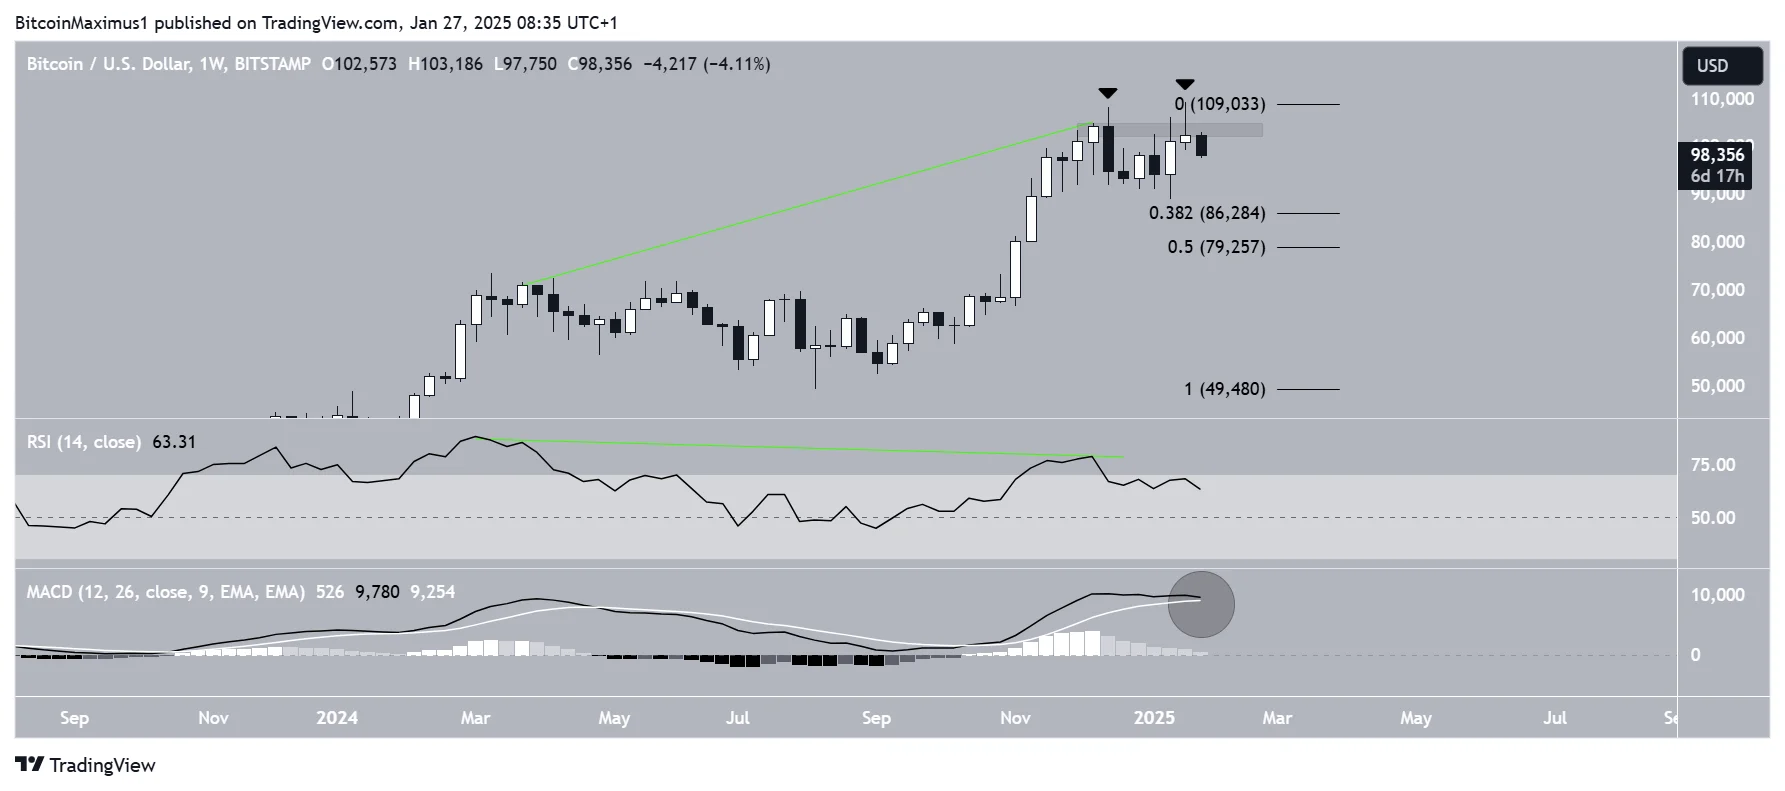
The weekly Bitcoin price chart shows considerable weakness for several reasons. On Jan. 20, the price created a double-top pattern (black icons) during the all-time high of $109,356.
In addition to being a bearish pattern, the double-top was combined with two long upper wicks (black icons), considered signs of selling pressure.
Furthermore, the second top was slightly higher than the first one, creating a deviation above the $105,00 horizontal resistance area.
If the Bitcoin decline continues, the closest support area is created by the 0.382-0.5 Fibonacci retracement support level at $79,259-$86,284.
Technical indicators have also turned bearish. The Relative Strength Index (RSI) has generated a lengthy bearish divergence since March 2024 (green).
While the Moving Average Convergence/Divergence (MACD) has not done the same, its momentum is waning in the short term, and the indicator has nearly made a bearish cross.
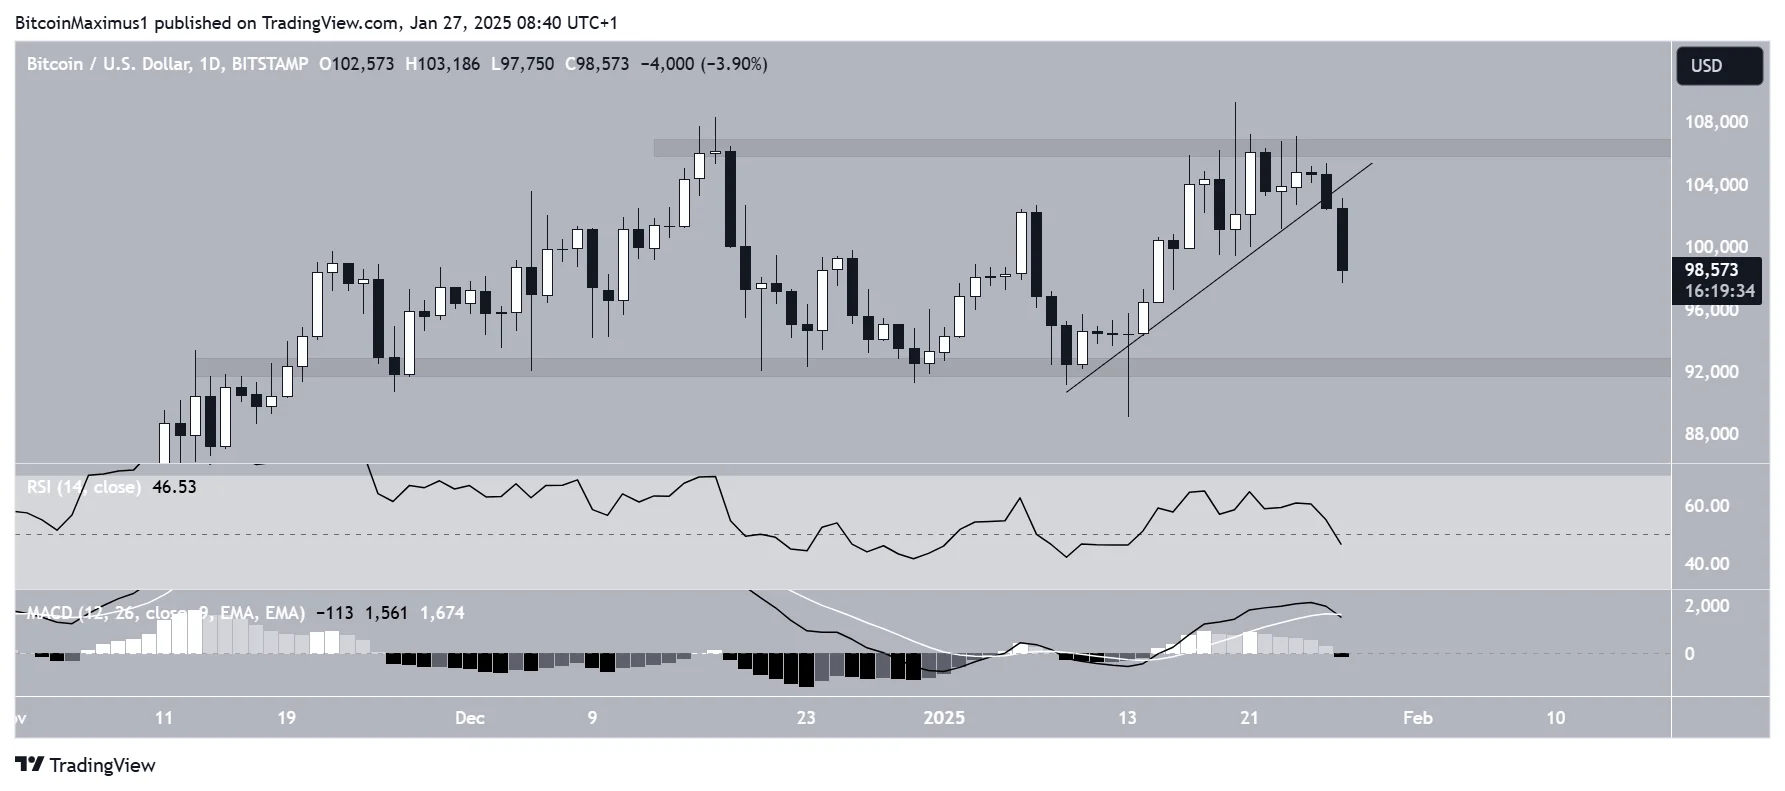
The short-term daily chart reiterates these bearish findings. The price broke out from an ascending support trend line, propping the upward movement since Jan. 9.
The decline could be the start of a BTC price fall to the range low of $92,500.
The RSI and MACD both support this bearish outlook. The RSI decreased below 50, while the MACD made a bearish cross. So, the weekly and daily time frame price action both give a bearish Bitcoin prediction, suggesting more downside is likely.
Let’s look at the wave count to determine if Bitcoin’s cycle has ended.
Has Bitcoin’s Cycle Ended?
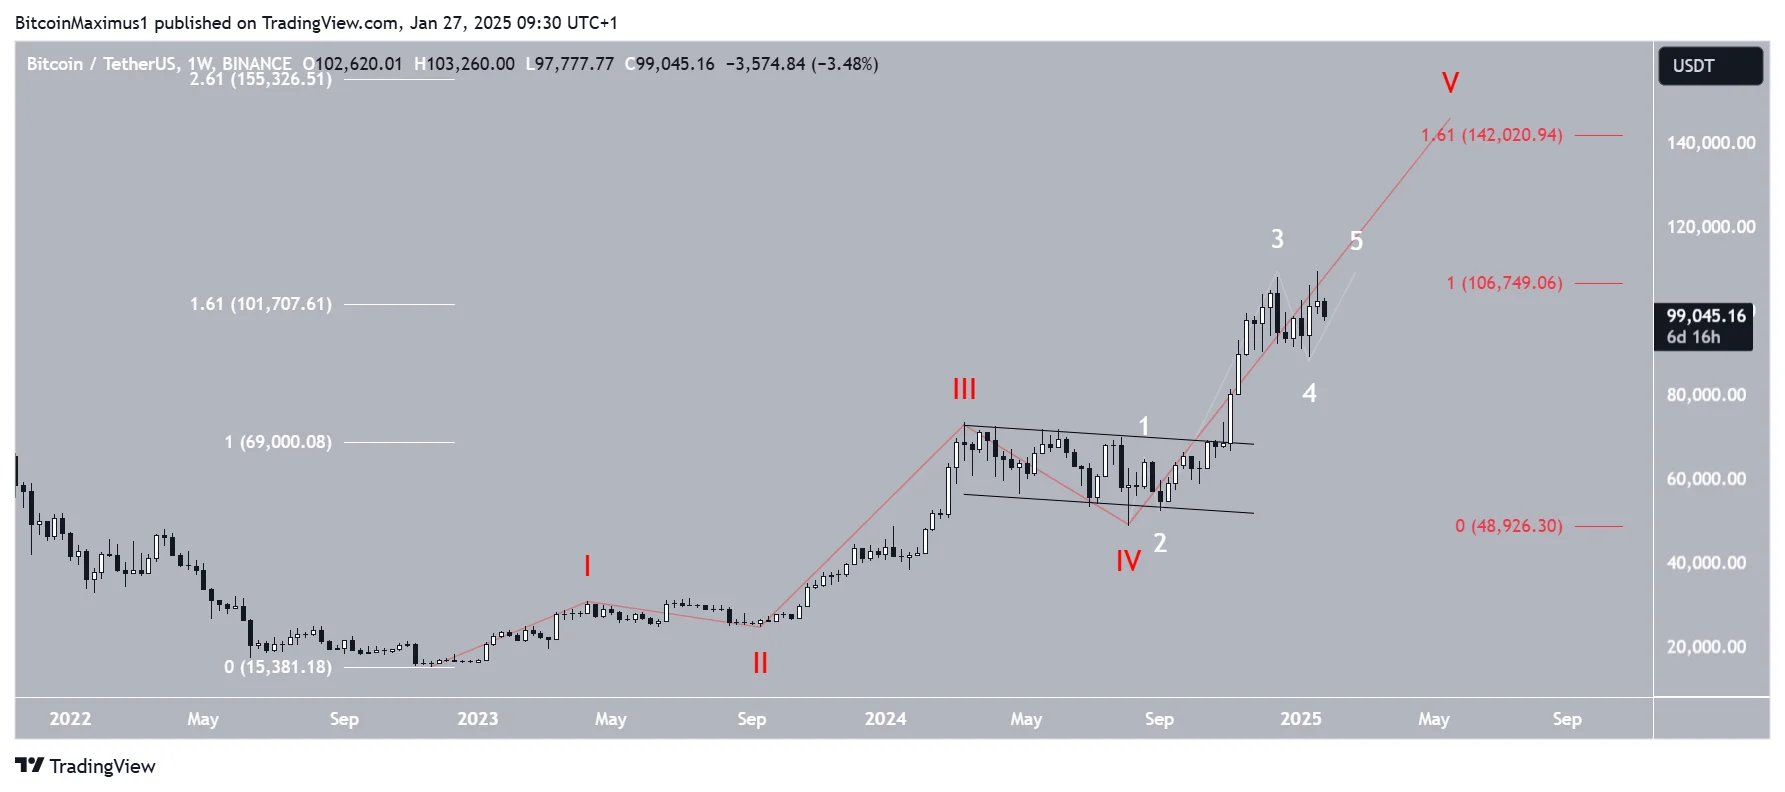
The long-term Bitcoin count (red) suggests the price is in the fifth and final wave of the current bullish cycle. The sub-wave count (white) suggests that BTC is in the fifth and final sub-wave of the upward movement.
It is unclear if the Bitcoin cycle has ended. Wave five has reached a confluence of Fibonacci levels, indicating the cycle might be over.
Wave five had the same length as waves one and three combined (red), and the price reached 1.61 external Fibonacci retracement of the previous drop.
If wave five extends, the next target will be at $142,020-$155,325.
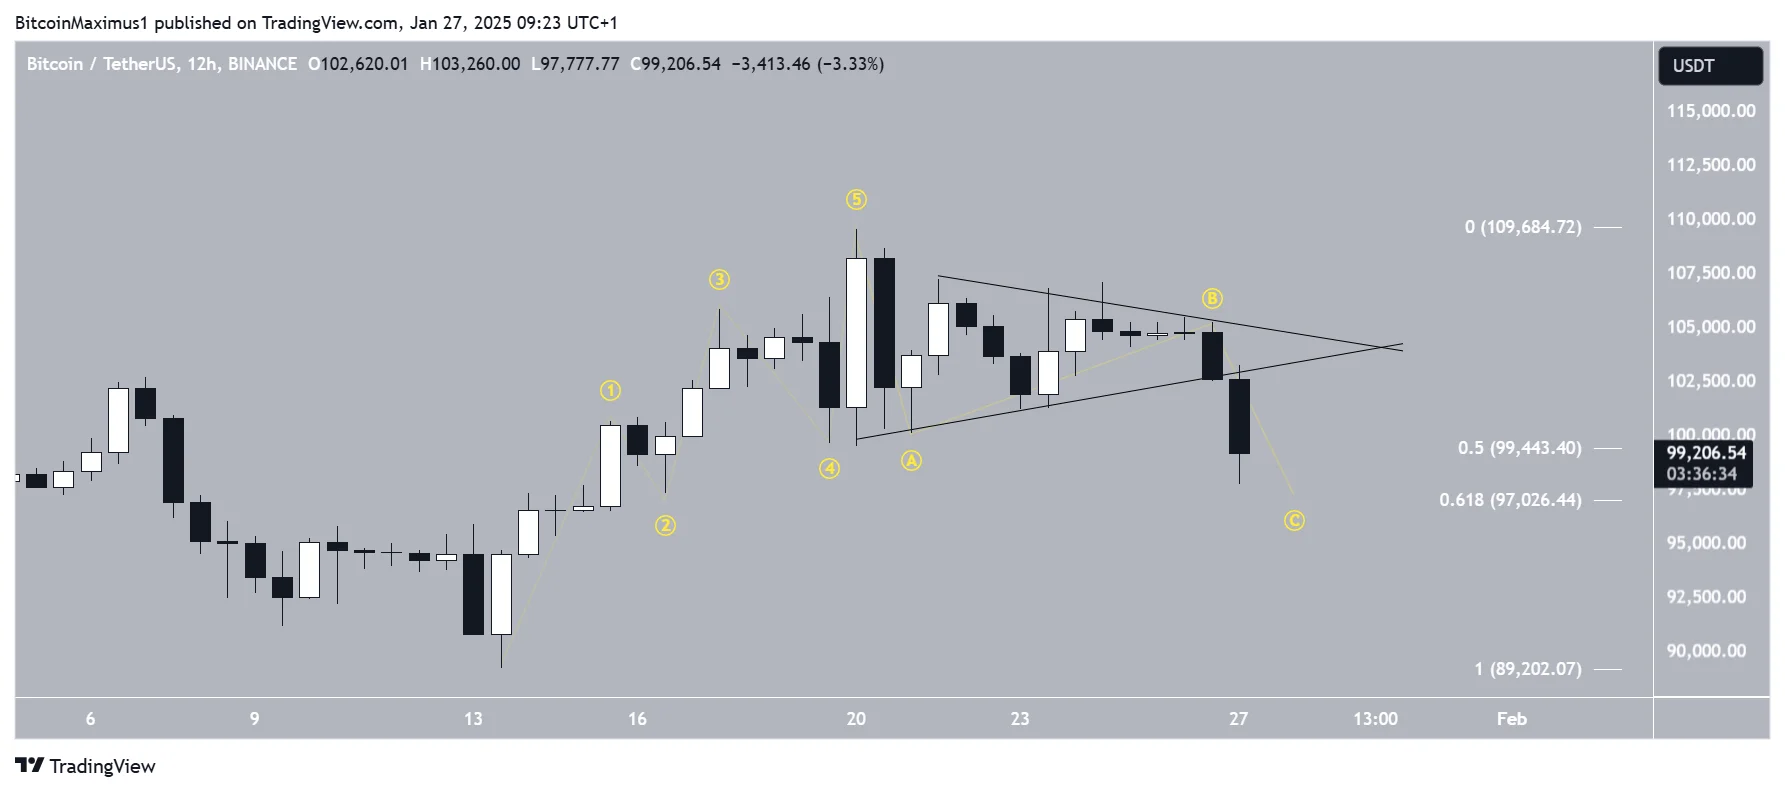
The issue with the count is that Bitcoin has completed a short-term five-wave increase since January 13. The upward movement makes it possible for the previously outlined wave five to end.
For the bullish count to remain alive, BTC has to bounce at the 0.5-0.618 Fibonacci retracement support level at $97,026 – $99,443.
If so, the current decline would be an A-B-C structure (yellow), with wave B developing into a symmetrical triangle. Then, wave five could extend to new highs.
As long as it does, this may be the first portion of a long-term increase toward new highs.
However, failure to bounce at the current level could indicate that the entire bullish cycle is over, which could lead to new lows.
Critical Level Ahead
The BTC price has fallen significantly since its all-time high. There are signs that the entire bullish cycle has ended.
However, BTC can still extend its upward movement toward $142,020-$155,325 if it creates a higher low at the current short-term support. If not, the BTC price could fall to new lows below $90,000.
Disclaimer:
The information provided in this article is for informational purposes only. It is not intended to be, nor should it be construed as, financial advice. We do not make any warranties regarding the completeness, reliability, or accuracy of this information. All investments involve risk, and past performance does not guarantee future results. We recommend consulting a financial advisor before making any investment decisions.
Valdrin Tahiri is a cryptocurrency analyst and reporter at CCN, specializing in technical analysis with a focus on Elliott Wave theory, on-chain metrics, and fundamental research. He brings over seven years of experience in the crypto space as both a trader and writer.
He discovered cryptocurrencies in 2017 while earning his MSc in Financial Markets at the Barcelona School of Economics, which sparked a deep interest in blockchain and market dynamics. Since then, he’s contributed to top crypto outlets like BeInCrypto and CoinGape.
Valdrin also served as Community Manager of BeInCrypto’s Telegram group for three years, helping grow it into one of the largest crypto communities worldwide. His expertise in market structure and price patterns allows him to break down complex trends into clear, actionable insights.
He’s published thousands of articles covering altcoins, Bitcoin cycles, and macro trends.