HODL Waves and the Bitcoin Cycle | Credit: Derek Fenech
Share
Key Takeaways
Bitcoin’s HODL Waves indicate that medium-term holders are not yet cashing out.
Short-term participant activity is high but remains well below the peaks of previous cycles.
How can we utilize the HODL Waves indicator to determine when the Bitcoin cycle will conclude?
Bitcoin’s HODL Waves offer a clear window into market psychology, revealing when long-term holders remain steadfast and when short-term traders take the lead.
This indicator analyzes the age of unspent coins, revealing how conviction shifts across cycles and how close the market may be to reaching a peak.
In past bull runs, a surge in short-term activity has reliably signaled overheated conditions and eventual corrections.
Today, the data suggests that we’re not there yet and that the cycle still has room to unfold.
What Are HODL Waves
Bitcoin tracks ownership using the Unspent Transaction Output (UTXO) model, meaning a coin’s “age” is based on when it was last moved, not when it was mined.
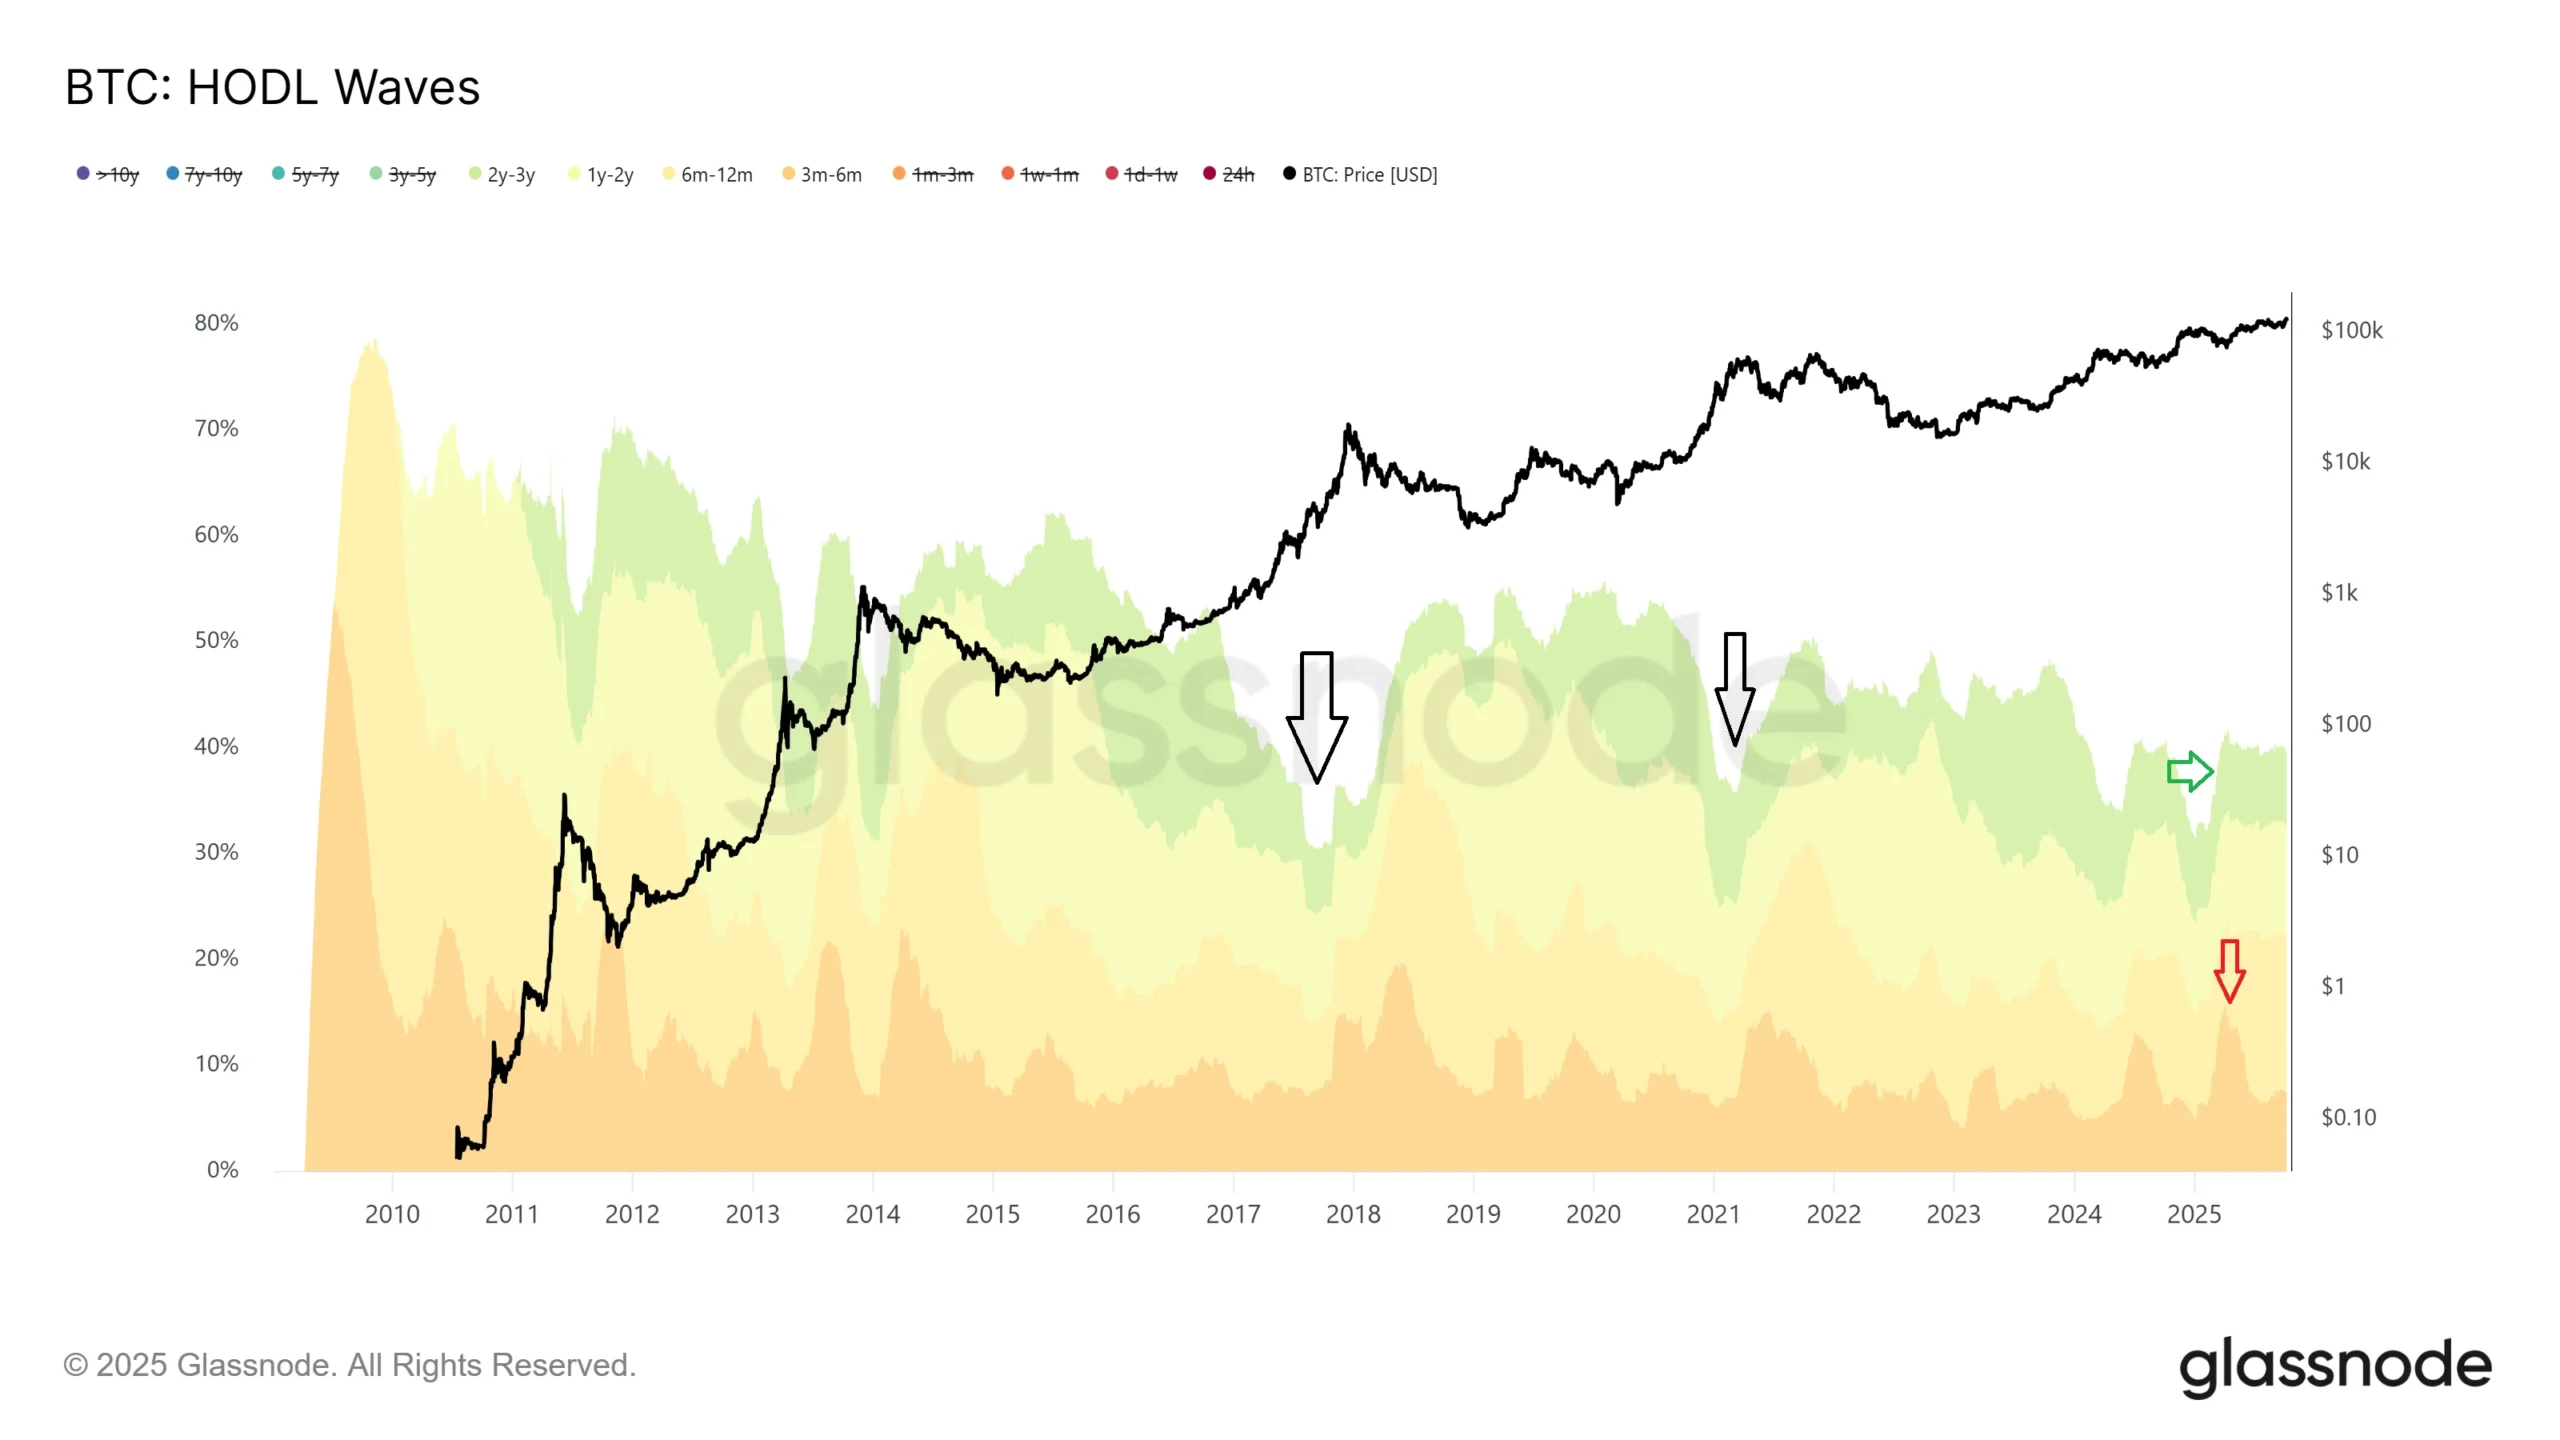
The HODL Waves indicator visualizes the age distribution of Bitcoin’s UTXOs.
Each band indicates the amount of BTC last spent within a specific timeframe. Warm colors (reds/oranges) mark recently moved coins, and cooler colors (greens/blues) represent long-term holdings.
Investors hold rather than sell when long-term bands expand, while shrinking bands indicate profit-taking.
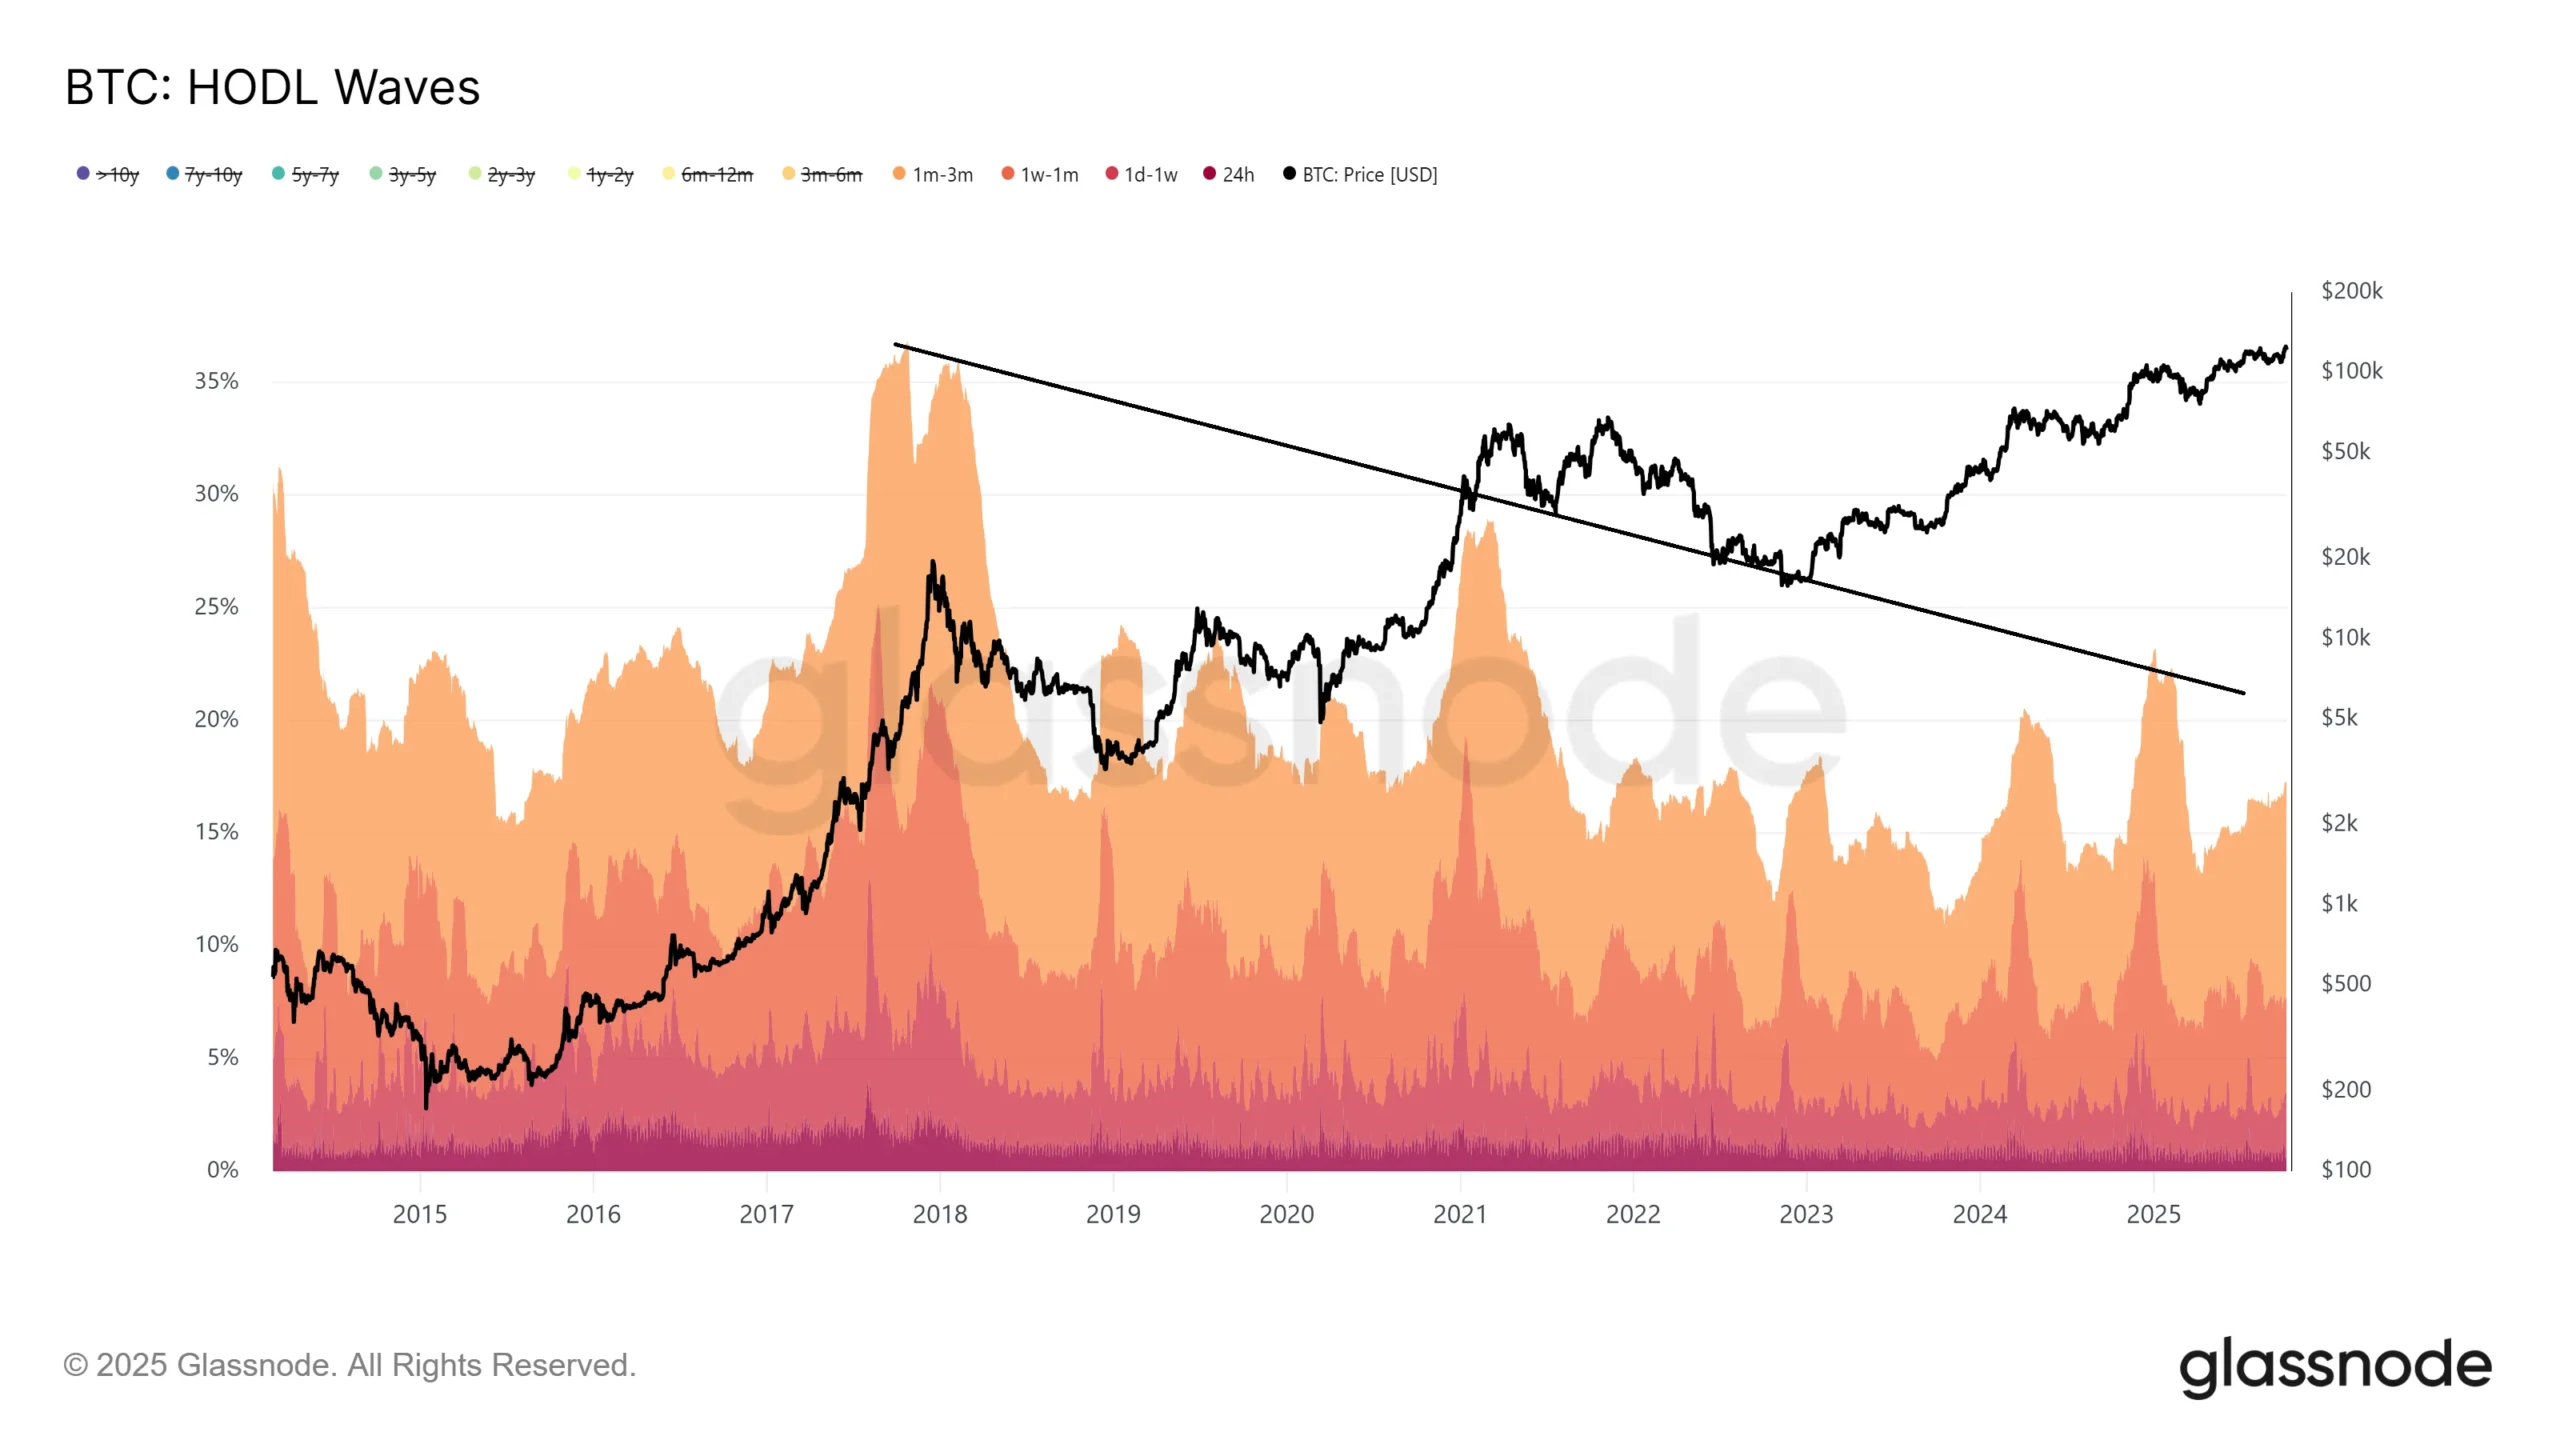
Historically, markets have topped when nearly half of all Bitcoin changed hands within three months, driven by short-term speculators who are more likely to sell during downturns.
In the two previous market cycle tops, the one—to three-year bands (black arrows) showed a noticeable decline, which indicates that long-term holders were selling the top.
Get These Top Crypto Casino Offers Now!
Sponsored
Disclosure
We sometimes use affiliate links in our content, when clicking on those we might receive a commission at no extra cost to you. By using this website you agree to our terms and conditions and privacy policy.
This was then followed by a swelling of the 3— to 12-month bands, which were the short-term holders left holding the bag from the top.
This has not happened yet in the current cycle. While there was a noticeable decline (indicated by the green icon), the bands swelled up almost immediately.
While a significant correction followed that period, the Bitcoin price has since hit two new all-time highs, and short-term holders have not dominated the market more than they did during December 2024.
Based on the previous cycle peaks, the current one is unlikely to end until short-term holder activity reaches a new peak.
Final Thoughts
The HODL Waves show that long-term conviction remains strong. The short-term frenzy hasn’t reached the levels seen at past cycle peaks.
This suggests the Bitcoin market may still have upside before entering its final stages.
The tipping point can happen when long-term holders start selling aggressively, and short-term traders crowd the market.
Disclaimer:
The information provided in this article is for informational purposes only. It is not intended to be, nor should it be construed as, financial advice. We do not make any warranties regarding the completeness, reliability, or accuracy of this information. All investments involve risk, and past performance does not guarantee future results. We recommend consulting a financial advisor before making any investment decisions.
Valdrin Tahiri is a cryptocurrency analyst and reporter at CCN, specializing in technical analysis with a focus on Elliott Wave theory, on-chain metrics, and fundamental research. He brings over seven years of experience in the crypto space as both a trader and writer.
He discovered cryptocurrencies in 2017 while earning his MSc in Financial Markets at the Barcelona School of Economics, which sparked a deep interest in blockchain and market dynamics. Since then, he’s contributed to top crypto outlets like BeInCrypto and CoinGape.
Valdrin also served as Community Manager of BeInCrypto’s Telegram group for three years, helping grow it into one of the largest crypto communities worldwide. His expertise in market structure and price patterns allows him to break down complex trends into clear, actionable insights.
He’s published thousands of articles covering altcoins, Bitcoin cycles, and macro trends.