BCH fights to reclaim the $524 Fibonacci level | Credit: Hameem Sarwar
Share
Key Takeaways
BCH has become stable and is finding support between the 0.236 and 0.382 Fib levels.
Indicators show signs of recovery, while an ascending floor of higher lows suggests accumulation
However, failure to hold the $486.30 support could trigger a deeper decline toward $424.
Bitcoin Cash (BCH) is attempting to stabilize around $501.68 after a 22% sell-off.
Technical indicators show signs of recovery as the MFI reading rose.
Bulls must reclaim the $535.11 resistance to negate recent technical damage
Bitcoin Cash (BCH) is quietly building a compelling bullish case.
While the broader crypto market has been grinding sideways, BCH has been forming a technical structure that many analysts believe points toward a return to the psychologically significant $600 level.
The setup is not built on hype. Instead, it is rooted in a combination of on-chain data, chart patterns, and macro tailwinds that align more clearly than they have in months.
Bitcoin Cash Bounces
The most immediate bullish signal is the support structure holding at lower levels. B
BCH has tested a critical demand zone multiple times and bounced on each occasion. That repeated defense of support is not coincidental.
Furthermore, it reflects genuine buying interest from larger participants who are accumulating positions before a potential move higher.
The 4-hour chart is also showing a higher lows pattern forming over recent weeks. Each successive low is higher than the last, creating an ascending floor beneath the price.
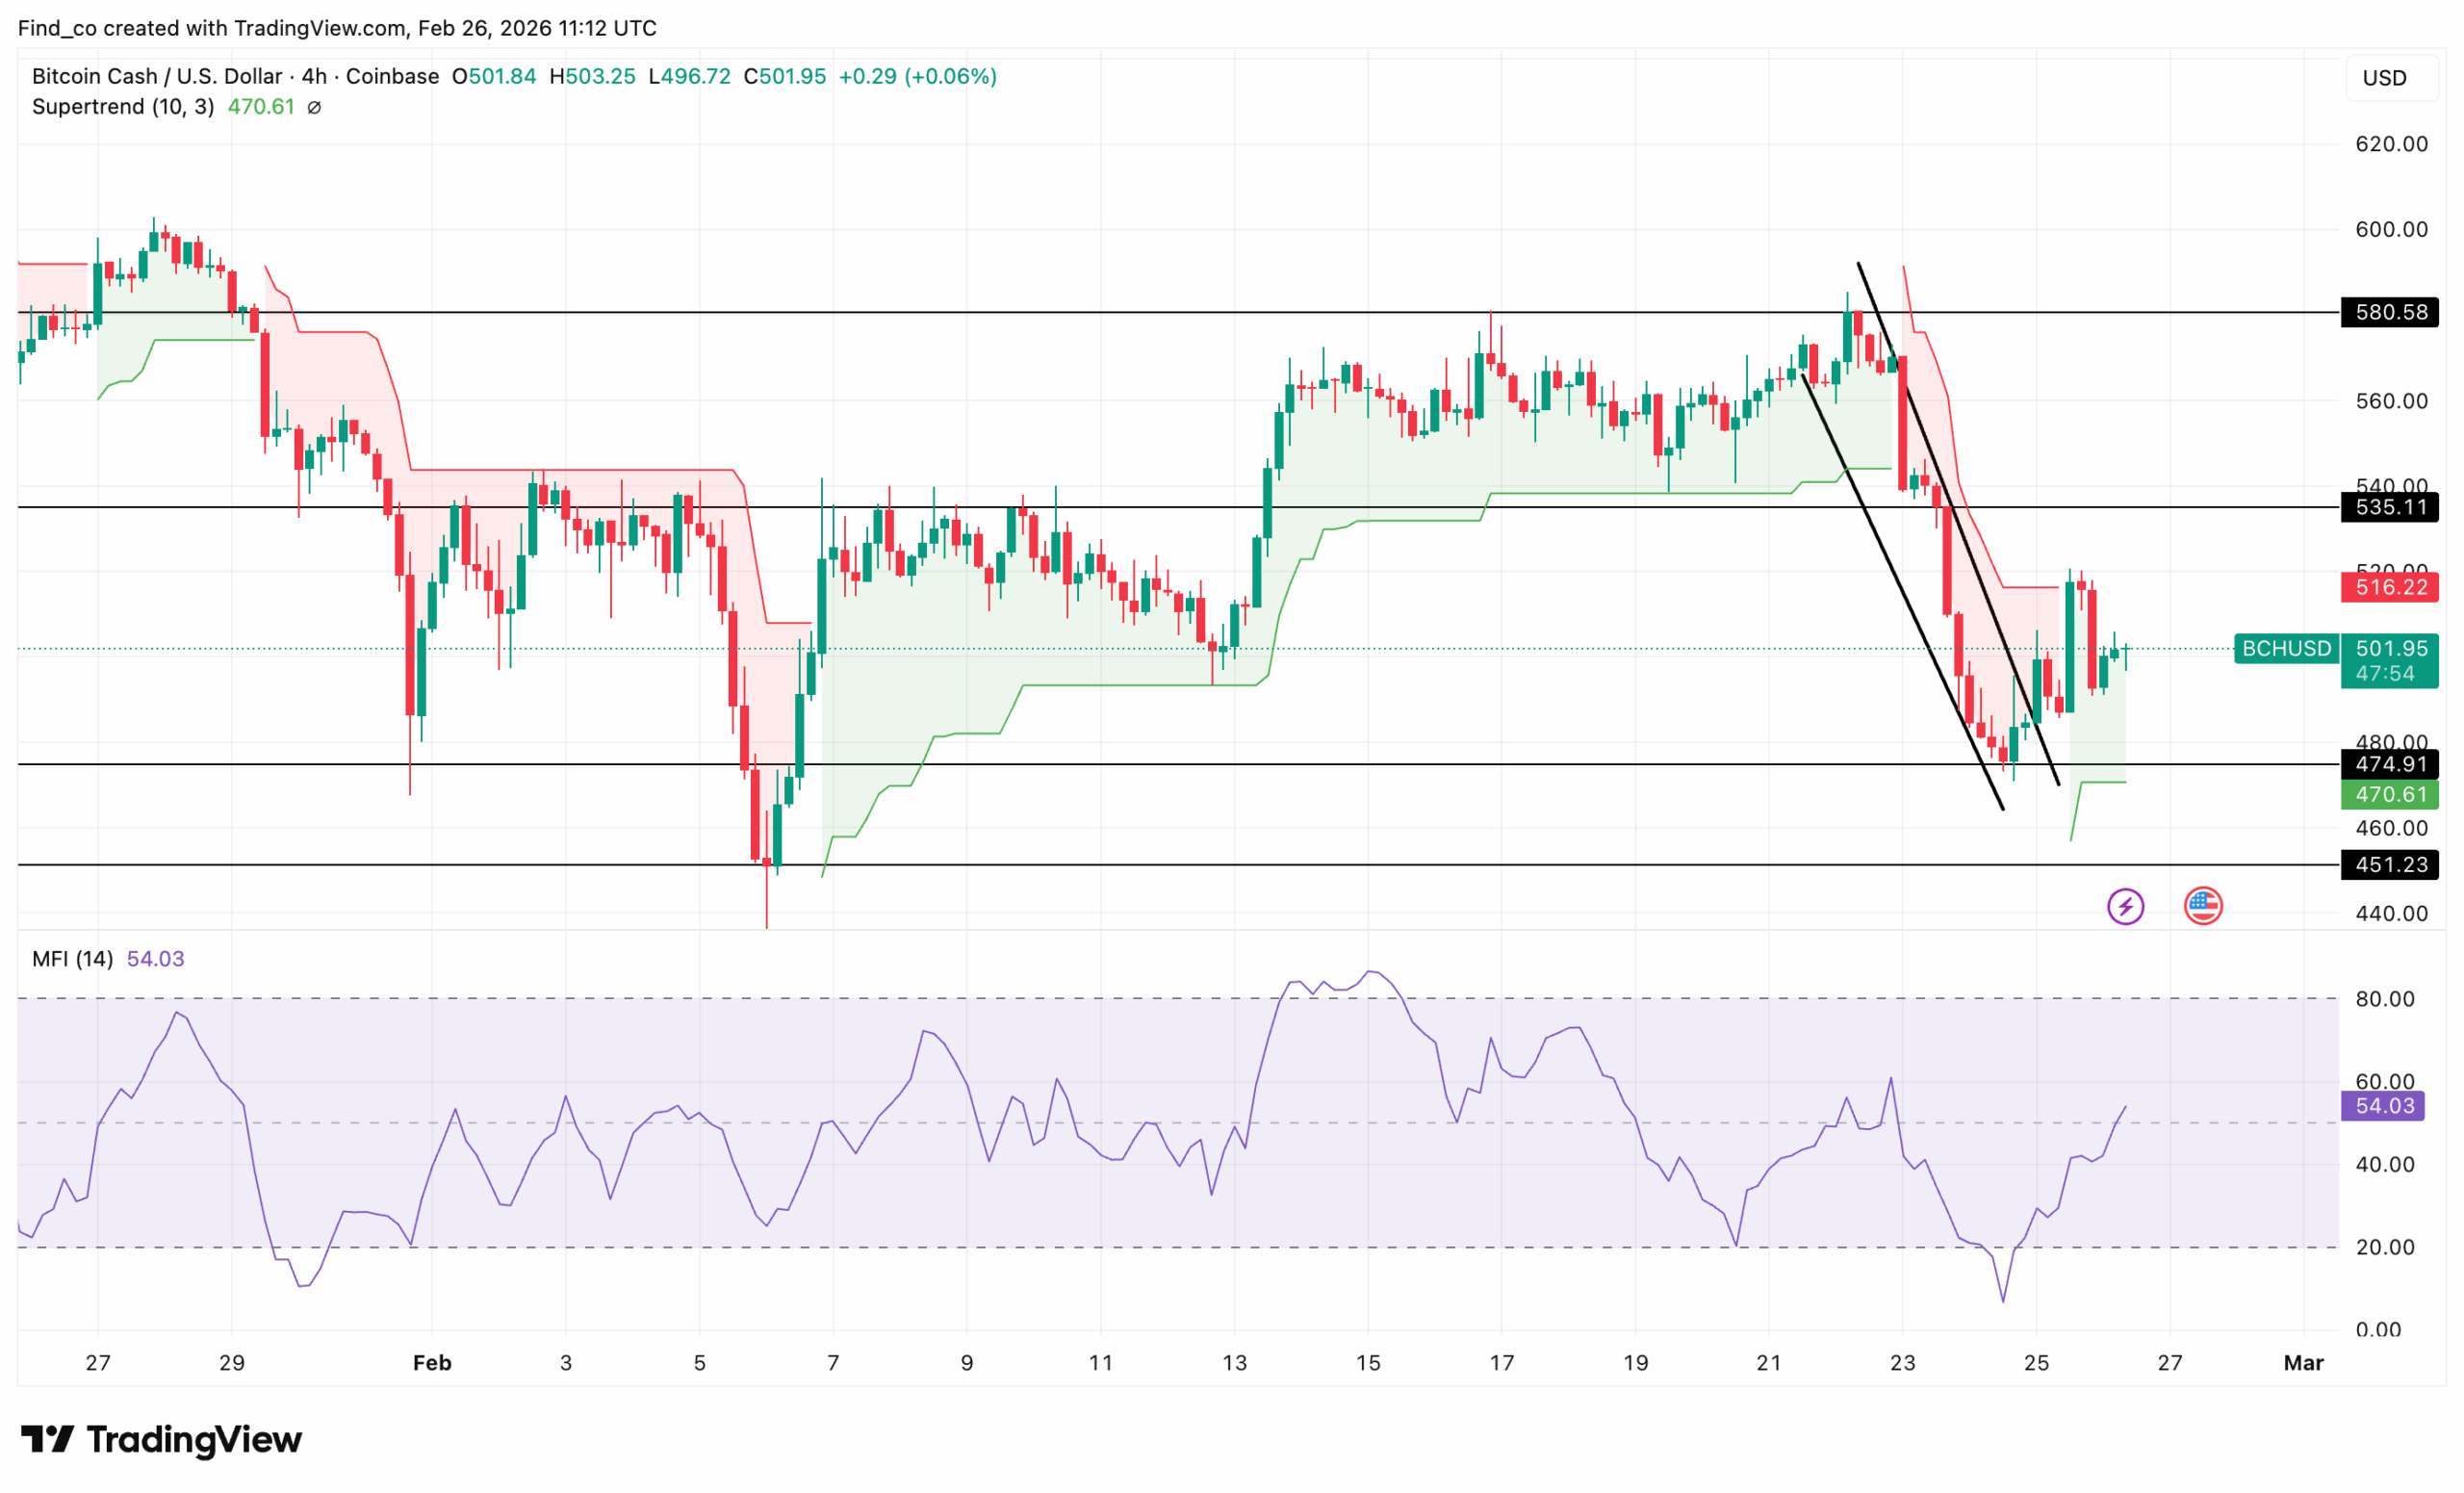
As seen below, the Bitcoin Cash price is stabilising after a breakdown. Due to that, it was able to breach $500 again,
Earlier on, the sell-off was aggressive. BCH price collapsed from $580.58 on Feb 22, breaking out of a descending channel and shedding over 22% in just a few candles.
The Supertrend (10, 3) flipped bearish during the drop and now sits at $470.61, below the current price. However, the green line is below the BCH price, indicating a positive development.
Key levels define the range. Immediate resistance sits at $516.22, then the more significant $535.11, a former support level that must be reclaimed to suggest the breakdown was a false move.
Above that, $580.58 is the target that would fully negate the recent damage.
The Money Flow Index (MFI) at 54.03 has recovered from near-zero oversold readings. This indicates that buying pressure has increased. If sustained, then Bitcoin Cash’s price will likely trade higher.
Coins Moves Away From BTC Dominance
BCH‘s relationship with Bitcoin is also working in its favor right now. As the original Bitcoin fork, Bitcoin Cash’s price tends to lag Bitcoin during initial BTC rallies.
But then, it outperforms aggressively once Bitcoin stabilizes.
Bitcoin is currently consolidating above $68,000. Consequently, that stability creates the conditions BCH needs to decouple and catch up.
Historically, these lag-and-catch-up cycles have produced some of BCH’s strongest short-term moves. As shown below, the BTC/BCH correlation coefficient is 0.68, indicating that the two assets do not always move together.
So, if Bitcoin’s price drops, it does not imply that BCH will also correct.
BCH Price Outlook: Trend Uncertain
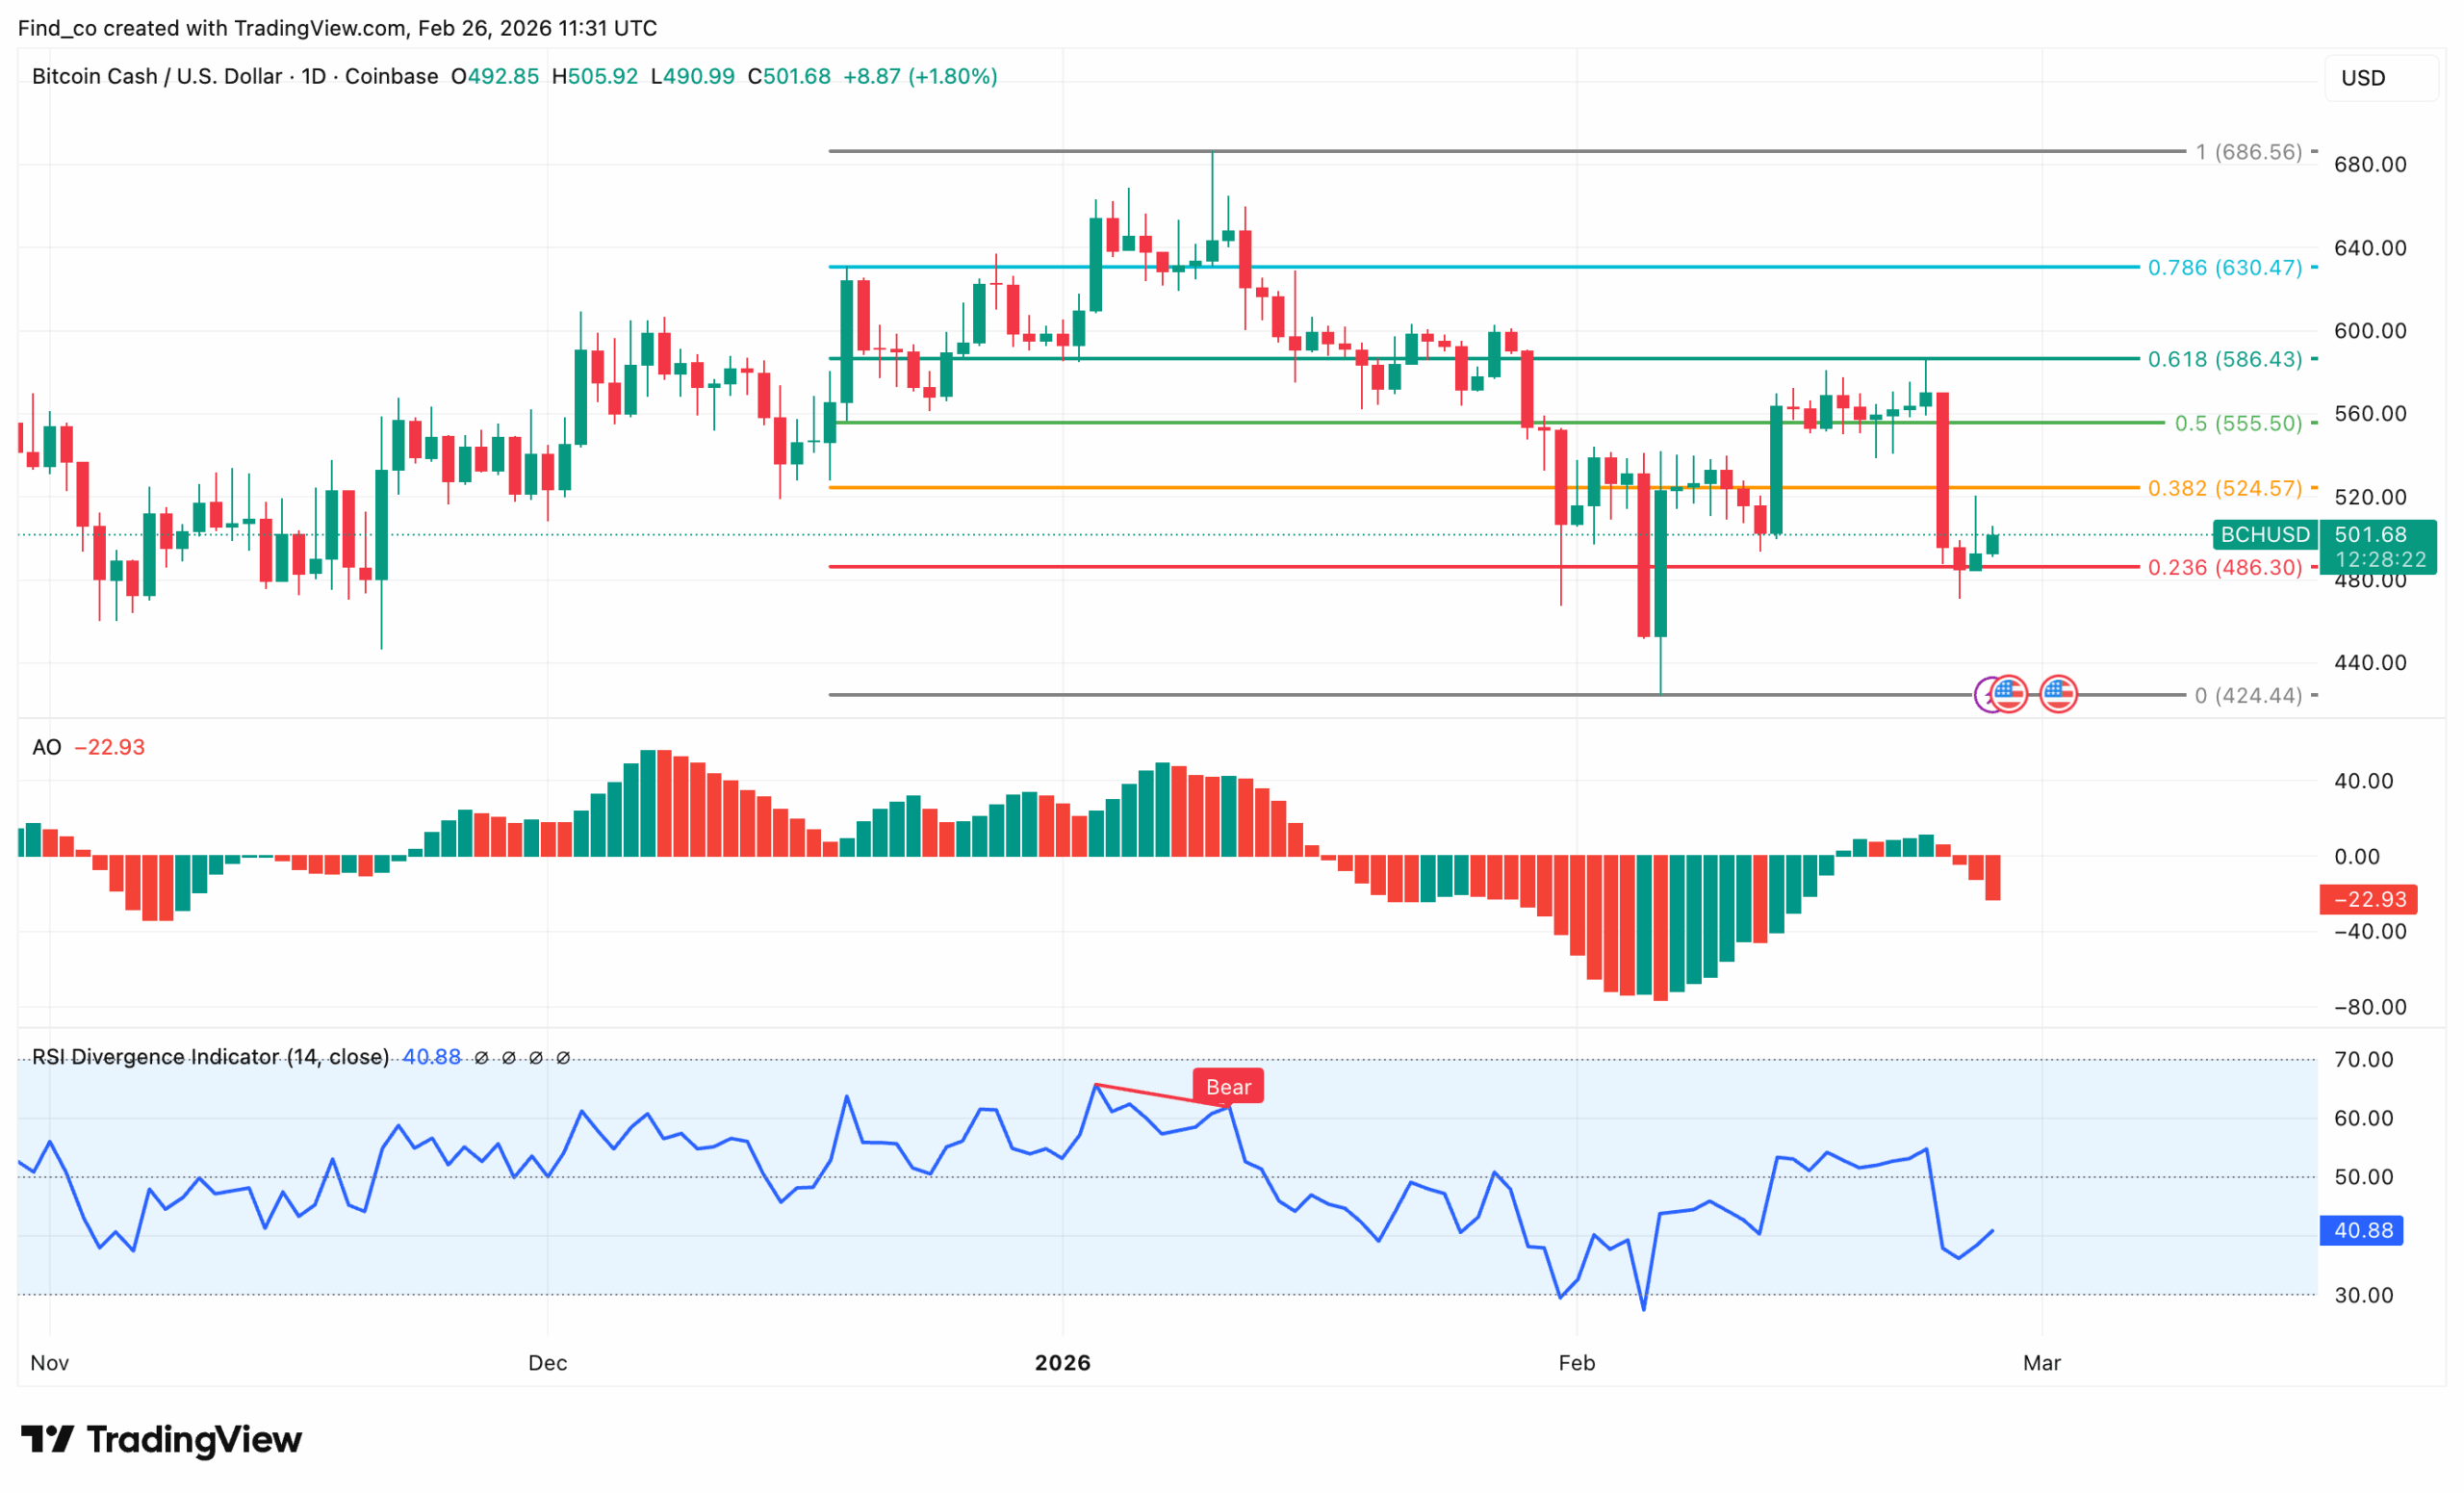
The daily chart puts Bitcoin Cash’s recent price drop in sharp context. BCH trades at $501.68, but it is sitting between two critical Fibonacci levels after one of its worst weeks in months.
Price has sliced through the 0.382 Fib ($524.57) and is now hovering just above 0.236 ($486.30).
The January candle that briefly pierced $424 and recovered was a warning shot. February has now retested that danger zone.
The bear divergence signal from December told the story early. RSI flagged weakening momentum as price pushed to new highs—and the subsequent selloff validated it.
Furthermore, the RSI now reads 40.88, below the midpoint and drifting lower. No bull divergence has formed yet.
The Awesome Oscillator (AO) at -22.93 is negative, and the histogram bars are shrinking but still red. Momentum is decelerating, not reversing.
Disclaimer:
The information provided in this article is for informational purposes only. It is not intended to be, nor should it be construed as, financial advice. We do not make any warranties regarding the completeness, reliability, or accuracy of this information. All investments involve risk, and past performance does not guarantee future results. We recommend consulting a financial advisor before making any investment decisions.
Victor Olanrewaju is a crypto analyst and reporter at CCN with deep roots in on-chain research and technical analysis. His crypto journey began in 2017, but it was the 2020 Uniswap airdrop that sparked a full-time pivot into the space.
With a foundation in copywriting, Victor honed his craft creating high-converting content for leading crypto brokers — most notably an XRP price prediction that ranked #1 on Google during the 2021 bull run.
He later joined AMBCrypto in 2022, where he combined storytelling with technical and on-chain analysis to cover key market narratives.
In 2024, he expanded his expertise at BeInCrypto, collaborating with analysts and using tools like Glassnode, Santiment, and IntoTheBlock to break down Bitcoin and altcoin trends.
At CCN, Victor covers the top cryptocurrencies, memecoins, macro shifts, blending real-time insights with deep-dive metrics.
He holds a Bachelor’s degree in Physics from the University of Ibadan, equipping him to simplify complex data for a wide audience. Follow his work or connect on LinkedIn or X.