BCH price trades within an ascending triangle with scenarios ahead. Breakout direction will provide further insight.
Share
Key Takeaways
BCH broke out of a multi-month descending wedge.
Price consolidates below major Fib resistance at $398.
An ascending triangle suggests that bullish continuation is likely.
Bitcoin Cash (BCH) is trading around $375 following a period of sideways consolidation after breaking out of a long-term downtrend.
Current price action suggests a battle between bullish continuation and short-term correction, with both scenarios hinging on the $398–$400 resistance zone.
BCH Price Analysis
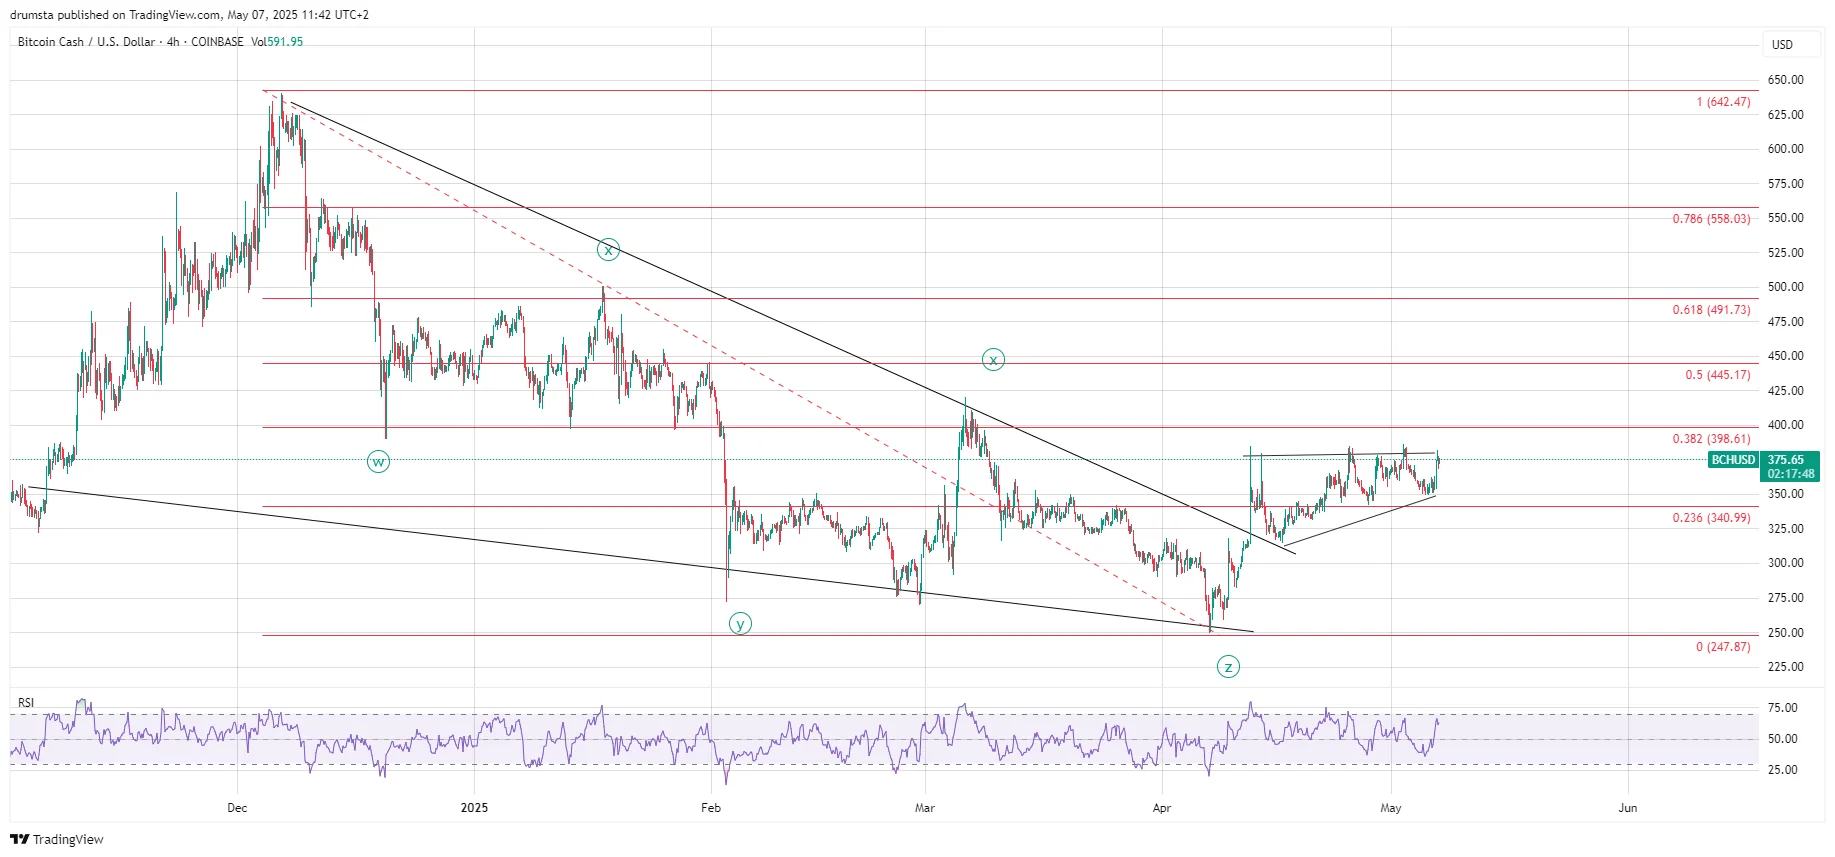
On the 4-hour chart, BCH completed a complex corrective pattern labeled WXYXZ, with the final Z wave bottoming out at $248 in early April.
This low was set at the bottom of a broad descending wedge structure formed since the $642 top in December 2024.
Since then, BCH has reversed strongly and broken out of the descending wedge in an impulsive five-wave fashion, suggesting a structural change in market dynamics.
The rally reached $380, below the 0.382 Fibonacci retracement level from the all-time high of $642.
This level has been a strong resistance barrier since mid-April, with multiple failed breakout attempts.
However, BCH consistently retesting this resistance zone with higher lows suggests mounting bullish pressure.
BCH has also respected the rising trendline from the April low, forming an ascending triangle pattern.
This pattern is typically bullish, especially after a breakout from a long-term bearish formation like a descending wedge.
The Relative Strength Index (RSI) on the 4H chart remains in neutral territory, but is getting close to an overbought zone, which is a sign of caution.
If the $380 resistance is broken with conviction, the next upside targets are $445 (0.5 Fib) and $491 (0.618 Fib).
However, failure to break through could result in a retest of lower support zones around $341 or even as low as $300 — a key horizontal and psychological level.
BCH Price Prediction
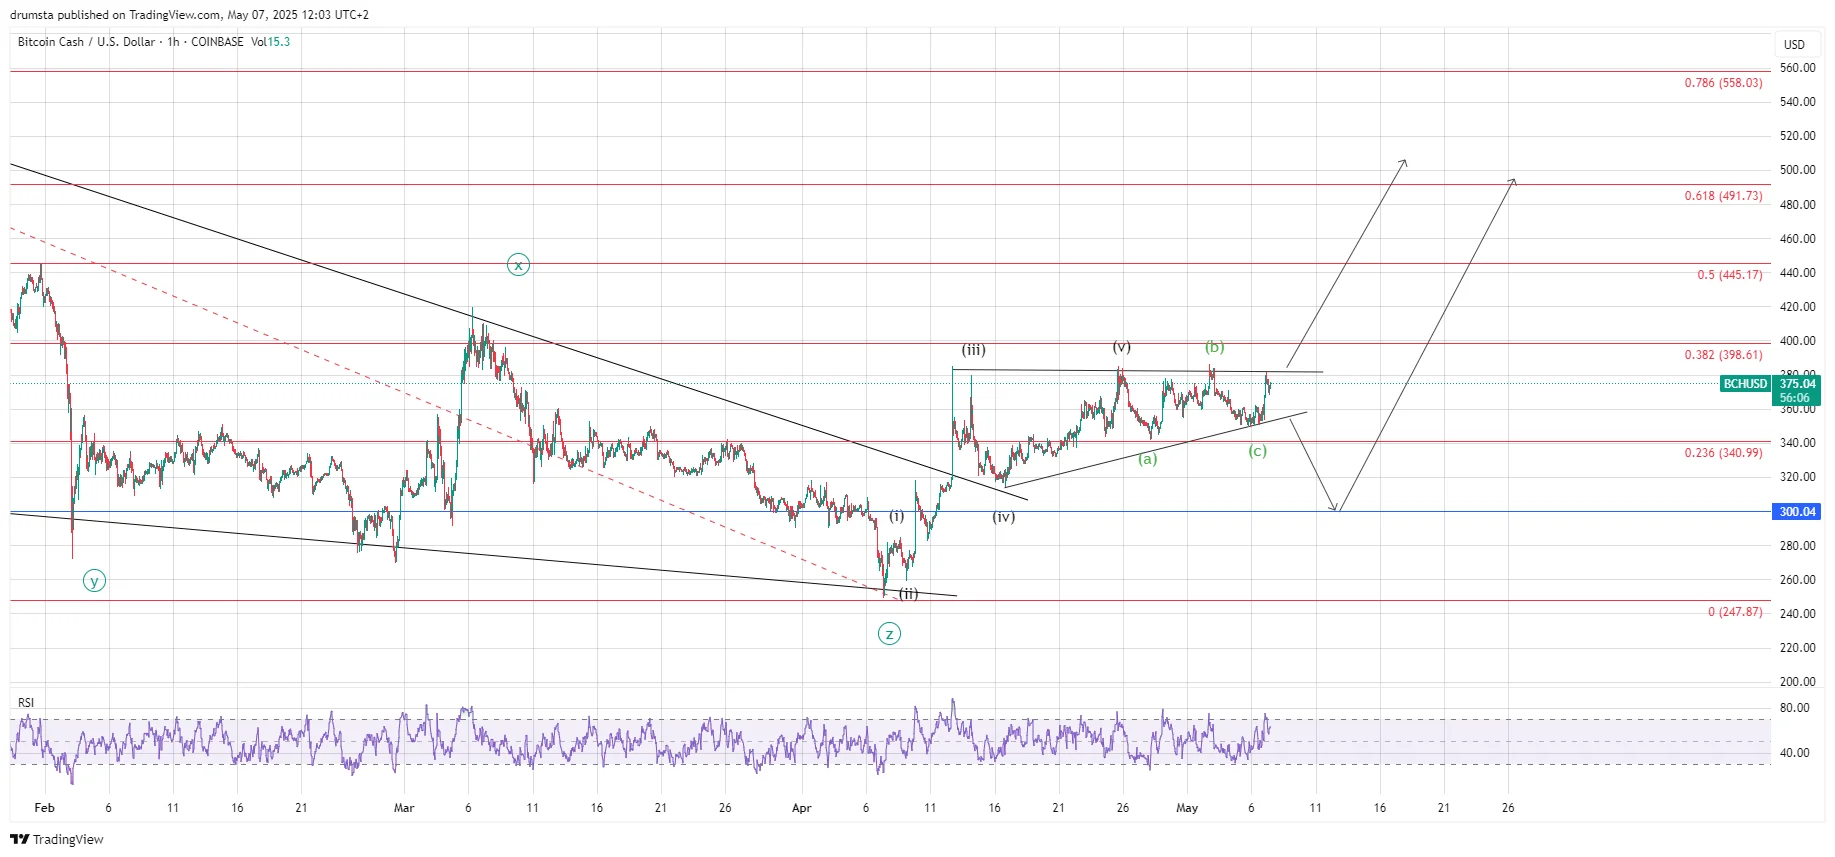
Zooming into the 1-hour chart, BCH shows a completed impulsive structure from the Z wave low, followed by a clean (a)-(b)-(c) corrective structure, terminating around $355.
This aligns with the 0.236 retracement and the lower boundary of the ascending triangle, adding confidence that wave (2) of a new bullish cycle may have just concluded.
Wave (c) appears to have ended with a bounce on the trendline and RSI divergence in the lower timeframes, suggesting that bullish momentum is returning.
Price is currently testing the previous resistance at $380, the line in the sand for short-term price action.
Two scenarios are in play:
Bullish breakout: If BCH breaks above $380 and holds, the structure supports a wave (3) rally targeting the $445 and $491 Fib levels.
This would represent a textbook impulsive continuation after a completed wave (2) correction.
Bearish rejection: If BCH is rejected again at this resistance, a drop back toward the $340–$300 zone is likely.
This would keep the overall bullish structure intact but delay the breakout and complete a larger corrective pattern before the next rally.
Overall, market structure, Elliott Wave count, and RSI support the bullish scenario, but confirmation must come from a breakout above $398 with follow-through.
Disclaimer:
The information provided in this article is for informational purposes only. It is not intended to be, nor should it be construed as, financial advice. We do not make any warranties regarding the completeness, reliability, or accuracy of this information. All investments involve risk, and past performance does not guarantee future results. We recommend consulting a financial advisor before making any investment decisions.
Nikola Lazic is a cryptocurrency analyst and investor working in the industry since 2017. He holds a bachelor's degree in Sociology, which enables him to better understand the psychology behind the crowd´s positioning. Consequently his preferred analytical tool is Elliott Wave Theory in combination with price action analysis.
Combining his experience in trading and investing with knowledge in content writing he strives to bring the most accurate and actionable information.