ADA price trades sideways, consolidating above key support. If it holds, the price could be ready for another upturn.
Share
Key Takeaways
ADA is consolidating above strong Fibonacci support.
A breakout above $0.70 could confirm wave (v) upward.
Breakdown below $0.655 risks deeper decline to $0.518.
Cardano (ADA) has been consolidating near a critical support zone following an impulsive advance and corrective decline.
The charts reveal potential for a continued rally or a bearish reversal, hinging on the current wave structure and Fibonacci levels.
This analysis interprets the 4-hour (higher time frame) and 1-hour (lower time frame) charts to evaluate ADA’s current trend and offer a balanced forecast.
ADA Price Analysis
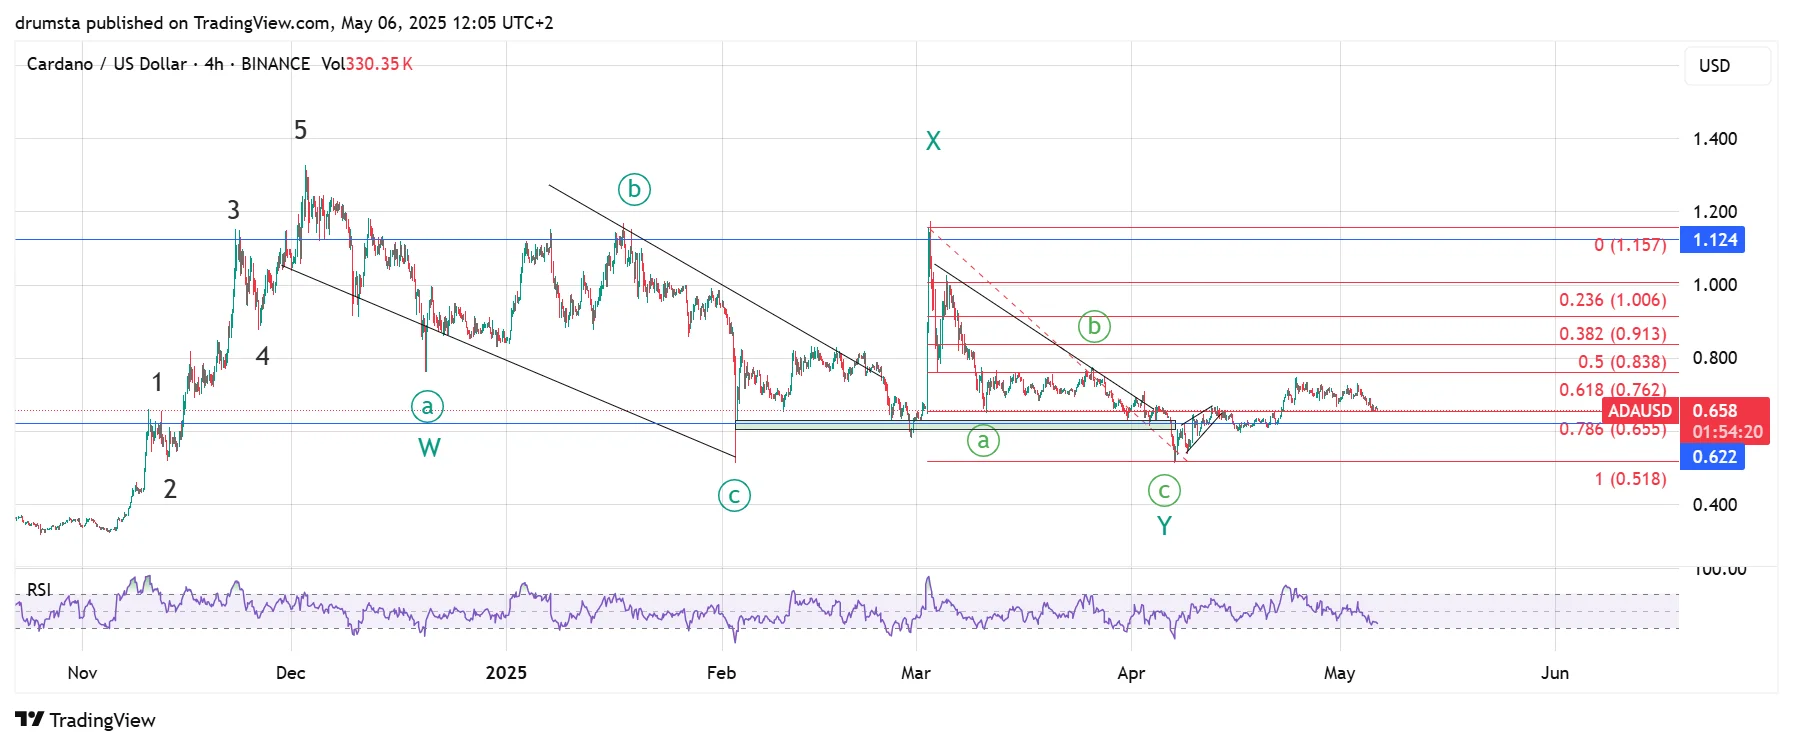
ADA has exhibited a clear five-wave impulsive structure, peaking near $1.30 in December, followed by an extended WXY correction.
The price retraced sharply to a low of $0.51 on April 7, likely concluding the correction count.
ADA is hovering just above this support after completing a large corrective structure.
The corrective waves exhibit a textbook descending wedge (Y-wave), which typically resolves to the upside.
The Relative Strength Index (RSI) on the 4H chart remains in neutral territory but is approaching the oversold zone, indicating potential for recovery.
From a structural standpoint, ADA seems to have completed a complex correction and could be transitioning into a new impulsive sequence.
However, failure to maintain support above $0.655 could invalidate the bullish structure and send ADA toward $0.622 or even the 1.0 Fib retracement at $0.518.
ADA Price Prediction
The 1H chart presents a zoomed-in view of ADA’s current consolidation.
After peaking around $0.76 (likely wave (iii)), the price corrected back into the 0.786 Fibonacci zone ($0.655), which aligns with the projected wave (iv) retracement.
The current structure shows potential completion of a falling wedge, often a bullish reversal pattern.
If this level holds and bullish momentum increases, ADA will likely break upwards into wave (v), targeting the 0.618 Fibonacci level at $0.762 or potentially the 0.5 retracement at $0.838.
This would represent a continuation of the larger impulsive trend, validating the recent pullback as a healthy correction.
RSI on the 1H chart is flattening below 50, suggesting the downtrend is losing strength.
A breakout above short-term resistance could confirm wave (v) initiation.
If the breakout is strong, ADA may rally toward $0.76–$0.83 before a larger correction.
Conversely, a breakdown below $0.655 support would invalidate this bullish setup.
ADA could then revisit $0.622 or slide deeper toward $0.518—a key support and 1.0 Fibonacci extension of the correction.
This would mean that the recovery seen from April 7 is a corrective ABC to the upside and a continued correction, likely being its second wave X out from the WXYXZ count.
The bullish scenario is slightly more probable given the current wave structure, though volume confirmation is essential.
Key Levels to Watch
Immediate Support: $0.655 – 0.786 Fib retracement and consolidation base.
Disclaimer:
The information provided in this article is for informational purposes only. It is not intended to be, nor should it be construed as, financial advice. We do not make any warranties regarding the completeness, reliability, or accuracy of this information. All investments involve risk, and past performance does not guarantee future results. We recommend consulting a financial advisor before making any investment decisions.
Nikola Lazic is a cryptocurrency analyst and investor working in the industry since 2017. He holds a bachelor's degree in Sociology, which enables him to better understand the psychology behind the crowd´s positioning. Consequently his preferred analytical tool is Elliott Wave Theory in combination with price action analysis.
Combining his experience in trading and investing with knowledge in content writing he strives to bring the most accurate and actionable information.