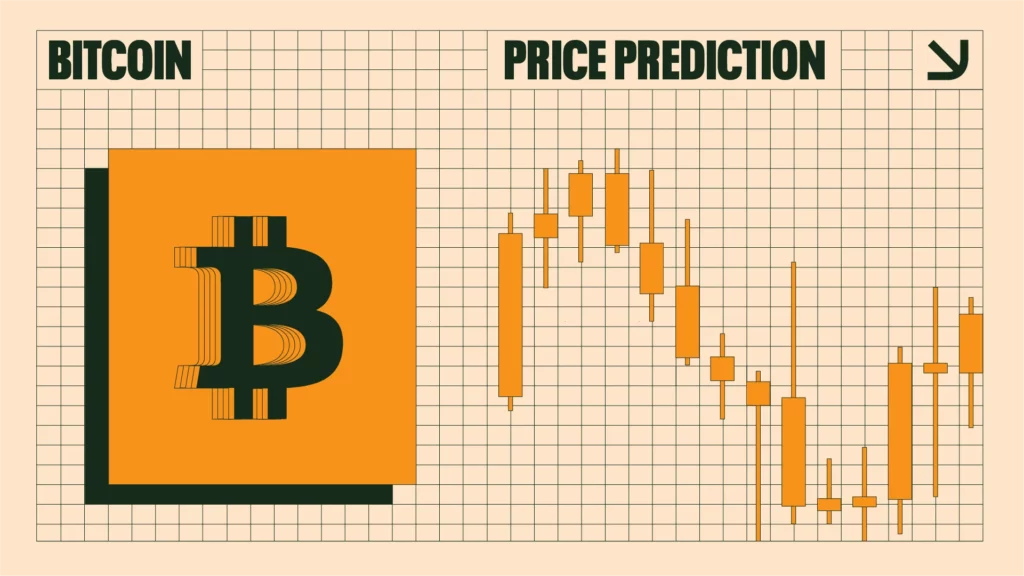
Bitcoin (BTC) has traded inside a horizontal range for three months.
The BTC price trades inside a short-term descending parallel channel.
Has Bitcoin reached its market cycle high or will it increase again?
Bitcoin’s price has increased over 600% since its upward movement started in December 2022.
The increase first led to an all-time high in March 2024, and after a long period of consolidation, another on in January 2025.
However, the price fell after reaching a Fibonacci resistance level suitable for the creation of a top. While the price is currently attempting to create a bottom and extend its increase, it is unclear if it will be successful.
Let’s look at the charts and see what lies ahead in 2025.
The BTC price has traded inside a horizontal range between $93,000 and $107,000 since December 2024. The price briefly moved above the range high when it reached its all-time high of $109,356 on Jan. 20, 2025 (black icon).
However, BTC could not sustain the increase and created a long upper wick (black icon). The price has fallen since and reached the range low on Feb. 3.
The reaction was similar to the resistance but in the other direction. Bitcoin created a bullish hammer candlestick, validating the range low as support (white icon).
Despite the significant bounce, the price has fallen since and retraced most of the gains from that day.
Despite the bounce, technical indicators are bearish. The Relative Strength Index (RSI) fell below 50 while the Moving Average Convergence/Divergence (MACD) is below 0. Both are considered bearish signs that suggest BTC is still mired in a correction.
As a result, the daily time frame does not confirm the future trend’s direction.
The four-hour time frame offers some hope for a bullish trend reversal. It shows that the Bitcoin price has traded inside a descending parallel channel since its all-time high. While it broke down below it on Feb. 3, this was a massive liquidation event in the crypto market, so the decline can be considered just a deviation (black circle).
In order for this positive outlook to remain, BTC has to maintain the $93,910-$95,700 support level. This area is created by a horizontal support area, the 0.618-0.786 Fibonacci retracement levels and the channel’s support trend line.
As long as the BTC price trades above it, the possibility of a bullish trend reversal and breakout still remains. However, if the price breaks down, it will confirm that the trend is bearish, leading to a breakdown below $90,000.
Possible BTC Price Bottom
The wave count reiterates the importance of the $93,910-$95,700 support level. It seems that the price has completed a five-wave increase starteing on Jan. 13.
If so, it also finished an A-B-C correction afterward where waves A:C have a 1:1.61 ratio.
In order for the bullish count to remain valid, the price has to created a higher low and begin an upward movement near $94,000. A decline below the wave C low of $91,257 (dashed, red) will be a soft invalidation of the count, while falling below the impulses beginning at $89,185 will confirm the correction has started.
In the long-term, this will likely determine if the BTC price will complete another upward movement, or if the market cycle has ended. Since December 2023, Bitcoin’s price has increased inside a five-wave upward movement (red) and is currently in wave five. The sub-wave count is in white, and it is unclear if the increase is over or not.
If BTC holds its short-term lows, it will suggest the local bottom is in and wave five will extend toward $142,020-$155,326. The target is created by giving wave five 1.61 times the length of waves one and three combined and by the 2.61 external Fibonacci retracement (white) of the previous decline.
Therefore, the Bitcoin movement is February will be critical. A bottom formation that leads to a breakout from the wedge will mean the bottom is in and the fifth and final wave will extend to a new BTC all-time high. Alternatively, a breakdown will confirm the bear market has started.
Is the Bitcoin Cycle Over
The Bitcoin price has been increasing since December 2022 and is finally showing signs of a market cycle top. The price is definitely in its fifth and final wave, but it is unclear if the wave has ended or if it will extend.
Whether BTC holds the $93,910-$95,700 support level or breaks down will be key in determining the future trend’s direction.
Disclaimer:
The information provided in this article is for informational purposes only. It is not intended to be, nor should it be construed as, financial advice. We do not make any warranties regarding the completeness, reliability, or accuracy of this information. All investments involve risk, and past performance does not guarantee future results. We recommend consulting a financial advisor before making any investment decisions.
Valdrin Tahiri is a cryptocurrency analyst and reporter at CCN, specializing in technical analysis with a focus on Elliott Wave theory, on-chain metrics, and fundamental research. He brings over seven years of experience in the crypto space as both a trader and writer.
He discovered cryptocurrencies in 2017 while earning his MSc in Financial Markets at the Barcelona School of Economics, which sparked a deep interest in blockchain and market dynamics. Since then, he’s contributed to top crypto outlets like BeInCrypto and CoinGape.
Valdrin also served as Community Manager of BeInCrypto’s Telegram group for three years, helping grow it into one of the largest crypto communities worldwide. His expertise in market structure and price patterns allows him to break down complex trends into clear, actionable insights.
He’s published thousands of articles covering altcoins, Bitcoin cycles, and macro trends.