Here is why ARIA may fail to recover | Credit: Hameem Sarwar
Share
Key Takeaways
ARIA’s price has crashed about 90% in a rapid breakdown, losing key support levels.
Negative sentiment, heavy distribution, and underwater holders have created resistance.
While a short-term ARIA bounce is possible, the overall structure remains bearish.
ARIA, the native token of the Aria.AI project, has crashed—leaving investors little time to react.
In just a few days, the price has plunged roughly 90% from its all-time high, wiping out a large share of its market value in the process.
The move hasn’t been gradual. On lower timeframes, the chart shows a sharp breakdown, with ARIA slicing through multiple support levels without any meaningful bounce.
While some traders hope for a quick rebound, current indicators suggest it is unlikely.
ARIA Breaks Down With No Support
ARIA’s price didn’t just drift lower—it broke down structurally.
Key support levels gave way one after another, with little evidence of buyers stepping in to stabilize the move.
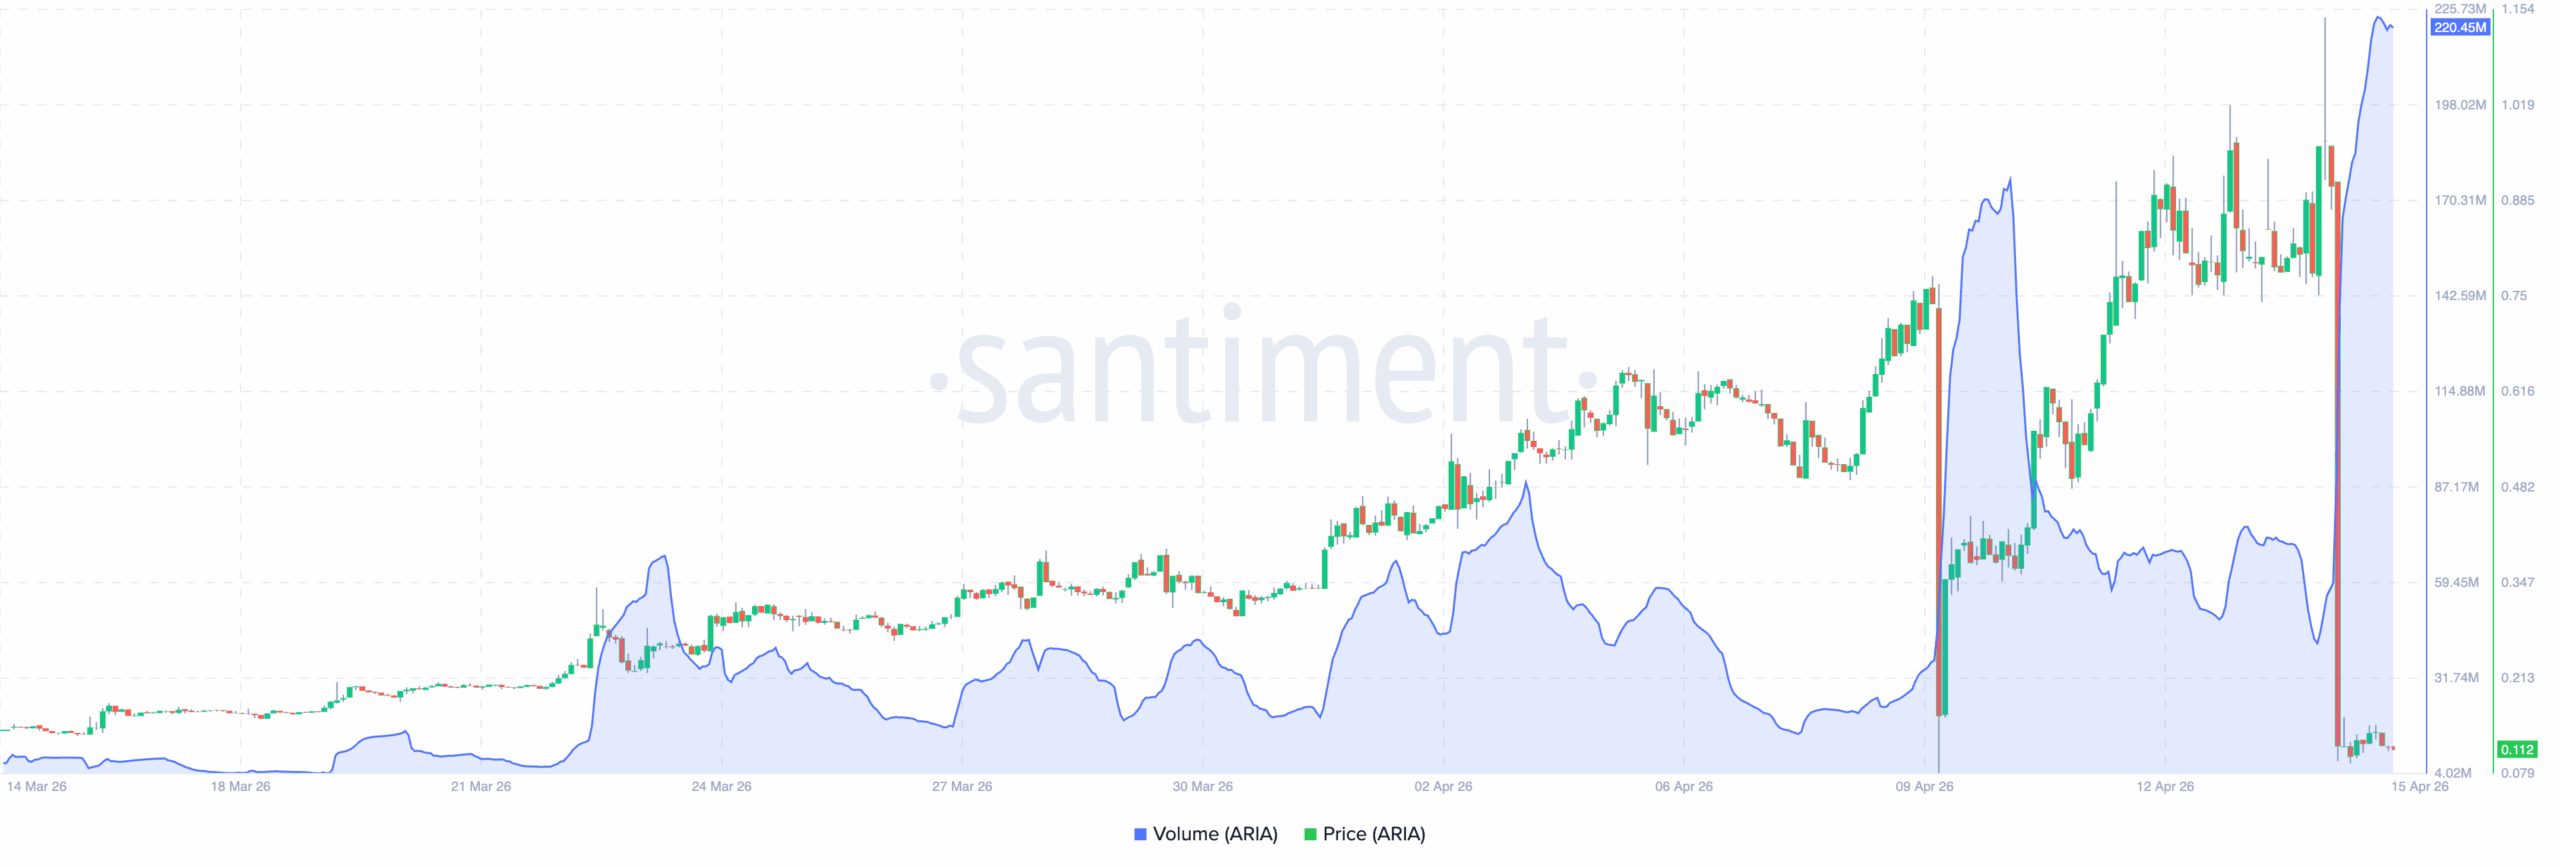
On-chain data shows that not long ago, ARIA had strong momentum, pushing past $0.96 in a sharp rally.
Around April 9, trading volume surged, and the price moved almost vertically—typically a sign of strong bullish momentum.
Get These Top Crypto Casino Offers Now!
Sponsored
Disclosure
We sometimes use affiliate links in our content, when clicking on those we might receive a commission at no extra cost to you. By using this website you agree to our terms and conditions and privacy policy.
But that surge didn’t hold. The spike in volume coincided with a sharp downside wick, pointing to heavy selling pressure at higher levels.
Since then, volume has stayed elevated, yet price has struggled to break higher. That kind of divergence usually signals distribution rather than accumulation.
Many holders are now deep in the red, and that shift in positioning affects what comes next.
Instead of waiting for higher prices, some may look to exit on any bounce, just to recover part of their losses.
That creates overhead resistance, making any sustained recovery harder to achieve.
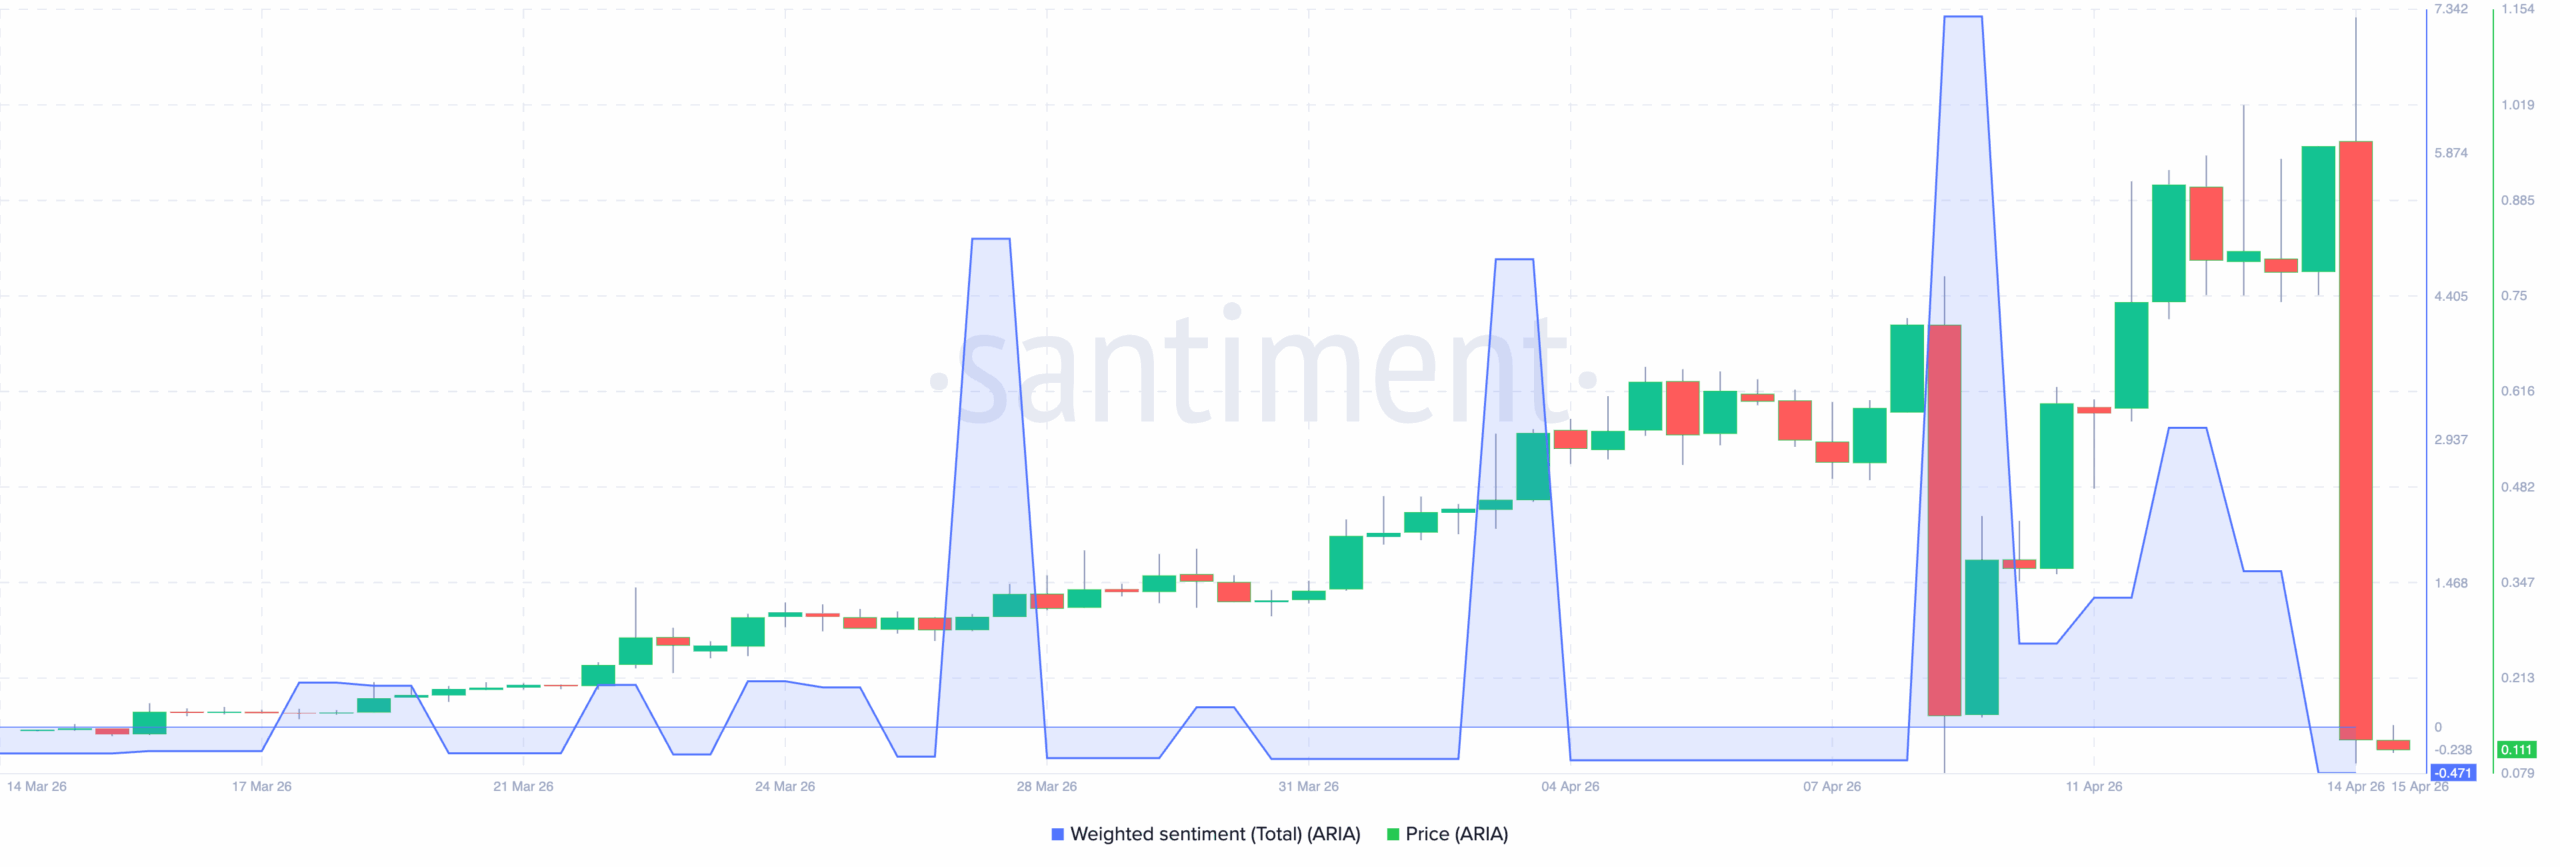
Besides that, the Weighted Sentiment also supports this bias. According to Santiment, the metric has entered the negative zone, signaling rising pessimism about Aria.AI.
Since ARIA’s price has also fallen amid this perception, it implies that demand might not come in anytime soon.
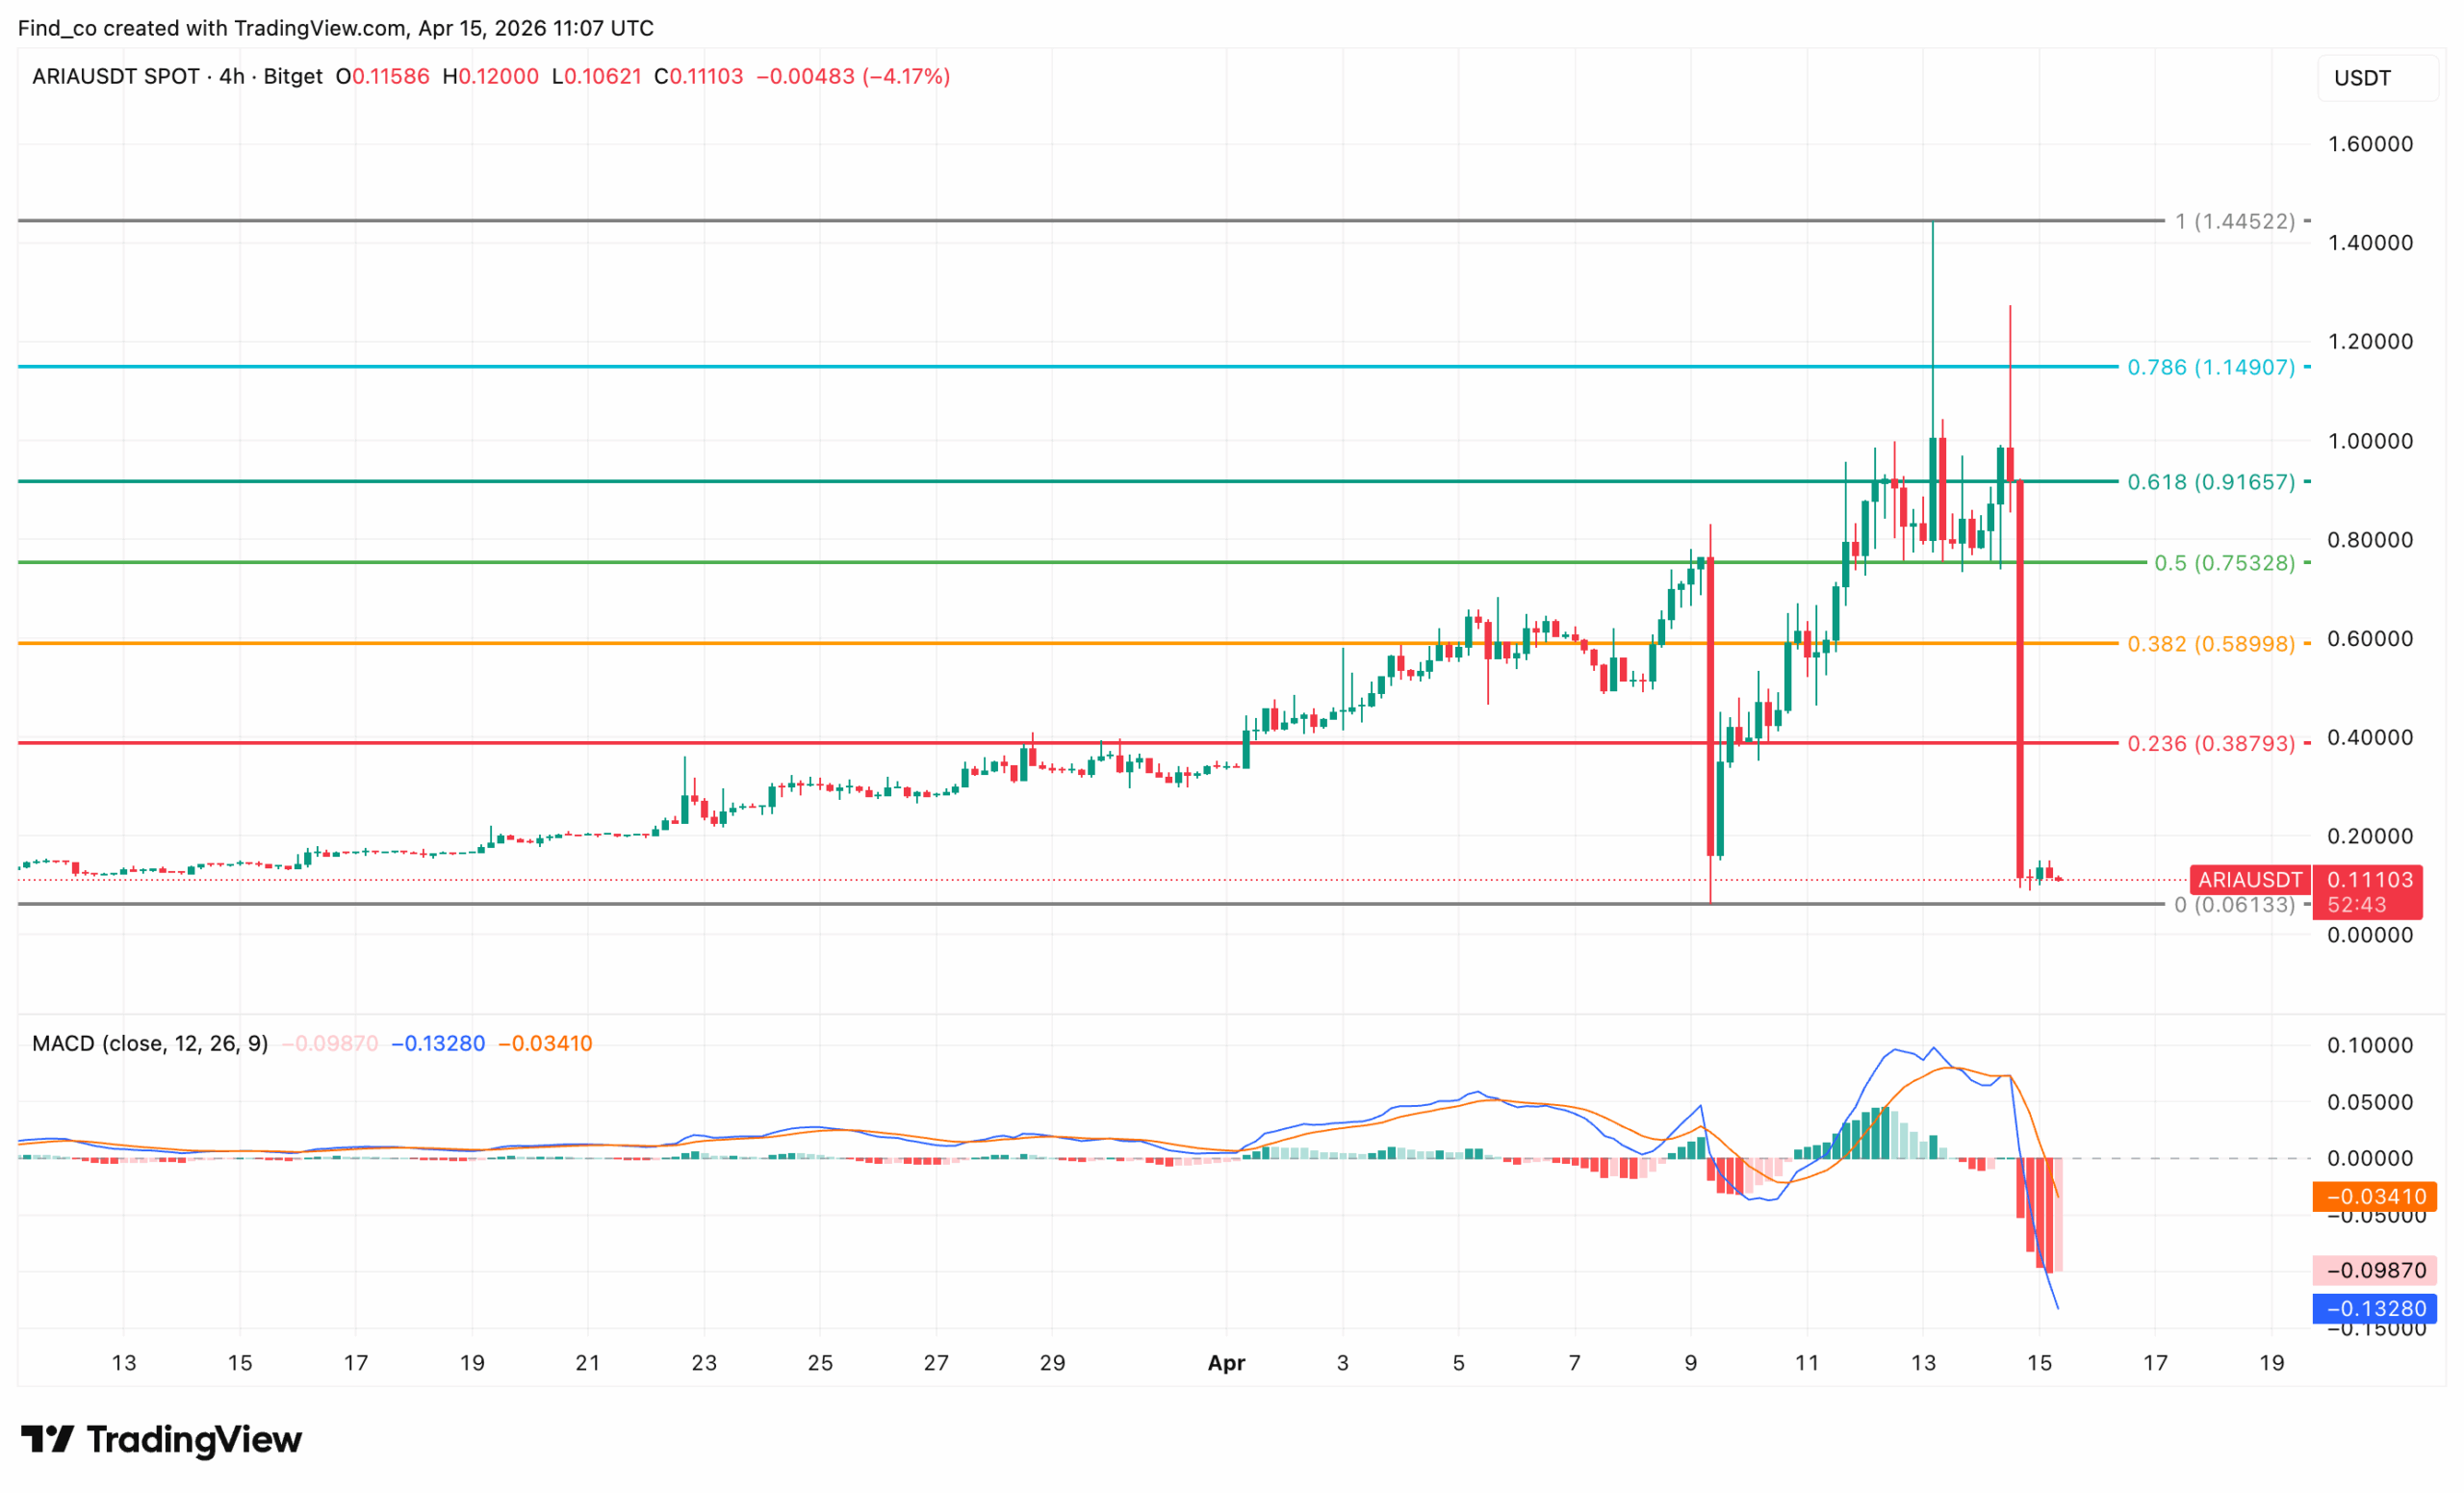
However, repeated upper wicks signaled supply absorption and weakening momentum.
Then, a single sell-off triggered a full breakdown.
At the time of writing, the cryptocurrency has dropped below the 0.5, 0.382, and 0.236 Fibonacci resistance with no reaction, indicating forced selling and likely liquidations.
Meanwhile, the Moving Average Convergence Divergence (MACD) has formed a bearish crossover.
The crossover has accelerated, with histogram bars expanding to the downside, while confirming strong negative momentum.
After the drop, the token has stabilized near range lows around $0.10.
However, the bounce is weak and lacks follow-through, suggesting limited demand so far.
Disclaimer:
The information provided in this article is for informational purposes only. It is not intended to be, nor should it be construed as, financial advice. We do not make any warranties regarding the completeness, reliability, or accuracy of this information. All investments involve risk, and past performance does not guarantee future results. We recommend consulting a financial advisor before making any investment decisions.
Victor Olanrewaju is a crypto analyst and reporter at CCN with deep roots in on-chain research and technical analysis. His crypto journey began in 2017, but it was the 2020 Uniswap airdrop that sparked a full-time pivot into the space.
With a foundation in copywriting, Victor honed his craft creating high-converting content for leading crypto brokers — most notably an XRP price prediction that ranked #1 on Google during the 2021 bull run.
He later joined AMBCrypto in 2022, where he combined storytelling with technical and on-chain analysis to cover key market narratives.
In 2024, he expanded his expertise at BeInCrypto, collaborating with analysts and using tools like Glassnode, Santiment, and IntoTheBlock to break down Bitcoin and altcoin trends.
At CCN, Victor covers the top cryptocurrencies, memecoins, macro shifts, blending real-time insights with deep-dive metrics.
He holds a Bachelor’s degree in Physics from the University of Ibadan, equipping him to simplify complex data for a wide audience. Follow his work or connect on LinkedIn or X.