Has Anything Changed Regarding Altcoin Season? | Credit: Hameem Sarwar
Share
Key Takeaways
The Bitcoin Dominance Rate (BTCD) has fallen since June.
Altcoins are close to reaching a new all-time high after four years.
Small-cap altcoins could finally take the spotlight with a massive breakout.
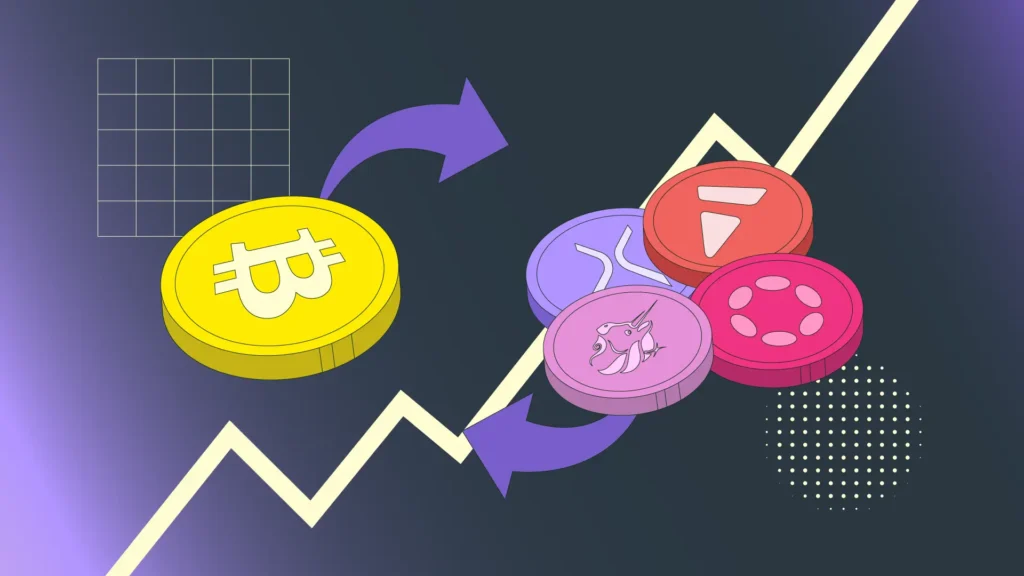
Bitcoin dominance is slipping, and the tides are finally shifting toward small-cap altcoins for the first time this cycle.
The recent breakdown in BTCD signals that altcoins are gearing up for a powerful run, with some already pushing toward new highs.
Small-cap altcoins, in particular, are showing signs that they could lead the next explosive cycle phase.
Bitcoin Dominance Crash
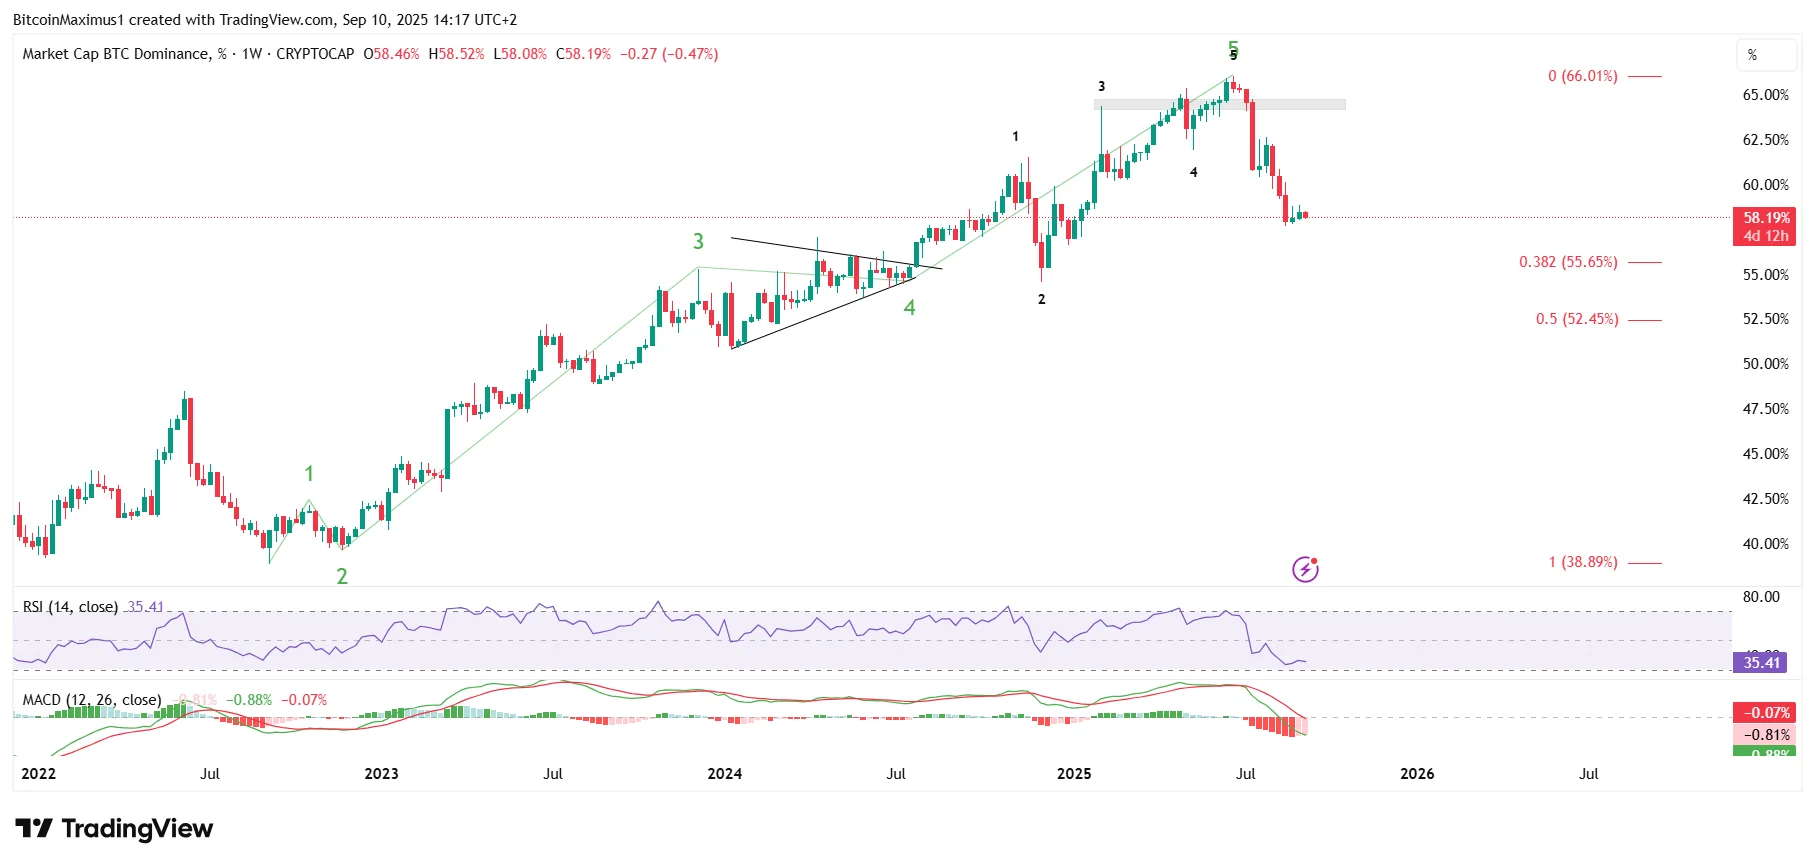
BTCD climbed in a steady five-wave rally between July 2022 and June 2025, delivering one of the strongest stretches of Bitcoin outperformance in recent history.
Get These Top Crypto Casino Offers Now!
Sponsored
Disclosure
We sometimes use affiliate links in our content, when clicking on those we might receive a commission at no extra cost to you. By using this website you agree to our terms and conditions and privacy policy.
That trend broke sharply in June 2025, when BTCD fell from 66.03% to 57.69% — the steepest drop of the cycle and the clearest sign of an altcoin season, though still a relatively modest one compared with 2021.
Even after the decline, BTCD has not yet tested the 0.382 Fibonacci retracement level at 55.65%, often seen as the first major support that could spark a reversal.
Based on price action alone, the downtrend appears unfinished, with another leg lower still likely.
Momentum indicators confirm this, since the RSI is well below 50 while the Moving Average Convergence/Divergence (MACD) is negative.
Neither the price action nor the trend reversal has shown any signs of a bullish trend reversal, pointing to a bearish trend.
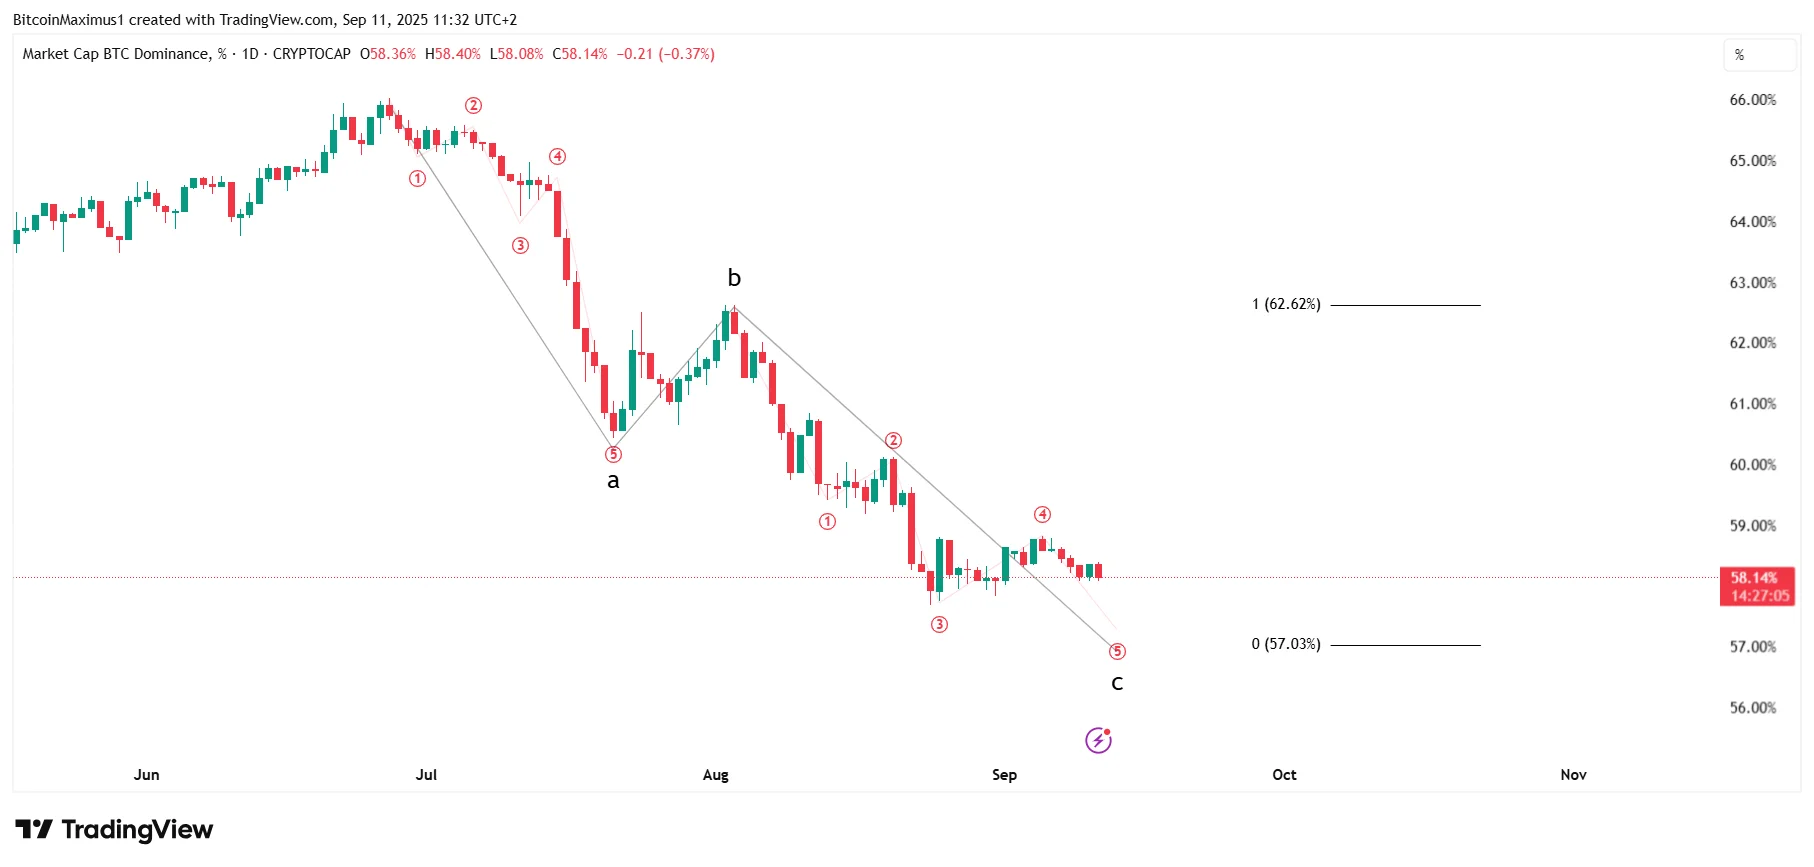
However, the short-term count suggests that a bottom is close. According to the count, BTCD is in wave C of an A-B-C correction (black) that started with the cycle high.
Giving waves A and C the same length leads to a low of 57%, meaning that another dip will complete the correction.
The sub-wave count aligns with the reading, confirming that the fifth and final sub-wave will be the final one in the correction.
Hence, the combination of the weekly and daily BTCD charts suggests a local bottom could be reached at 57%.
Has the Rally Started
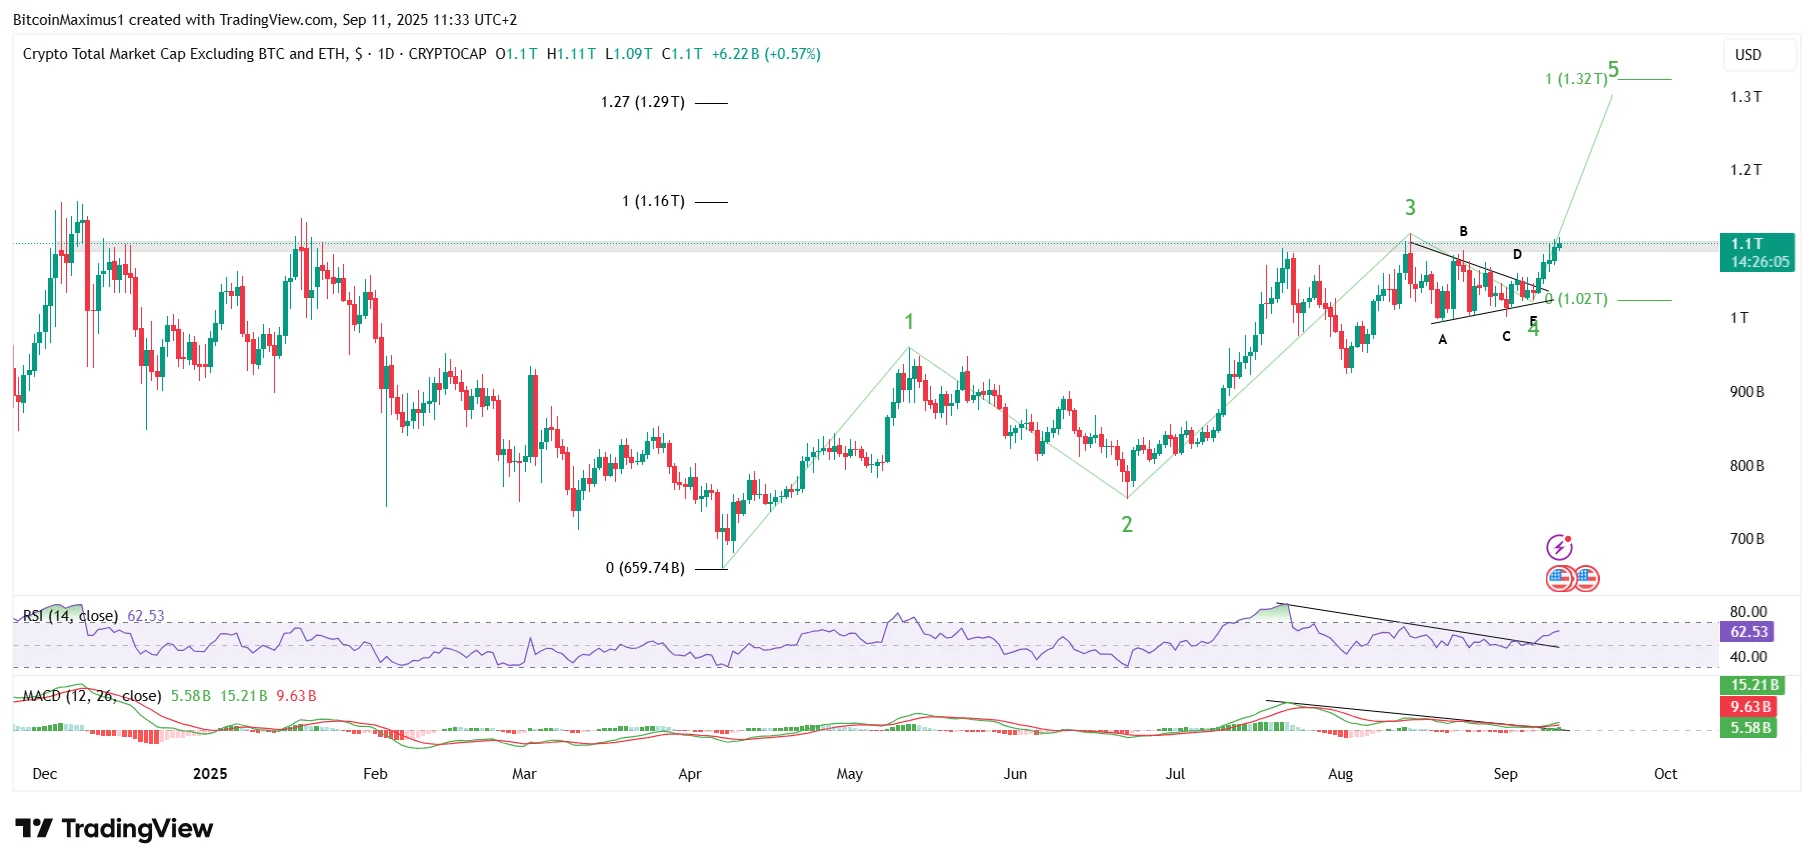
The Altcoin Market Cap, excluding Ethereum, is extremely bullish, suggesting that new highs are likely in 2025.
Altcoins are likely in the fifth and final waves of their upward movements, which could end at a new all-time high between $1.29 trillion and $1.32 trillion.
Wave four created a symmetrical triangle, confirming that this is the correct count.
At press time, the ALTCAP was attempting to break out from the $1.10 trillion resistance area, which is the final one before a new all-time high.
Doing so will pave the way to new highs for altcoins, marking the final portion of the altcoin season.
According to the charts, altcoins will rally for at least one more month before a local top becomes a possibility.
Small Cap Altcoins Break Out
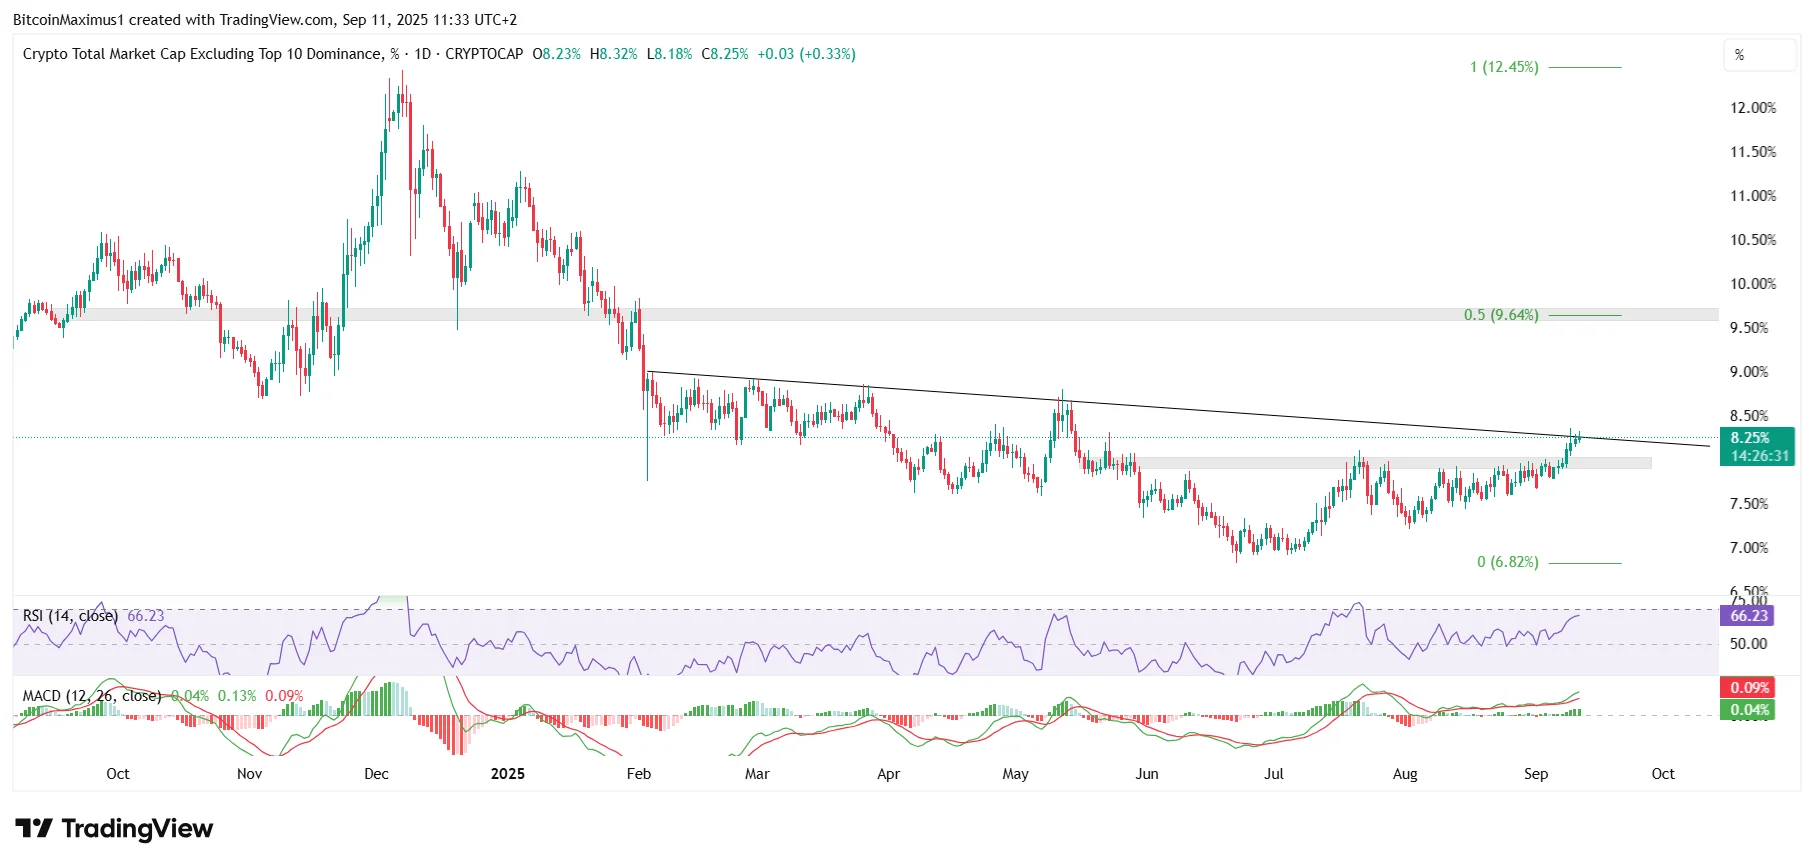
The final chart highlights just how bullish conditions are becoming for smaller altcoins.
Throughout this cycle, the dominance of altcoins outside the top 10 has steadily declined.
However, momentum appears to be shifting, with signs of a trend reversal emerging.
After bouncing off their June 22 lows at 6.82%, small-cap altcoins have managed to reclaim the key 8% horizontal resistance level — an early signal that they could be regaining ground in the market.
Now, they are attempting to break out from a diagonal resistance trend line that has existed since the start of the year.
If that happens, one of the biggest increases of this cycle could occur, taking small-cap altcoins to the 0.5 Fibonacci retracement resistance at $9.64%.
Small-cap altcoins have momentum on their side, as seen by the increasing RSI and MACD, which are both pushing upward.
Altcoin Season Resumes
With Bitcoin dominance breaking down, the stage is set for altcoins to shine in the coming weeks.
Market structure and momentum indicators alike suggest that both large and small caps still have room to rally before a meaningful top forms.
If this setup plays out, altcoin season could soon deliver one of the strongest breakouts of 2025.
Disclaimer:
The information provided in this article is for informational purposes only. It is not intended to be, nor should it be construed as, financial advice. We do not make any warranties regarding the completeness, reliability, or accuracy of this information. All investments involve risk, and past performance does not guarantee future results. We recommend consulting a financial advisor before making any investment decisions.
Valdrin Tahiri is a cryptocurrency analyst and reporter at CCN, specializing in technical analysis with a focus on Elliott Wave theory, on-chain metrics, and fundamental research. He brings over seven years of experience in the crypto space as both a trader and writer.
He discovered cryptocurrencies in 2017 while earning his MSc in Financial Markets at the Barcelona School of Economics, which sparked a deep interest in blockchain and market dynamics. Since then, he’s contributed to top crypto outlets like BeInCrypto and CoinGape.
Valdrin also served as Community Manager of BeInCrypto’s Telegram group for three years, helping grow it into one of the largest crypto communities worldwide. His expertise in market structure and price patterns allows him to break down complex trends into clear, actionable insights.
He’s published thousands of articles covering altcoins, Bitcoin cycles, and macro trends.