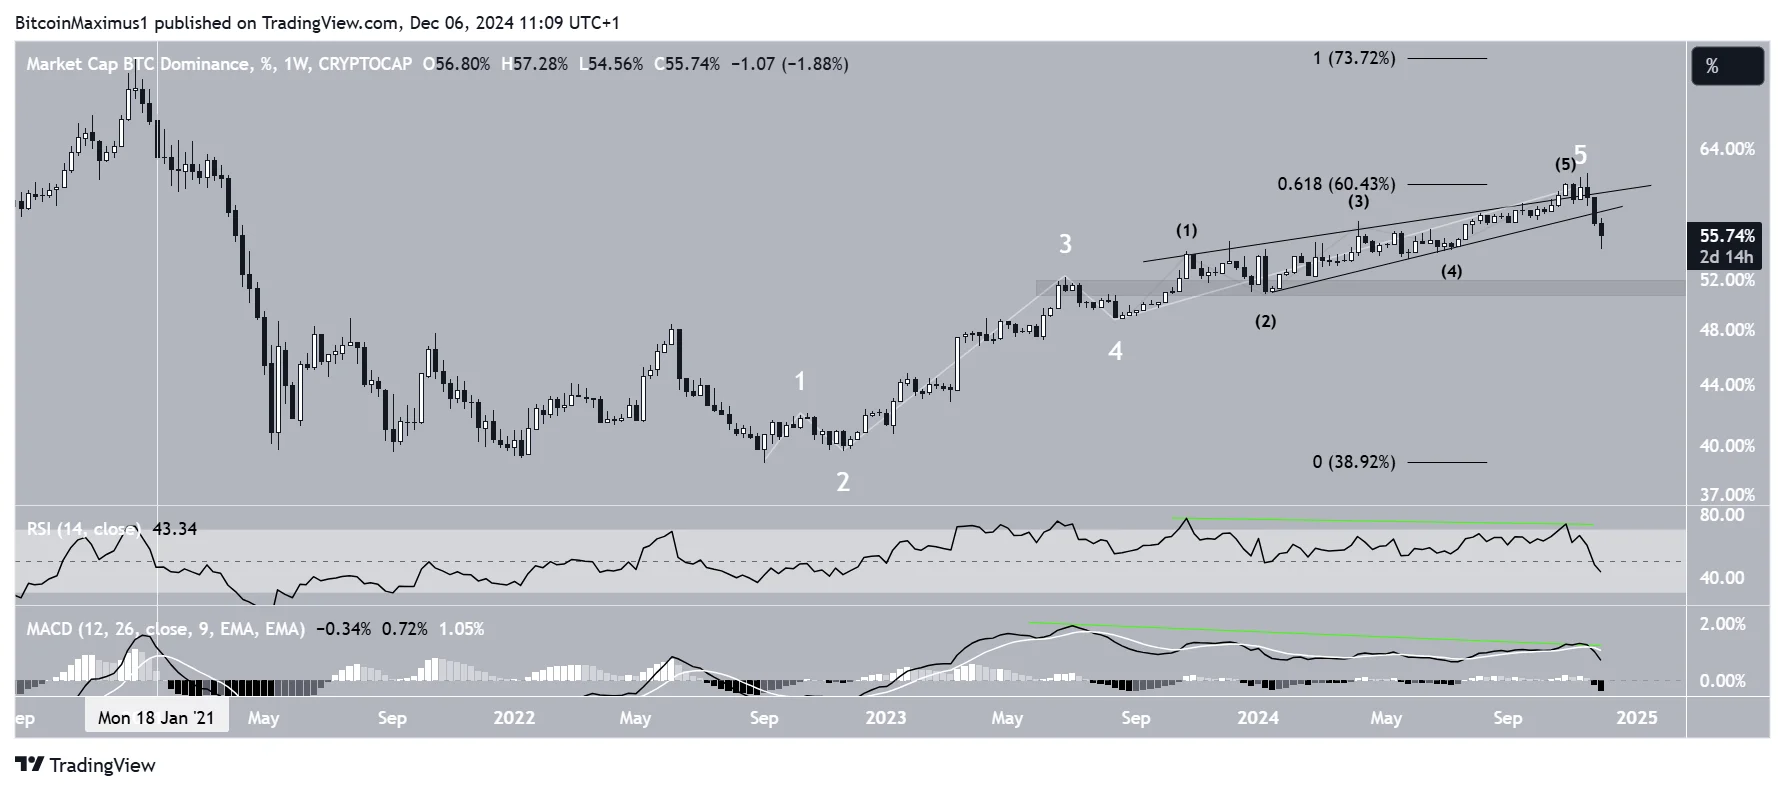
The Bitcoin dominance chart shows a completed five-wave upward movement starting in September 2022 (white). Wave five developed into an ending diagonal, characterized by the wedge shape. The sub-wave count is in black.
BTCD reached a high of 61.53% in November before falling over 7% and reaching a low of 54.56% this week. The high was made at the 0.618 Fibonacci retracement resistance level.
The closest horizontal support area is at 51.50%, having existed since the start of the year.
On top of the rejection from an important Fibonacci retracement resistance, technical indicators are bearish. The Relative Strength Index (RSI) and Moving Average Convergence/Divergence (MACD) have both generated bearish divergences (green).
Additionally, the RSI fell below 50 after reaching overbought territory in 2021 (white), accelerating BTCD’s downward movement toward new lows. The combination of these readings suggests that BTCD has reached its top and started a downward movement.
What Analysts are Saying
Sentiment toward a possible altcoin season is gradually building on X. Miles Deutscher noted that this is the highest Altcoin Season Index since the start of 2022, reaching a value of 90. In the last cycle, the index lasted 88 days, leading to massive altcoin increases.
Milkybull noted that the altcoin market cap is completing a long-term cup and handle pattern, a breakout above which will likely take them toward a new all-time high. He gives a target of $2 trillion for the ensuing upward movement.
AlejandroBTC noted the same thing but did so when charting against Bitcoin.
With that in mind, let’s analyze the altcoin market cap and see how likely this is.
During the increase, ALTCAP has surged above the 1.61 external Fibonacci level at $996 billion. This is a critical area that could have provided resistance. However, ALTCAP broke through it and reached a new all-time high of $1.16 trillion this week.
The next resistance is at $1.33 trillion, created by the 2.61 external retracement.
There is no bearish divergence in either the RSI or the MACD. On the contrary, both are increasing and have recently crossed important resistance levels. So, the increase will likely continue.
Giving wave five the same length as waves one and three gives a target of $1.28 trillion, close to the previously outlined $1.33 trillion resistance. As a result, this region will likely create a local top.
However, due to the extension of wave five and the lack of bearish divergences, ALTCAP may eventually increase to the next resistance at $1.78 trillion.
Altseason Has Arrived
The Bitcoin Dominance Rate and Altcoin Market Cap readings suggest that altseason is finally here. BTCD broke down from an ascending wedge and has likely completed a five-wave increase.
On the other hand, the Altcoin Market Cap is in the fifth and final wave of its upward movement and has already reached an all-time high.
Disclaimer:
The information provided in this article is for informational purposes only. It is not intended to be, nor should it be construed as, financial advice. We do not make any warranties regarding the completeness, reliability, or accuracy of this information. All investments involve risk, and past performance does not guarantee future results. We recommend consulting a financial advisor before making any investment decisions.
Valdrin Tahiri is a cryptocurrency analyst and reporter at CCN, specializing in technical analysis with a focus on Elliott Wave theory, on-chain metrics, and fundamental research. He brings over seven years of experience in the crypto space as both a trader and writer.
He discovered cryptocurrencies in 2017 while earning his MSc in Financial Markets at the Barcelona School of Economics, which sparked a deep interest in blockchain and market dynamics. Since then, he’s contributed to top crypto outlets like BeInCrypto and CoinGape.
Valdrin also served as Community Manager of BeInCrypto’s Telegram group for three years, helping grow it into one of the largest crypto communities worldwide. His expertise in market structure and price patterns allows him to break down complex trends into clear, actionable insights.
He’s published thousands of articles covering altcoins, Bitcoin cycles, and macro trends.