How Long Will the ORDI Increase Continue? | Credit: Derek Fenech
Share
Key Takeaways
The ORDI price broke out from a long-term parallel channel.
The price has nearly reached the $60 horizontal resistance.
Can ORDI break out above it and reach a new all-time high?
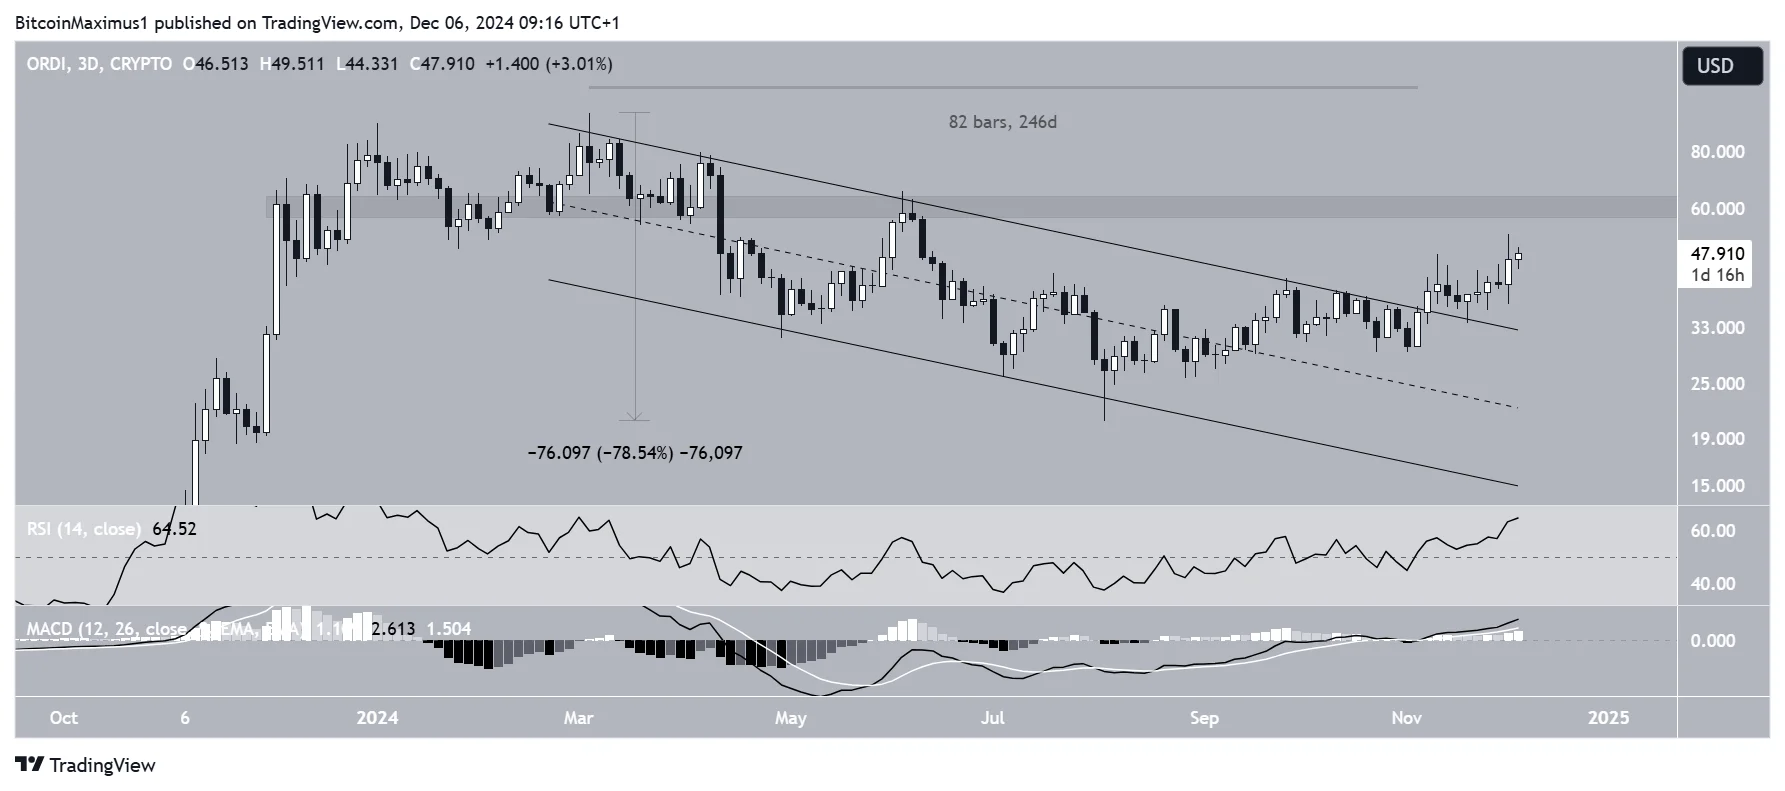
The Ordinals (ORDI) price has recovered since its low of $20.74 on Aug. 5, recently breaking out from a long-term descending parallel channel. This signals the correction has finally ended.
Despite its impressive increase since the lows, ORDI trades below the long-term resistance at $60. This is the final obstacle before a new all-time high. Will ORDI break it, and what’s next if it does? Let’s find out.
The 3-day chart shows that ORDI has fallen inside a descending parallel channel since its all-time high of $96.53 in March. The downward movement led to a low of $20.74 on Aug. 5, a decline of 78% since the high.
Parallel channels usually contain corrective movements, making an eventual breakout from the channel the most likely future scenario.
This happened on Nov. 8, 246 days after the channel was created. ORDI reached a high of $52.86, slightly below the $60 horizontal resistance area, the final one before the all-time high.
Technical indicators support the upward movement. The Relative Strength Index (RSI) and Moving Average Convergence/Divergence (MACD) are increasing and above their bullish thresholds at 50 and 0, respectively.
Therefore, the price action and indicator readings suggest the price increase will continue above the $60 resistance area.
Since this would take the ORDI price to a new all-time high, the wave count is needed to determine where ORDI will head next.
Then, the channel decline contained an A-B-C correction (black) with nearly the same length as the previous upward movement.
Therefore, it is likely that ORDI has started a new five-wave upward movement. If this is the case, a new ORDI all-time high is likely. The first possible target for the top of the upward movement is $146.
The target is created by the 1.61 external Fibonacci retracement of the correction.
The short-term count aligns with this reading. According to the count, ORDI is in an extended wave three after wave one ended as a leading diagonal. The sub-wave count is in black. Since wave three has extended, it will likely have 2.61 times the length of wave one.
This would lead to a new ORDI all-time high of $113.87, though there will likely be intermediate resistance at $81.82.
After a correction, wave five could end at the long-term Fibonacci target of $146. Falling below the sub-wave two low of $34 (red) will invalidate this count. This currently seems unlikely.$
Bullish Trend Ahead
The ORDI outlook in multiple time frames is bullish. The wave count suggests that ORDI has started the parabolic portion of its upward movement which will take it to a new all-time high.
There is intermediate resistance at $81.82 and $113.87.
Disclaimer:
The information provided in this article is for informational purposes only. It is not intended to be, nor should it be construed as, financial advice. We do not make any warranties regarding the completeness, reliability, or accuracy of this information. All investments involve risk, and past performance does not guarantee future results. We recommend consulting a financial advisor before making any investment decisions.
Valdrin Tahiri is a cryptocurrency analyst and reporter at CCN, specializing in technical analysis with a focus on Elliott Wave theory, on-chain metrics, and fundamental research. He brings over seven years of experience in the crypto space as both a trader and writer.
He discovered cryptocurrencies in 2017 while earning his MSc in Financial Markets at the Barcelona School of Economics, which sparked a deep interest in blockchain and market dynamics. Since then, he’s contributed to top crypto outlets like BeInCrypto and CoinGape.
Valdrin also served as Community Manager of BeInCrypto’s Telegram group for three years, helping grow it into one of the largest crypto communities worldwide. His expertise in market structure and price patterns allows him to break down complex trends into clear, actionable insights.
He’s published thousands of articles covering altcoins, Bitcoin cycles, and macro trends.