Venice Token (VVV) surges 15% as Robinhood listing and NVIDIA earnings fuel a push toward $23 ATH. Credit: CCN
Share
Key Takeaways
Venice Token (VVV) is up over 15% in the past 24 hours with trading volume climbing more than 100%, extending a four-session uptrend toward its $23 launch-day all-time high.
The rally is being powered by Robinhood’s spot listing of VVV on May 19 and trader positioning ahead of NVIDIA’s Q1 2026 earnings, due after market close today, May 20.
Technical indicators (20-day EMA hold, positive CMF) and on-chain data all align with continued upside toward the $19.17 resistance.
VVV is leading market gains today.
It is up more than 15% in the past 24 hours, with trading volume climbing over 100% as the privacy-focused AI token extends a four-session uptrend back toward its launch-day all-time high of $23.
This rally comes amid a string of bullish catalysts for the AI crypto vertical this week.
Robinhood listed VVV for spot trading on May 19, opening the privacy-focused AI token to a massive U.S. retail user base. Also, with NVIDIA’s highly anticipated Q1 earnings call scheduled for after market close today, traders are pricing in continued upside over the next few sessions.
How far will VVV climb in the short term?
VVV Robinhood Debut Meets NVIDIA Earnings Day
VVV’s latest leg up has been driven by Robinhood’s decision to list the token for spot trading. On May 19, the popular commission-free trading platform took to X to announce that VVV was live on its platform, opening up the privacy-focused AI token to its massive U.S. retail user base.
This follows a series of major exchange wins for the VVV token in the last two weeks. On May 12, the token was listed on Crypto.com and Upbit, with trading pairs in Korean won, Bitcoin, and USDT. Together, these listings have broadened VVV’s reach across the U.S., Asia, and Europe within a fortnight.
Another reason for the recent uptick in demand for VVV is NVIDIA’s Q1 2026 earnings, due after the U.S. market close today.
Per Bloomberg, the chipmaker is expected to report earnings per share (EPS) of $1.76 on revenue of $78.75 billion. That’s up from the $0.96 and $44.06 billion the company saw in Q1 last year. NVIDIA’s data center business is projected to make up the bulk of its revenue, bringing in an estimated $72.85 billion.
VVV Bulls in Control
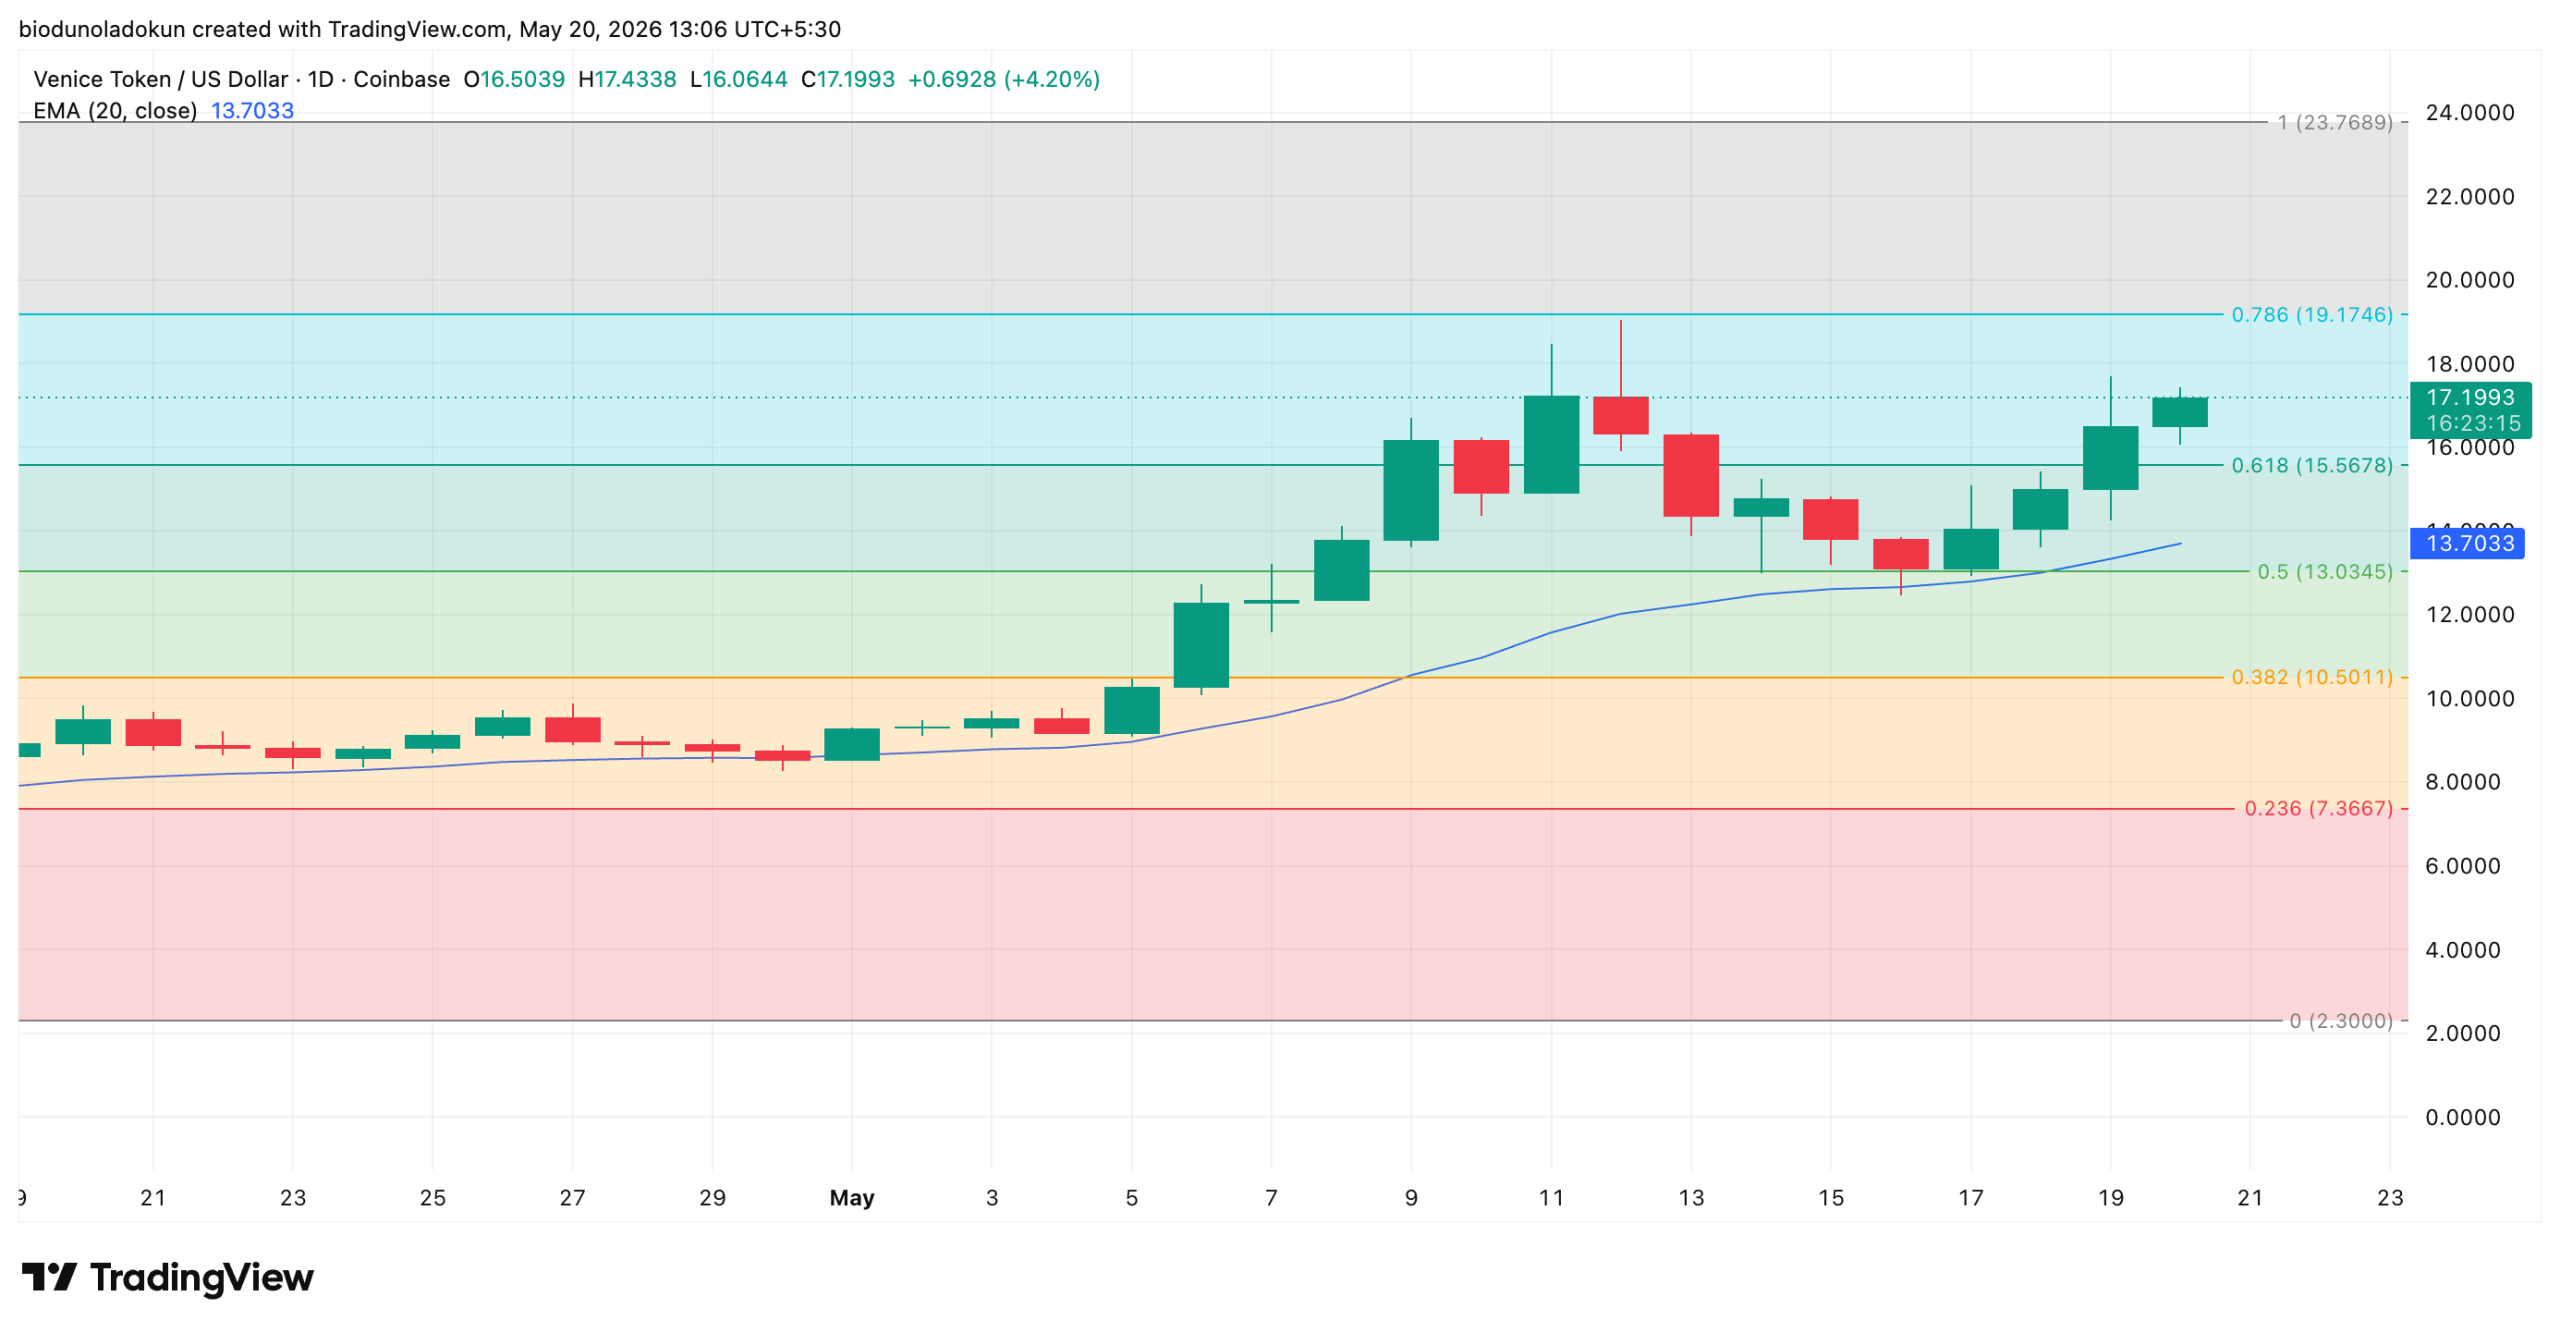
Beyond these catalysts, technical data on the daily chart is also aligning with the bulls.
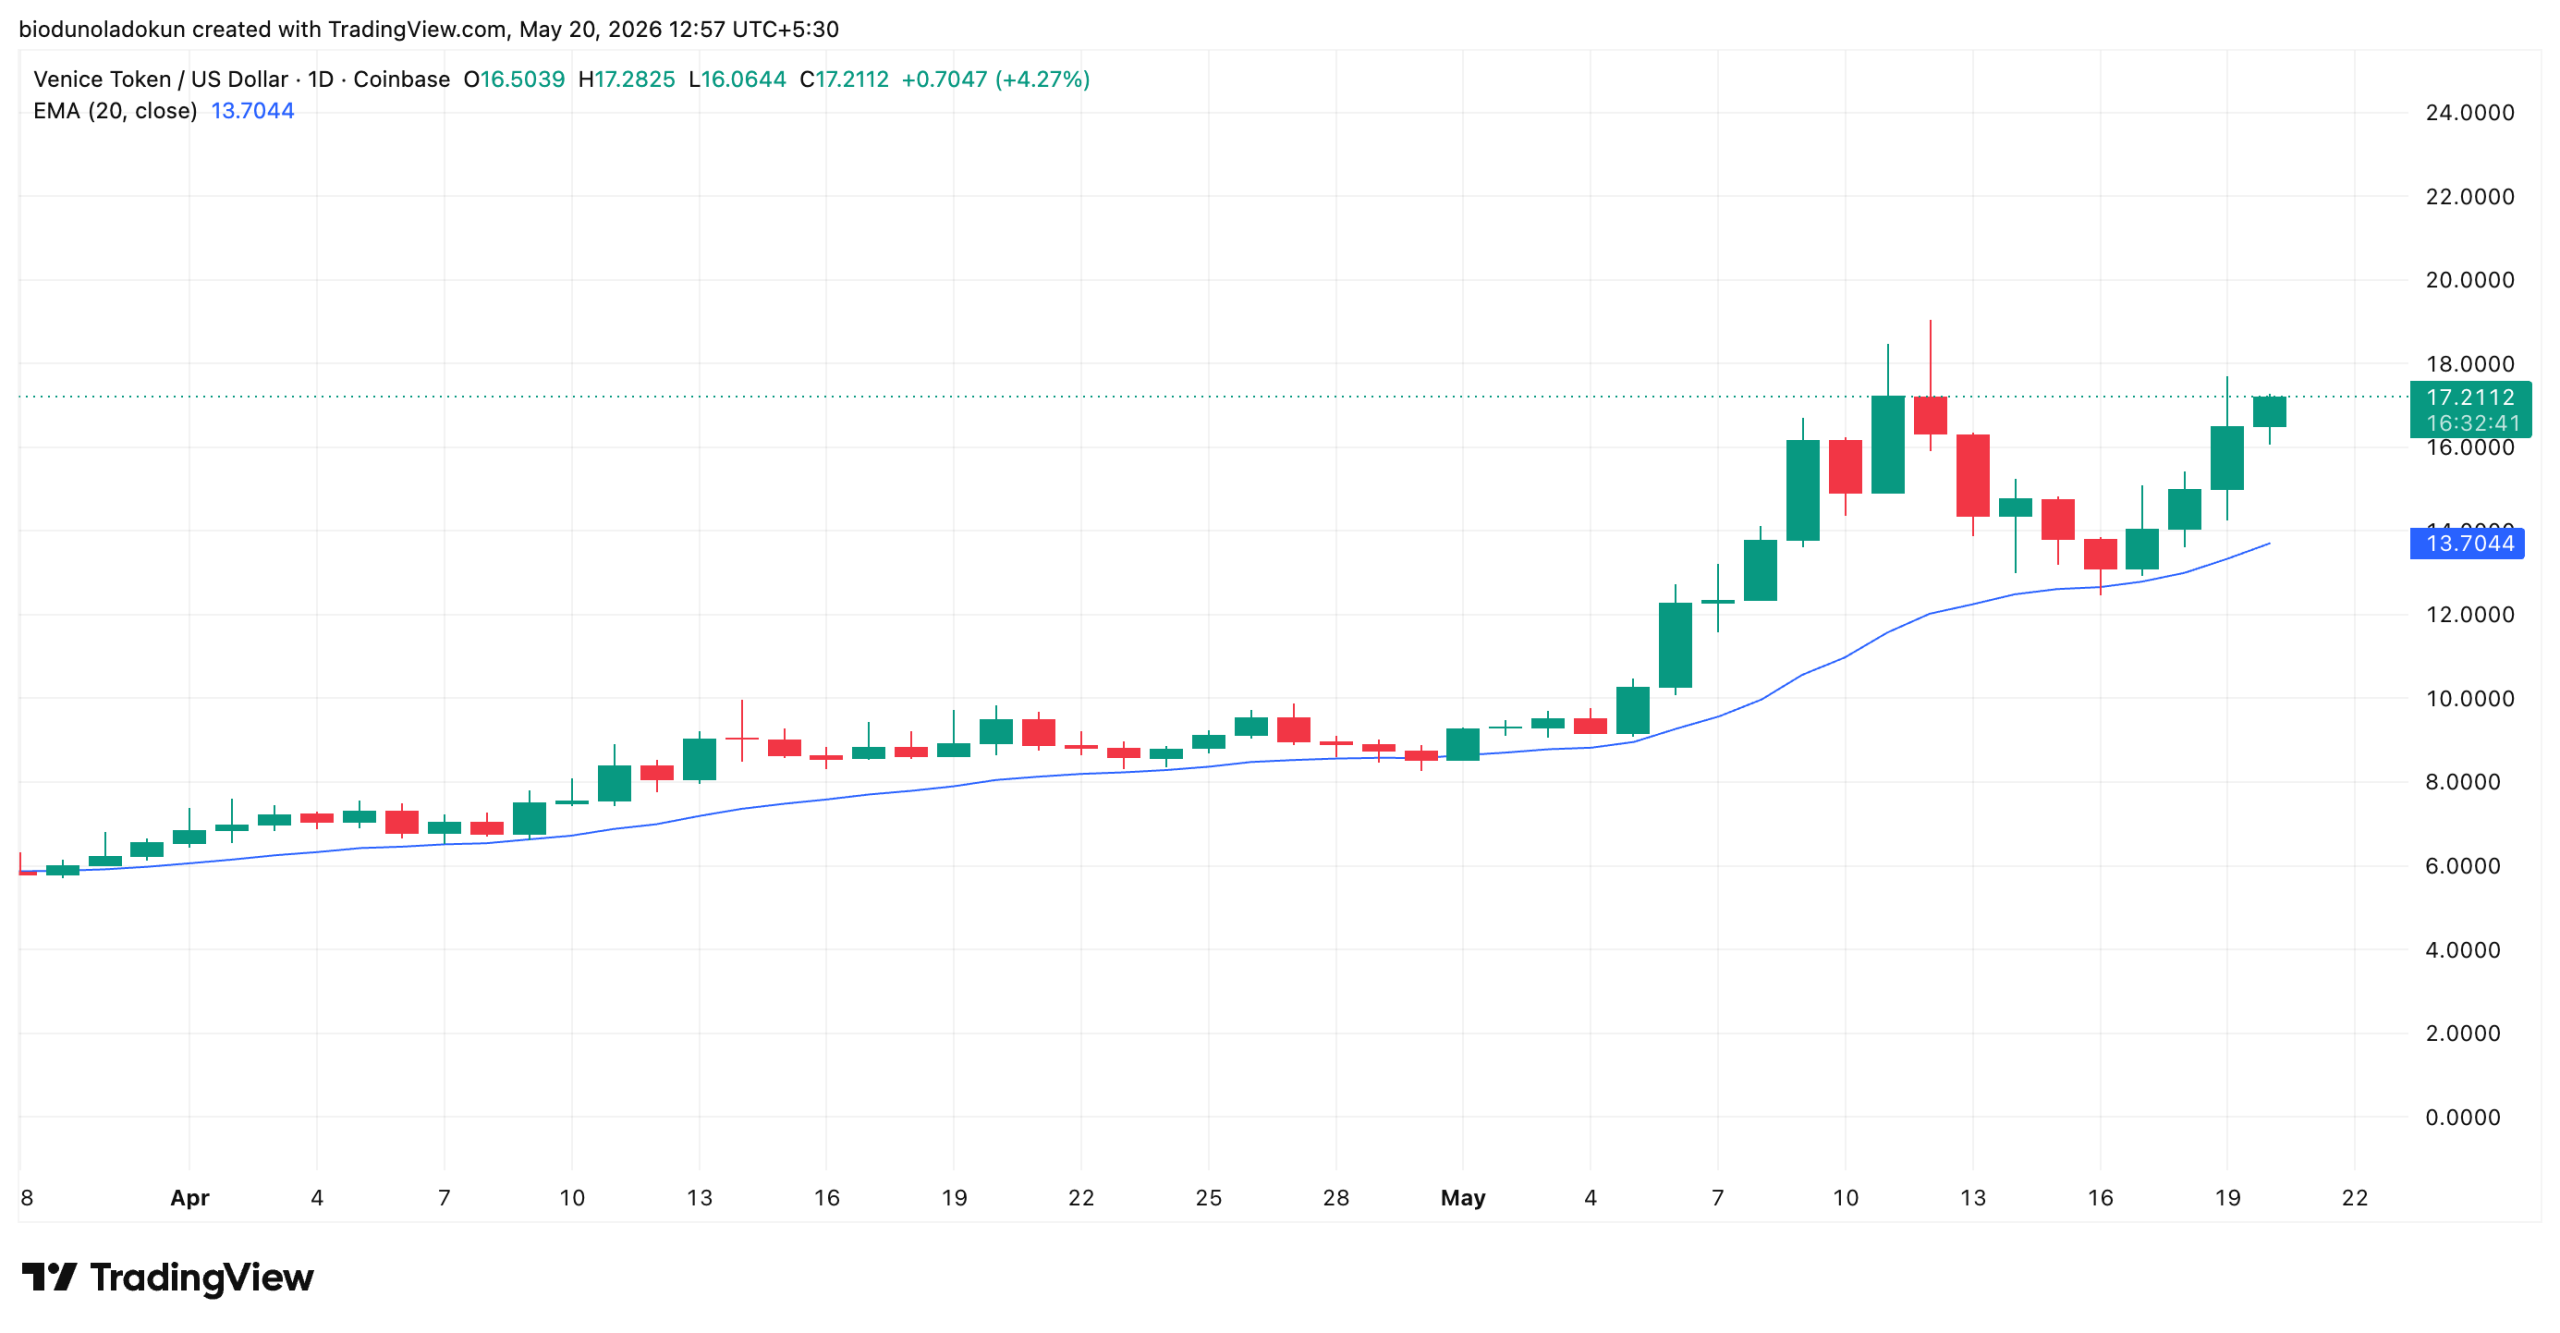
At press time, VVV trades above its 20-day exponential moving average (EMA), which forms a critical dynamic support at $13.70. For context, VVV currently trades at $17.21, putting it 26% above this key level.
The 20-day EMA measures an asset’s average price over the past 20 trading days, giving more weight to recent prices.
This makes it more responsive to short-term price action than a simple moving average and is widely used by traders as a gauge of near-term trend direction.
When a token trades above this level, it indicates bullish sentiment, as buyers are consistently stepping in to sustain upward pressure.
VVV’s clean hold above the 20-day EMA may encourage further accumulation, with the $13.70 level serving as a firm floor that continues to absorb selling pressure and hold price up.
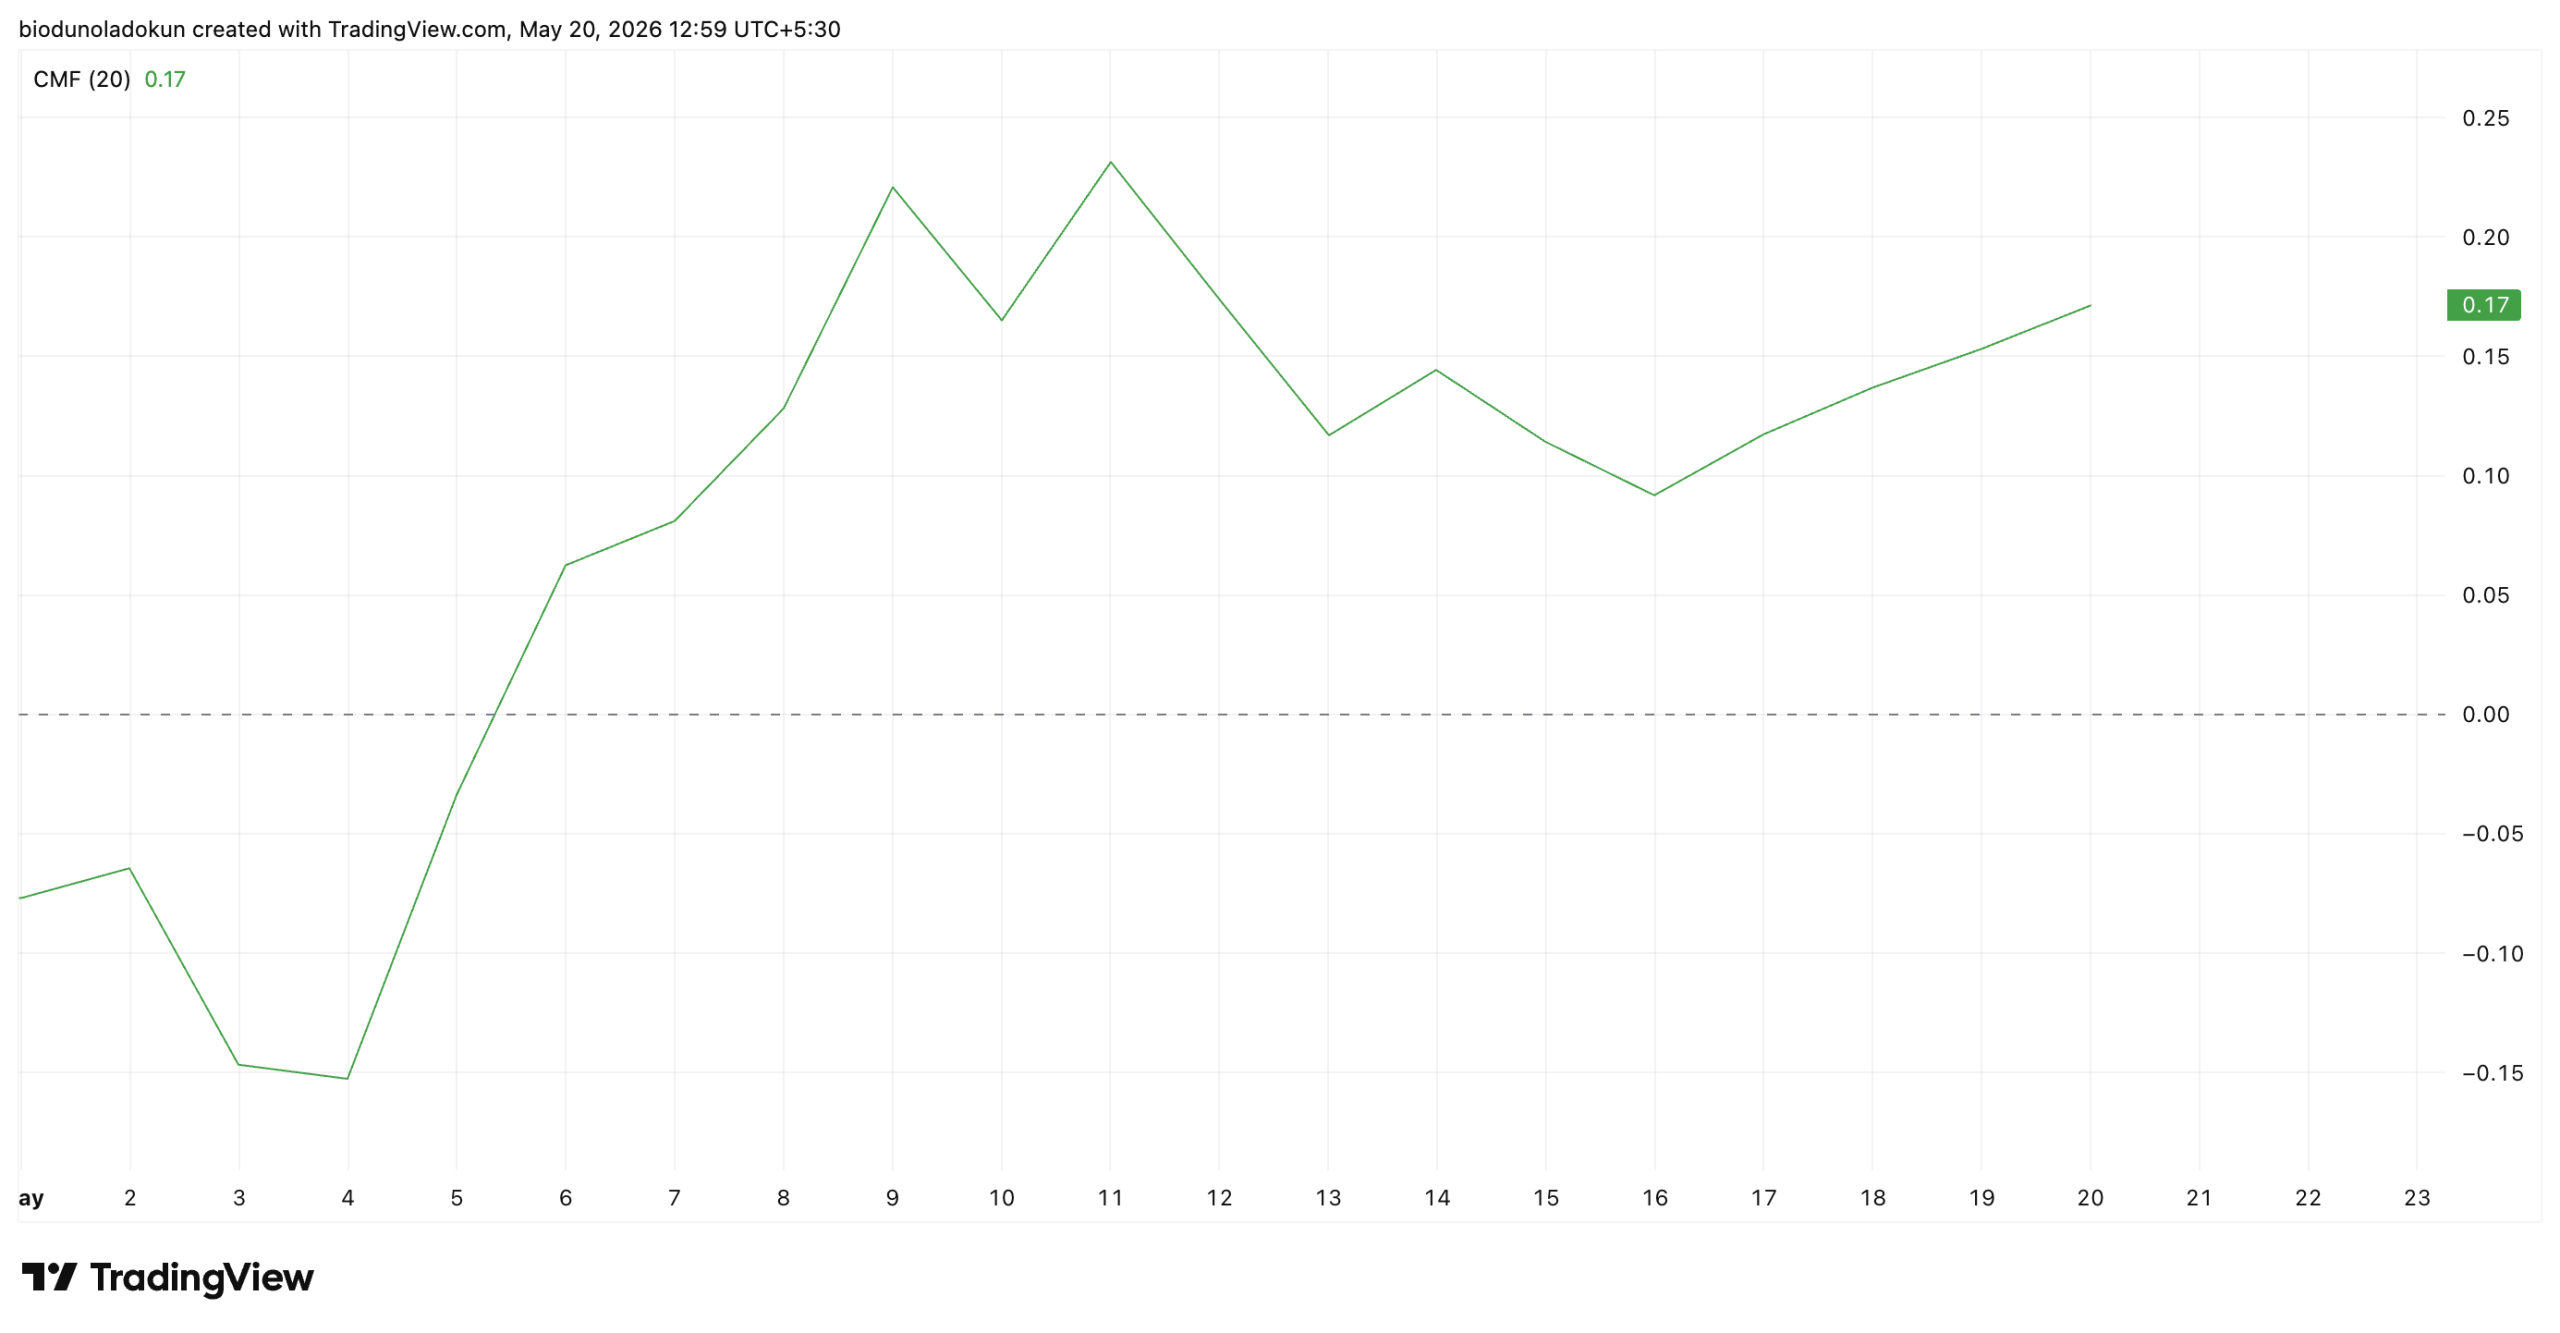
Furthermore, readings from VVV’s Chaikin Money Flow (CMF) indicator support this bullish outlook. As of this writing, the momentum indicator sits above the zero line at 0.17 and remains in an uptrend.
The CMF is a volume-weighted indicator that measures buying versus selling flow. When it prints a positive value during a price rally like this, it means the uptick is backed by genuine buy-side flows, lending credibility to the move.
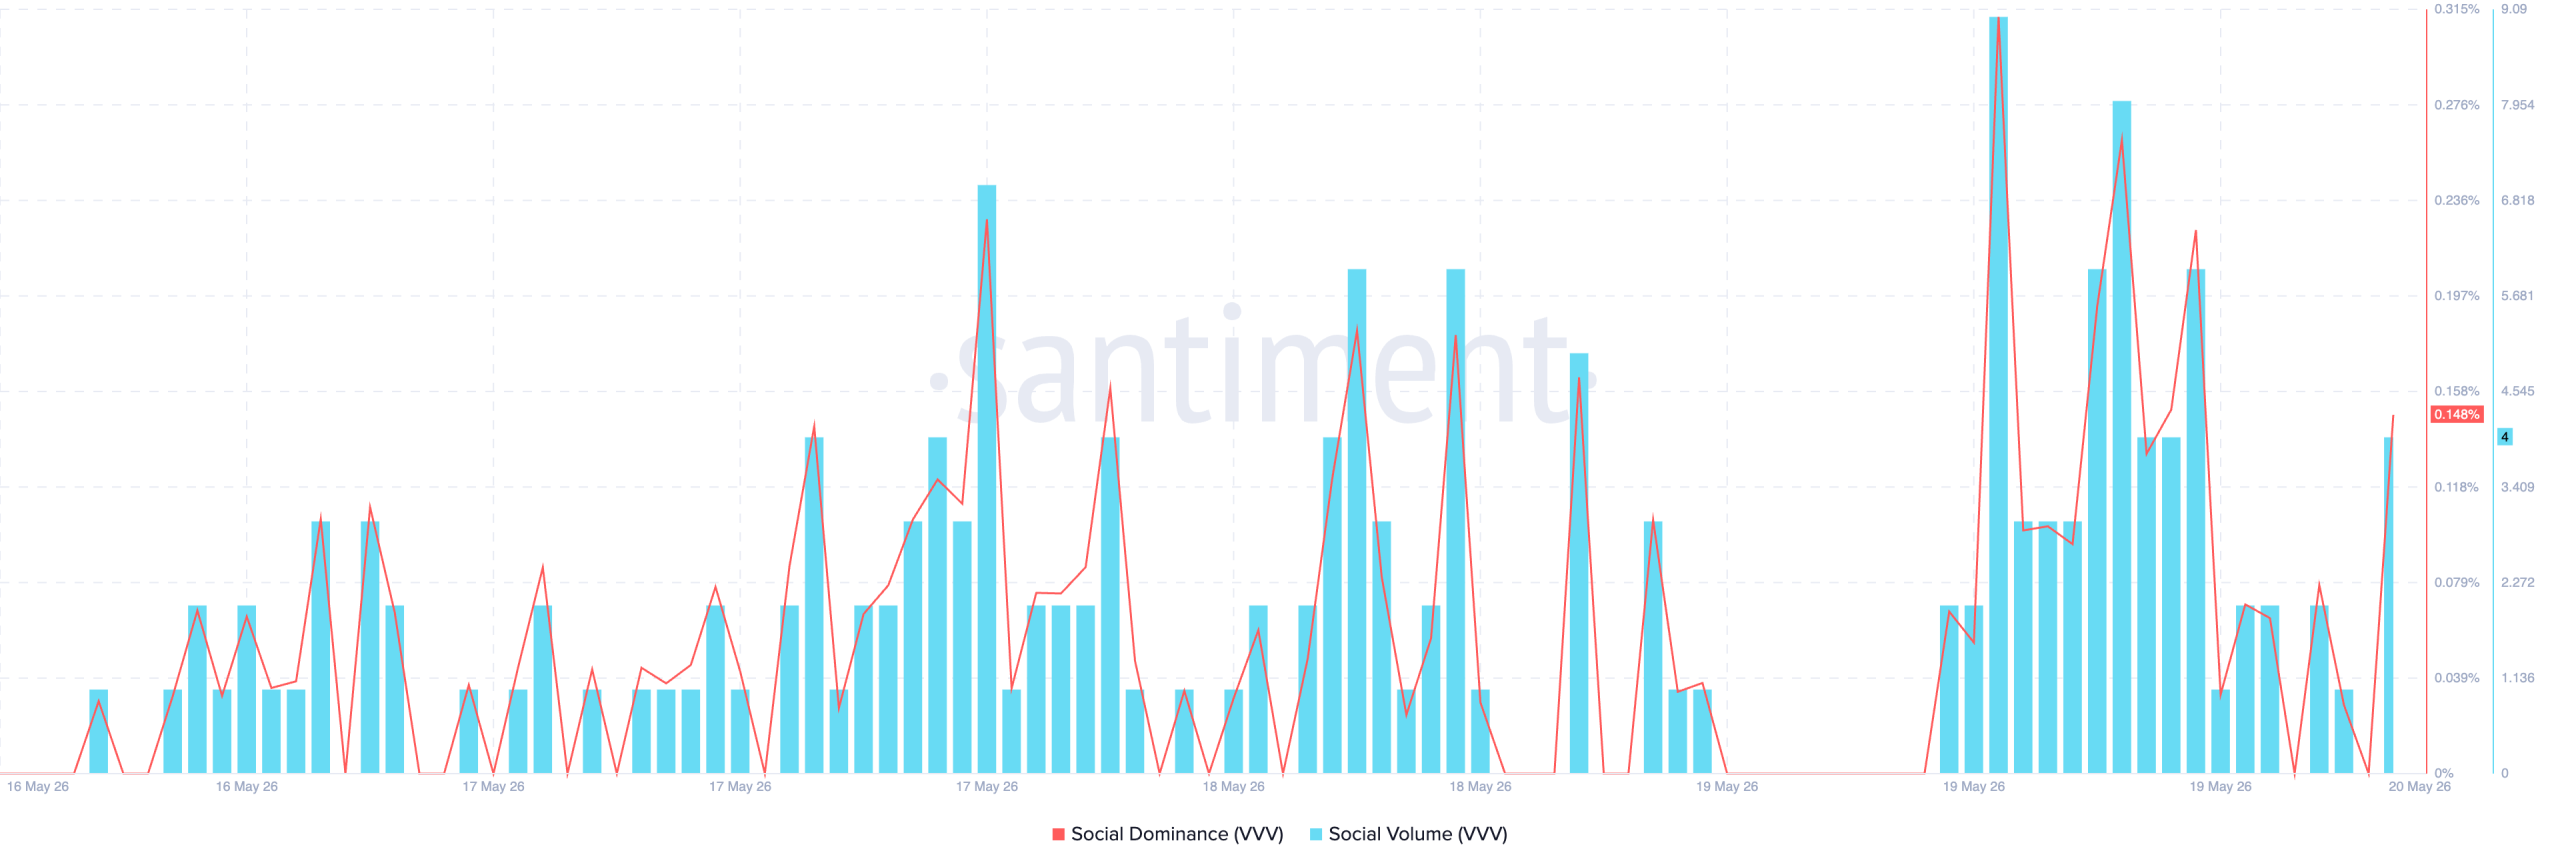
Beyond the price charts, VVV’s on-chain metrics also hint at a sustained price surge. According to Santiment, the altcoin’s social dominance and social volume each spiked to 10-day highs yesterday following the Robinhood listing announcement.
An asset’s social dominance tracks how often it is mentioned across social platforms, forums, and news outlets relative to the rest of the market.
Social volume, on the other hand, is the total number of social data text documents — such as Telegram messages and Reddit posts — that contain at least one mention of a given asset over a defined period.
When these social metrics expand in tandem with price, it signals that the asset in question is capturing retail interest, and historically, this has preceded upward price moves in altcoins.
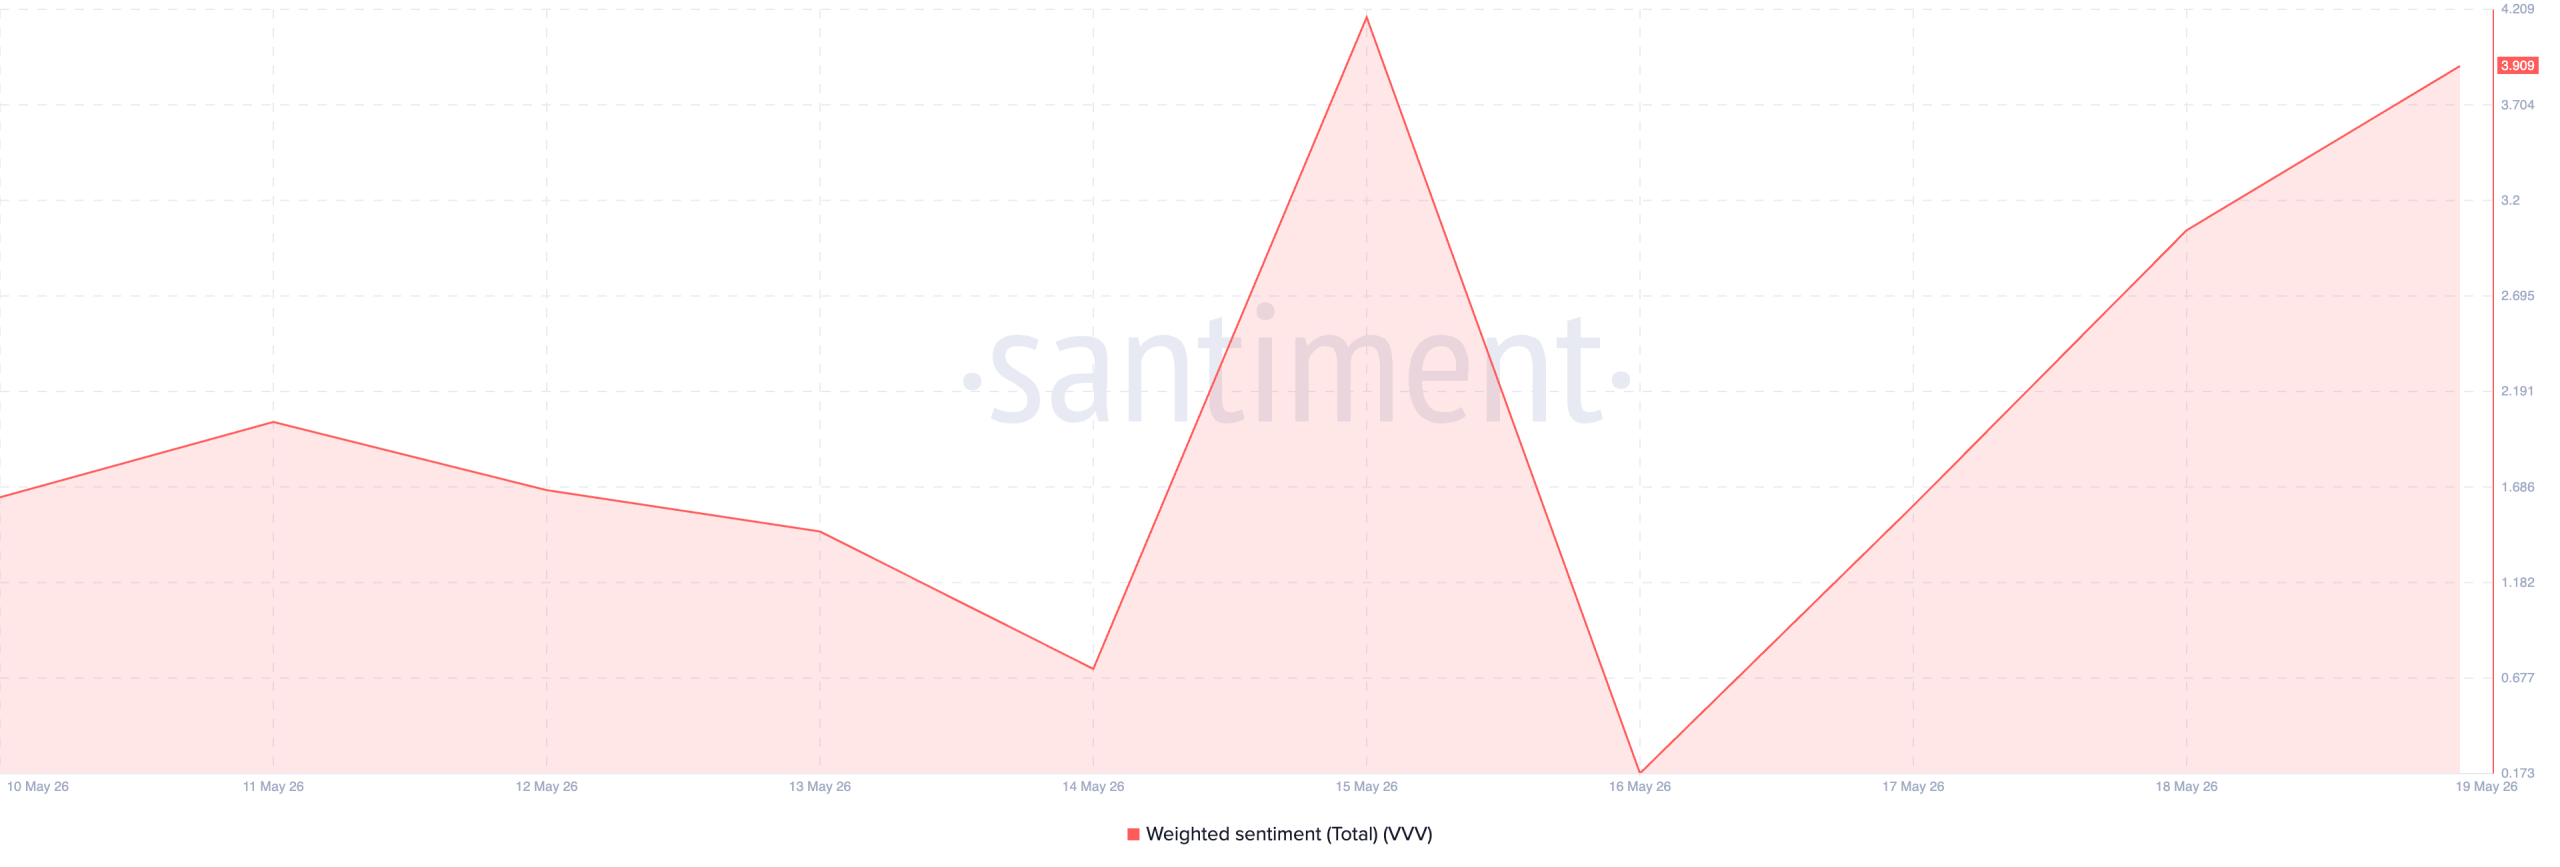
Moreover, VVV’s Weighted sentiment, which measures the balance of bullish versus bearish commentary across social platforms, has also climbed higher. This suggests the conversation around the altcoin is increasingly positive.
Conversely, failure to break through could see VVV pull back toward the 0.618 Fibonacci level at $15.56, with the 20-day EMA at $13.70 acting as the next major line of defense.
Disclaimer:
The information provided in this article is for informational purposes only. It is not intended to be, nor should it be construed as, financial advice. We do not make any warranties regarding the completeness, reliability, or accuracy of this information. All investments involve risk, and past performance does not guarantee future results. We recommend consulting a financial advisor before making any investment decisions.
Abiodun Oladokun is a Research Analyst at CCN, where he covers cryptocurrency markets with a focus on on-chain analysis, technical assessments, and emerging trends across decentralized finance (DeFi), real-world assets (RWA), artificial intelligence (AI), decentralized physical infrastructure networks (DePIN), Layer 2s, and meme coins.
Prior to CCN, he served as a Senior On-Chain Analyst at BeInCrypto, producing market reports spanning diverse crypto sectors.
Before that, he conducted technical analysis and market assessments of various altcoins at AMBCrypto, where he also contributed long-form quarterly research papers on DeFi, NFTs, DAOs, and scaling architectures, leveraging on-chain platforms including Messari, Santiment, DefiLlama, and Dune Analytics.
He began his crypto career as a research analyst at SixthSense DAO, developing blockchain forensic tools to trace the history of stolen assets.
Abiodun is a lawyer called to the Nigerian Bar and the founder of Ilé Ijó, a Lagos-based electronic dance music collective.