Polkadot finds itself at a crossroads after a sustained corrective phase. Following its peak at $11.51, DOT has retreated to critical Fibonacci retracement levels, testing the strength of investor sentiment.
With DOT consolidating near $6.65, its next major move will determine whether the recent downturn was a temporary pullback or the precursor to deeper losses.
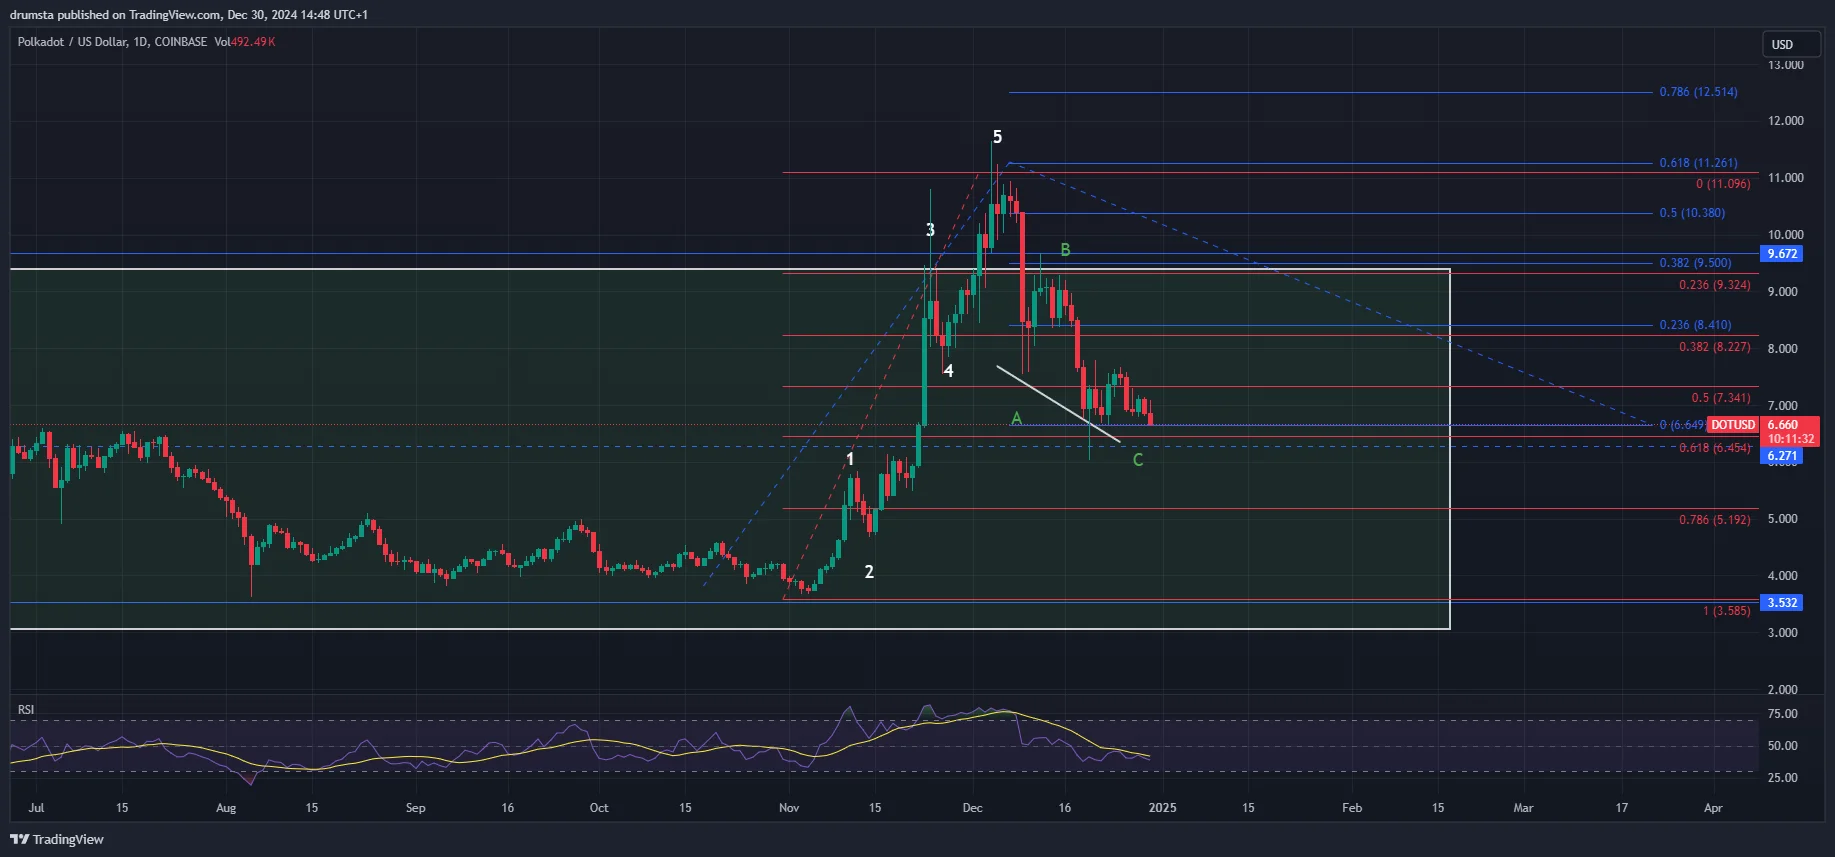
On the daily chart, DOT has completed a five-wave Elliott structure, culminating at $11.51, before entering a corrective ABC phase. Prices have since converged toward $6.45, a crucial 0.618 Fibonacci retracement level, which acts as a key support zone.
A sustained hold above $6.45 could signal the start of a recovery, with immediate resistance at $7.34 (0.5 Fibonacci). Beyond this, targets include $8.22 (0.382 Fibonacci) and $9.50 (0.236 Fibonacci).
However, failure to maintain support at $6.45 opens the door to further downside, with $5.19 (0.786 Fibonacci) emerging as the next safety net.
DOTUSD ending its corrective phase | Credit: Nikola Lazic/TradingView
The Relative Strength Index (RSI) offers limited clarity, reflecting neutral momentum that aligns with the ongoing consolidation. While the indicator has not entered oversold territory, declining momentum suggests bearish pressure.
A breakout above $7.34 would likely confirm a bullish reversal, while a breach below $6.45 could accelerate losses.
DOT Price Prediction
Zooming into the hourly chart, DOT displays a descending structure as part of its ABC corrective phase. After failing to break the descending trendline, the price now flirts with horizontal support at $6.65.
DOTUSD horizontal level interaction result awaited | Credit: Nikola Lazic/TradingView
The RSI on the hourly chart mirrors broader market indecision, offering no strong overbought or oversold signals. A breakout above the descending trendline could spark a fresh impulsive wave, targeting $8.22 and $9.67. Conversely, a failure to hold $6.65 risks pushing the cryptocurrency toward $6.27 and potentially $5.19.
In one scenario, Polkadot’s correction concluded with the Dec. 20 low near $6. This would mark the beginning of a new five-wave impulsive structure to the upside. Alternatively, the correction may still have one final leg down, potentially testing $5.19 before initiating a rebound.
The next decisive move will hinge on whether DOT breaks above its descending trendline or breaches critical support levels. Traders are watching closely for signs of a breakout or breakdown as the price consolidates within this pivotal range.
Critical Zone: $6.45-$7.34 for potential breakout or breakdown.
Bearish Target: Below $6.45, the next support level is $5.19.
Bullish Potential: Above $7.34, targets are $8.22 and $9.50.
Disclaimer:
The information provided in this article is for informational purposes only. It is not intended to be, nor should it be construed as, financial advice. We do not make any warranties regarding the completeness, reliability, or accuracy of this information. All investments involve risk, and past performance does not guarantee future results. We recommend consulting a financial advisor before making any investment decisions.
Nikola Lazic is a cryptocurrency analyst and investor working in the industry since 2017. He holds a bachelor's degree in Sociology, which enables him to better understand the psychology behind the crowd´s positioning. Consequently his preferred analytical tool is Elliott Wave Theory in combination with price action analysis.
Combining his experience in trading and investing with knowledge in content writing he strives to bring the most accurate and actionable information.