SOL price surges with record inflows | Credit: Hameem Sarwar
Share
Key Takeaways
Solana records $706.5 million in weekly inflows, pushing its YTD total to $2.58 billion.
SOL shows rising buying pressure, positioning for a potential breakout above $256.
With a confirmed breakout, Solana’s price could potentially rise toward its all-time high.
SOL, the native cryptocurrency of one of the largest Layer 1 blockchains, Solana, is charging toward its all-time high.
This move follows a massive surge in crypto investment inflows, as Solana recorded its highest weekly inflow and strongest weeks to date.
At press time, SOL trades at $232.8, showing a 12.6% increase over the past week. Technical indicators suggest the cryptocurrency could be gearing up for its next.
Here is what to expect from SOL, along with the key levels to watch.
Solana Trend Bullish
On the 4-hour chart, Solana’s price has reversed from the downtrend as the Money Flow Index (MFI) has climbed to 64.53. The rise in the MFI signals strong capital inflows and mounting buying pressure.
Amid the persistent demand, SOL is unlikely to experience a notable correction. However, the MFI is not the only one rising.
Get These Top Crypto Casino Offers Now!
Sponsored
Disclosure
We sometimes use affiliate links in our content, when clicking on those we might receive a commission at no extra cost to you. By using this website you agree to our terms and conditions and privacy policy.
Meanwhile, the Bear Bull Power (BBP) reads 14.23 on the daily chart, while the coin prints multiple green candlesticks.
This position is a clear sign that bulls are in control. If this buying momentum continues, SOL’s price could break through its key resistance zone at $256, opening the door to new highs.
Outside the technical outlook, fund inflows into Solana-linked investment products have played a crucial role in boosting sentiment.
According to CoinShares, Solana recorded an impressive $707 million weekly inflows — its highest on record.
This surge signals rising institutional confidence. Typically, such inflows indicate optimism about Solana’s long-term potential but also increase short-term demand pressure.
If this trend continues, the capital rotation into the products could sustain upward momentum, helping Solana’s price remain resilient even during pullbacks.
“Solana broke its weekly record, seeing inflows of US$706.5M last week, bringing YTD inflows to $2.58B,” says James Butterfill, a Head of Research at for CoinShares Research revealed.
SOL Price Outlook: Key Levels to Watch
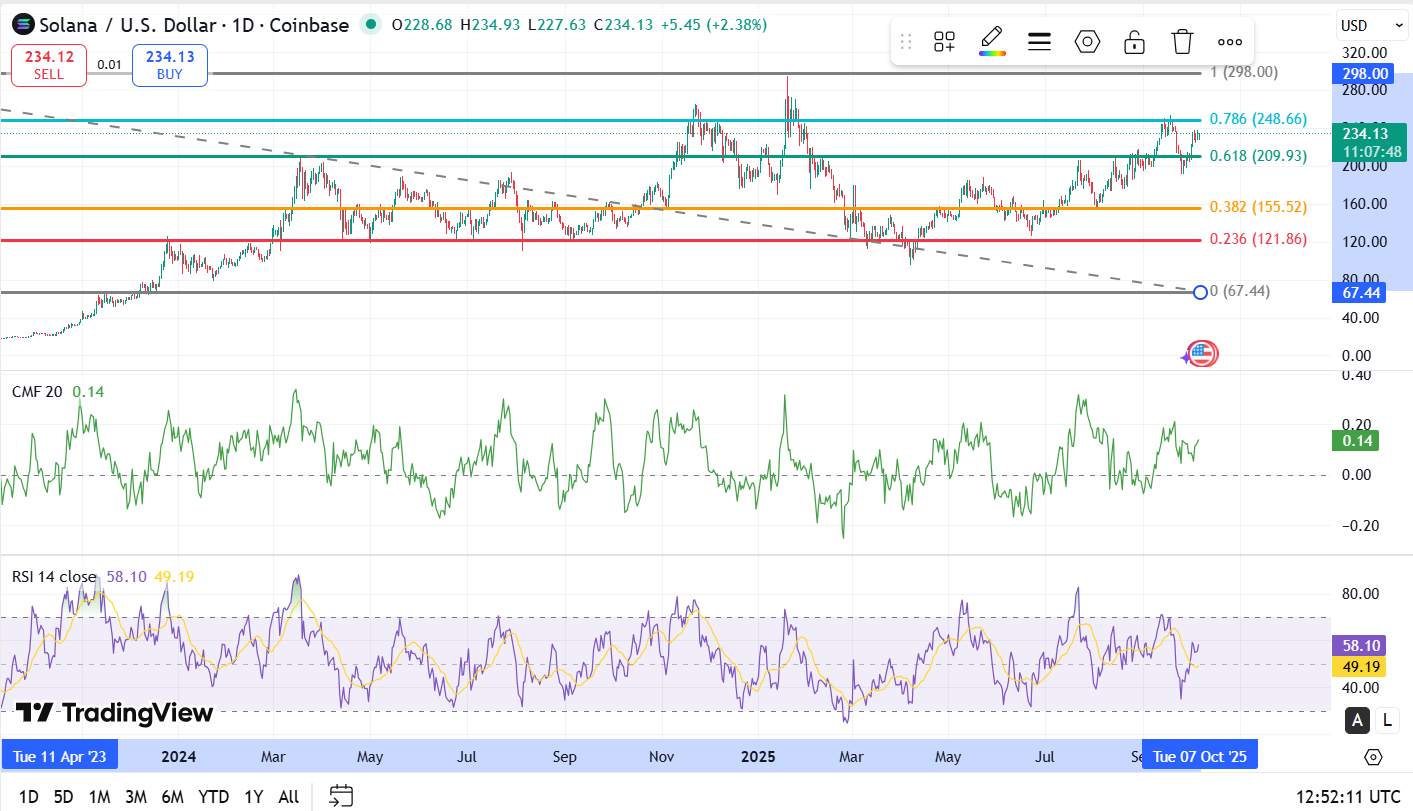
On the daily chart, SOL shows similar strength. At press time, the Chaikin Money Flow (CMF) sits at 0.14, above the neutral zone of zero, suggesting increasing capital inflows as the altcoin prepares for another upswing.
The steady rise in accumulation indicates that bulls are not only holding but also actively adding to their positions ahead of potential catalysts, such as the inflows.
The Relative Strength Index (RSI) also signals growing momentum. The indicator has crossed the neutral 50 mark and now sits at 58.0.
With indicators aligning across multiple timeframes, Solana’s price structure remains bullish.
The Fibonacci retracement chart reveals a strong confluence between the 0.618 Fib level at $227 and the 0.382 Fib level at $185. This reinforces the zones as critical supports in the event of a pullback.
For now, momentum clearly favors the bulls. Trading at $234, SOL’s price is moving toward the 0.786 Fibonacci retracement level at $256. A breakout above this level could set up a retest of its all-time high, near the 1.0 Fibonacci retracement at $296.
A strong close above this resistance would confirm bullish continuation and potentially attract another wave of institutional flows.
However, if SOL slips below its key support at $227, a short-term correction could happen, potentially dragging the price toward its next support at $192.
Disclaimer:
The information provided in this article is for informational purposes only. It is not intended to be, nor should it be construed as, financial advice. We do not make any warranties regarding the completeness, reliability, or accuracy of this information. All investments involve risk, and past performance does not guarantee future results. We recommend consulting a financial advisor before making any investment decisions.
Victor Olanrewaju is a crypto analyst and reporter at CCN with deep roots in on-chain research and technical analysis. His crypto journey began in 2017, but it was the 2020 Uniswap airdrop that sparked a full-time pivot into the space.
With a foundation in copywriting, Victor honed his craft creating high-converting content for leading crypto brokers — most notably an XRP price prediction that ranked #1 on Google during the 2021 bull run.
He later joined AMBCrypto in 2022, where he combined storytelling with technical and on-chain analysis to cover key market narratives.
In 2024, he expanded his expertise at BeInCrypto, collaborating with analysts and using tools like Glassnode, Santiment, and IntoTheBlock to break down Bitcoin and altcoin trends.
At CCN, Victor covers the top cryptocurrencies, memecoins, macro shifts, blending real-time insights with deep-dive metrics.
He holds a Bachelor’s degree in Physics from the University of Ibadan, equipping him to simplify complex data for a wide audience. Follow his work or connect on LinkedIn or X.