SHIB price made a 12% increase since yesterday, as it entered the oversold zone on the daily chart. More upside expected in the short term.
Share
Key Takeaways
Immediate Support at $0.00002627: The 0.5 Fibonacci level is a key defense.
Oversold RSI Conditions: Indicate a potential short-term bounce or stabilization.
Resistance at $0.00002959: 0.618 Fibonacci retracement likely to limit wave (b)’s upside.
Shiba Inu (SHIB) has recently completed a five-wave Elliott Wave rally, peaking at $0.000033 on Dec. 1.
The price has entered a corrective phase following this significant move, falling by 27%. The pullback to the 0.5 Fibonacci retracement level, combined with oversold RSI conditions, hints at a potential recovery or the formation of a deeper correction.
The coming days will likely determine whether SHIB resumes its uptrend or stabilizes further within the corrective structure.
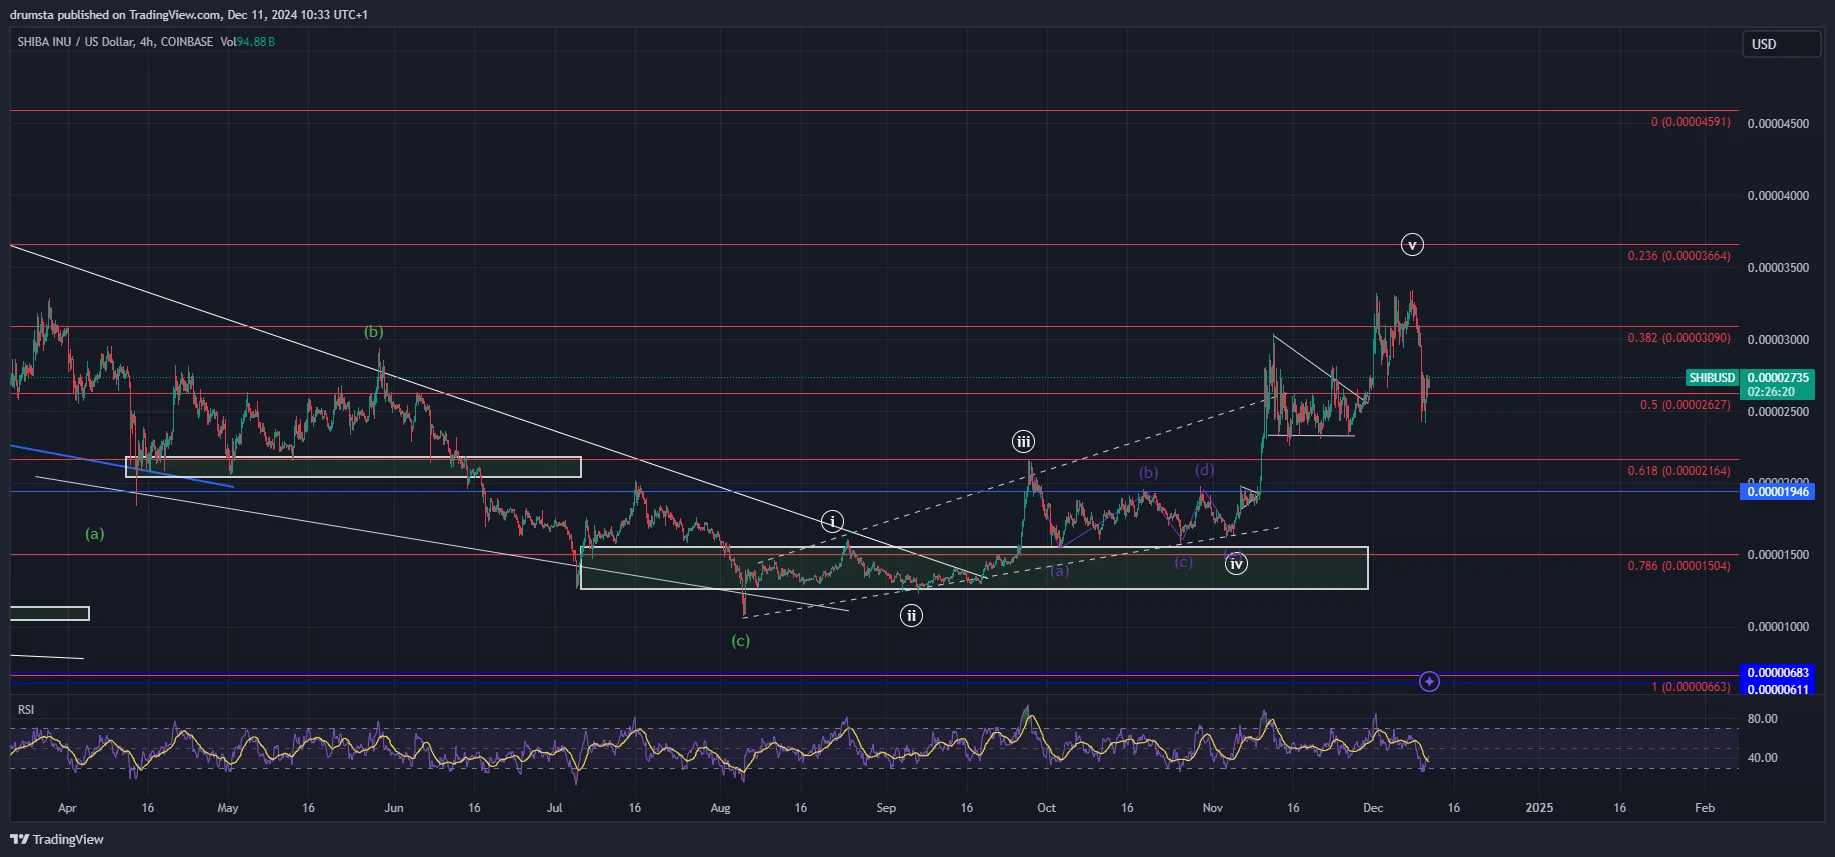
The daily SHIB chart shows the price action formed a five-wave Elliott Wave pattern to a high of $0.000033 on Dec. 1, after which it started to show signs of struggle.
The initial corrective wave ABC formed a descending channel, indicating a bottoming phase in August.
Fibonacci retracements highlight key resistance levels at 0.236 and 0.382, where the price faced rejection. The recent pullback to the 0.5 Fibonacci level aligns with profit-taking and weak buying momentum.
SHIBUSD at oversold zone | Credit: Nikola Lazic/TradingView
The daily Relative Strength Index (RSI) fell to the oversold zone, suggesting a potential recovery but depending on support holding. The price fell to a low of $0.0000244 on Dec. 10 and made a 12% recovery, currently trading at $0.0000274.
Considering that the price fell by 27%, fell to the 0.5 Fib retracement, and signaled oversold conditions, this could be a setup for a larger recovery, if not its next upward advancement to a new yearly high.
Key Observations
Fibonacci 0.5 at 0.00002627 serves as immediate support, with 0.618 at 0.00002164 as a critical level.
RSI indicates oversold conditions, hinting at a possible short-term bounce.
Resistance at 0.236 and 0.382 levels shows strong selling pressure, limiting upside potential.
SHIB Price Prediction
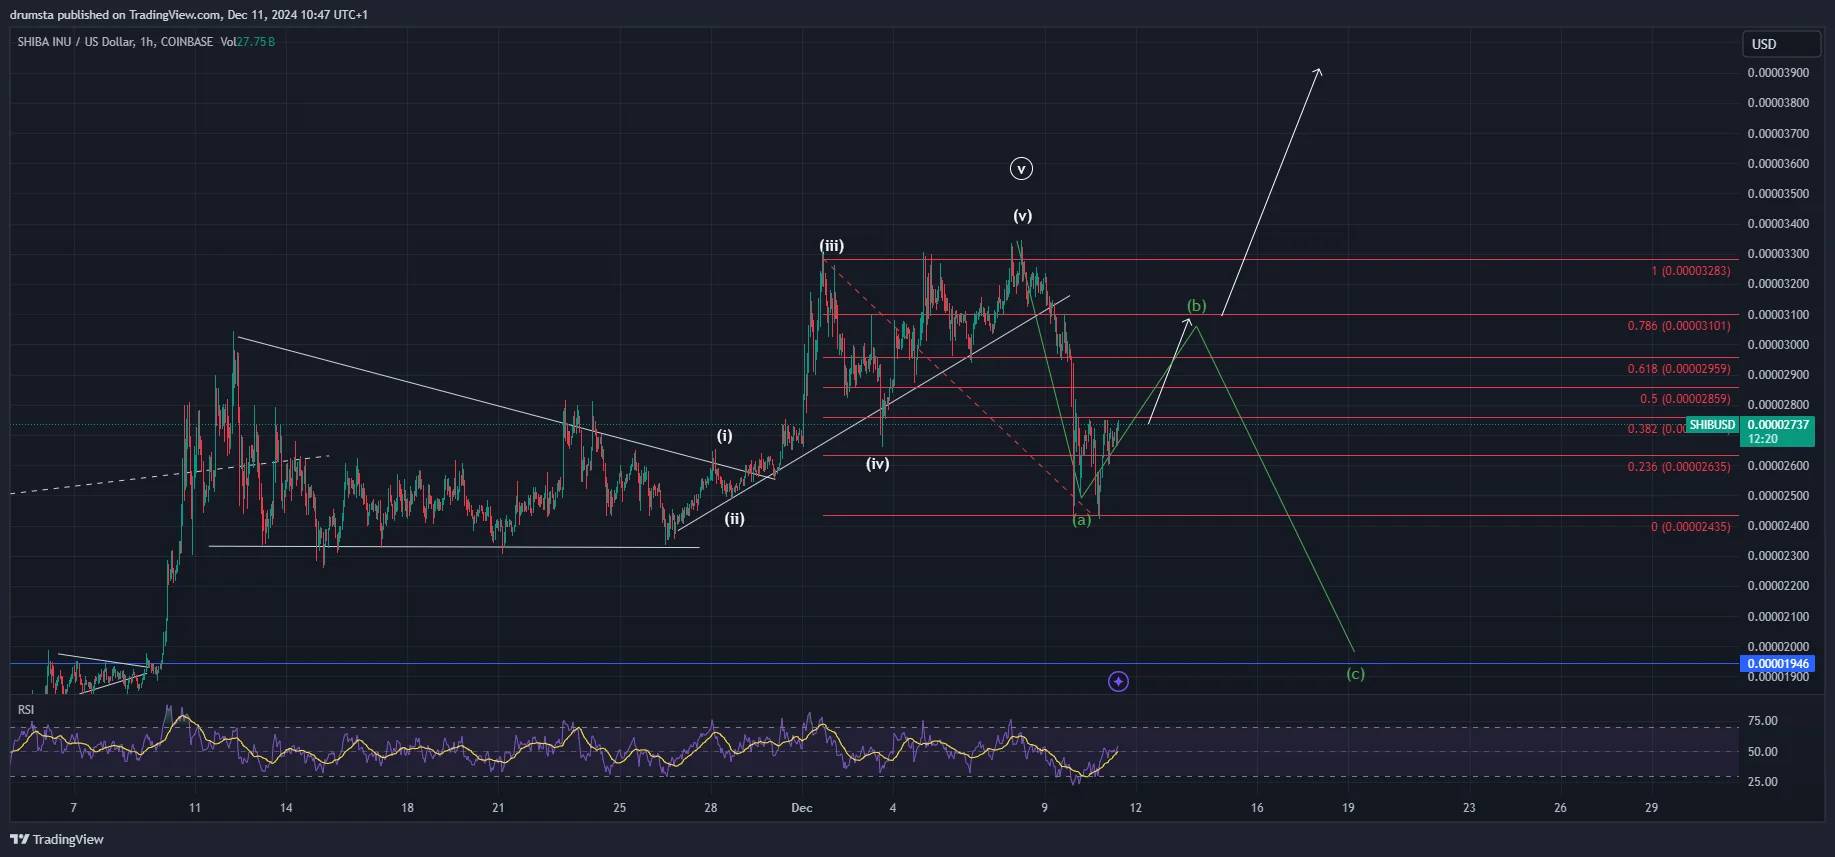
Shiba Inu (SHIB) has recently completed an impulsive wave structure, peaking near $0.00003283 during wave (v) of its Elliott Wave count.
This rally demonstrated strong bullish momentum, breaking through key resistance levels, but has since transitioned into a corrective phase.
The correction aligns with an ABC pattern, where wave (a) has already completed a drop to $0.000027, signaling the potential for a short-term bounce in wave (b). The hourly RSI is recovering from oversold levels, indicating reduced bearish momentum.
SHIBUSD more room for the upside, but a larger correction might be developing | Credit: Nikola Lazic/TradingView
The ongoing correction appears to form a zigzag ABC structure, with wave (b) likely testing the 0.618 Fibonacci retracement levels at $0.00002959. This move could encounter resistance at these levels before another leg down in wave (c) develops.
Wave (c) is expected to target the 0.00002350 region, corresponding to the 1.0 Fibonacci extension of wave (a). This will provide a strong support zone for continuing the broader uptrend.
Should wave (c) materialize, the price could stabilize near the psychological level of $0.00002000, marking a potential bottom for the correction.
However, a breakout above $0.000031 would invalidate the bearish corrective structure and signal a continuation of the bullish rally.
Traders should monitor the price’s reaction to Fibonacci levels and descending trendline resistance to further confirm the trend’s direction.
Key Levels to Watch
Support Levels:
$0.00002700: Wave (a) low and immediate support zone.
$0.00002350: Key support aligned with the 1.0 Fibonacci extension of wave (a).
$0.00002000: Psychological level and potential bottom for wave (c).
Resistance Levels:
$0.00002859: 0.382 Fibonacci retracement, critical resistance for wave (b).
$0.00002959: 0.618 Fibonacci retracement, likely resistance during wave (b).
$0.00003100: Descending trendline and previous structural resistance.
$0.00003283: Recent peak; a breakout above this signals a bullish continuation.
Disclaimer:
The information provided in this article is for informational purposes only. It is not intended to be, nor should it be construed as, financial advice. We do not make any warranties regarding the completeness, reliability, or accuracy of this information. All investments involve risk, and past performance does not guarantee future results. We recommend consulting a financial advisor before making any investment decisions.
Nikola Lazic is a cryptocurrency analyst and investor working in the industry since 2017. He holds a bachelor's degree in Sociology, which enables him to better understand the psychology behind the crowd´s positioning. Consequently his preferred analytical tool is Elliott Wave Theory in combination with price action analysis.
Combining his experience in trading and investing with knowledge in content writing he strives to bring the most accurate and actionable information.