BLUR is down 22% since its recent peak signaling a correction is likely developing. More sideways movement expected in the short term.
Share
Key Takeaways
Peaked at $0.45, confirming a strong bullish impulse.
Testing $0.31, aligning with the 0.786 Fibonacci retracement.
Signals a healthy correction and potential preparation for wave (v).
Blur (BLUR) has recently shown strong bullish momentum, completing wave (iii) of its Elliott Wave structure with a peak at $0.45.
The price made a sharp downturn and is now likely undergoing a correction. Further stabilization is awaited, but the invalidation zone is close, potentially questioning the bullish outlook.
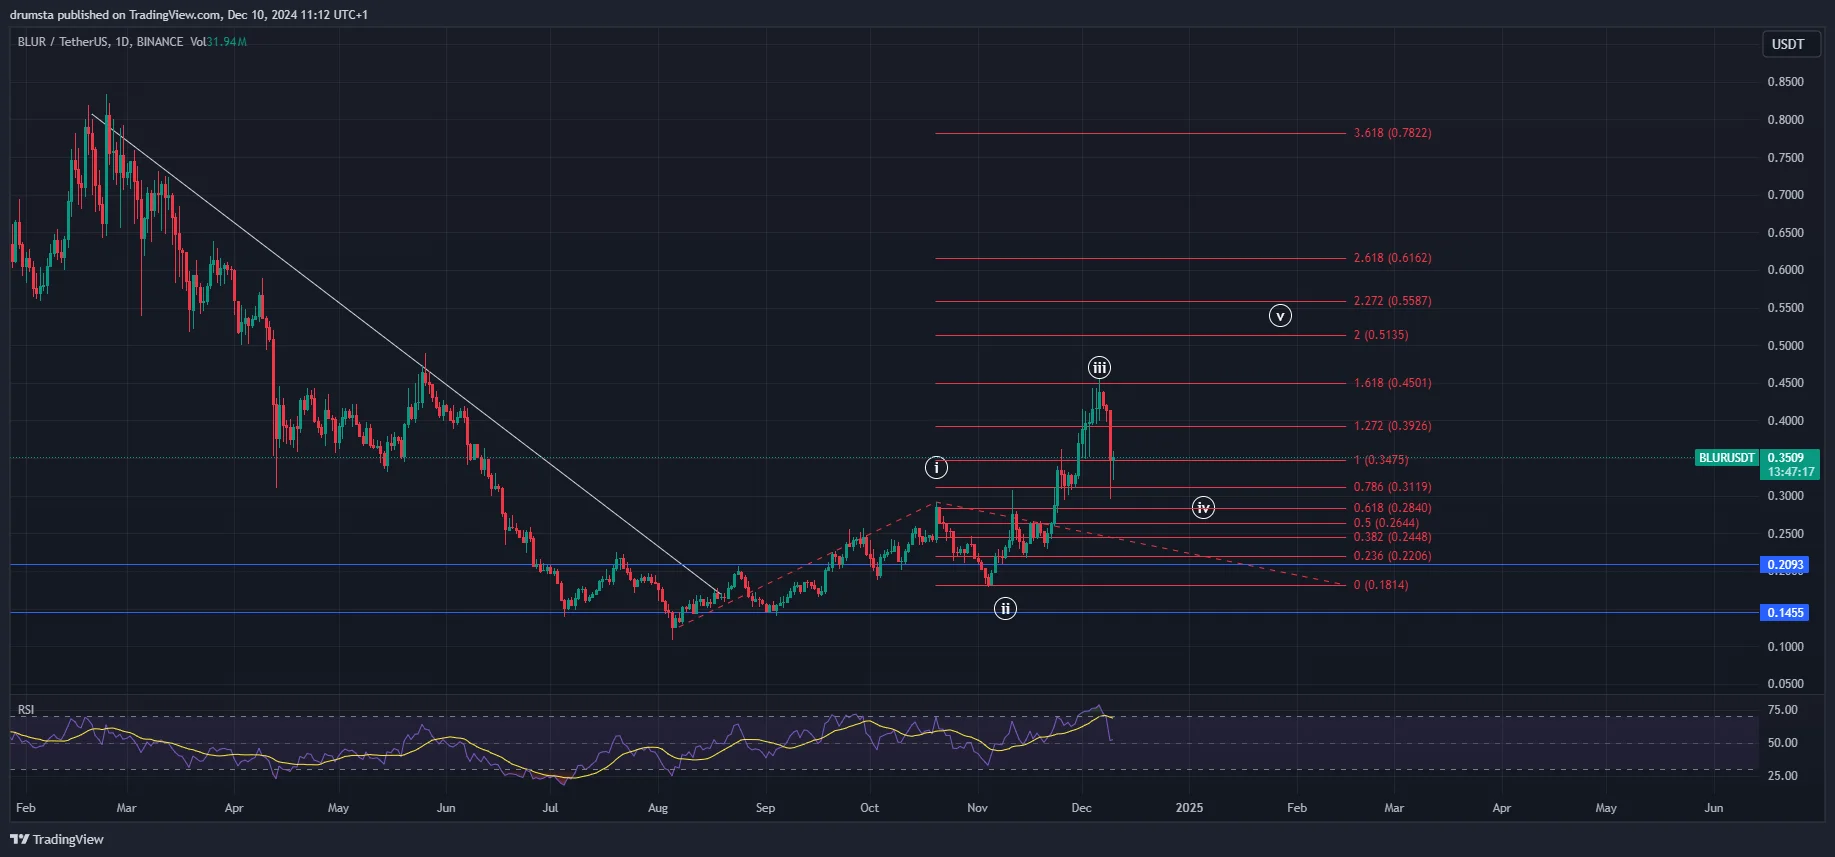
BLUR has recently completed a significant upward move, marking the completion of wave (iii) in its Elliott Wave structure.
This rally peaked near $0.45 on Dec. 7, propelled by strong momentum, breaking key resistance levels and confirming a bullish continuation pattern.
BLURUSD sharp downturn seen | Credit: Nikola Lazic/TradingView
However, the price has since entered a corrective phase, retracing towards the Fibonacci levels, signaling wave onset (iv).
Currently, BLUR is testing the 0.786 Fibonacci retracement level near $0.31, a critical support zone for the ongoing correction.
The descending Relative Strength Index (RSI) from overbought territory further validates the corrective pullback, suggesting room for additional consolidation before the next bullish leg.
If this support level holds, the price could stabilize and prepare for wave (v) toward new highs.
Key Observations
Wave (iii) Completion: The price peaked at $0.45, signaling the end of wave (iii).
Wave (iv) Correction: The price is retracing, testing the 0.786 Fibonacci level at $0.31.
RSI Cooling: RSI has declined from overbought levels, indicating a healthy correction phase.
BLUR Price Prediction
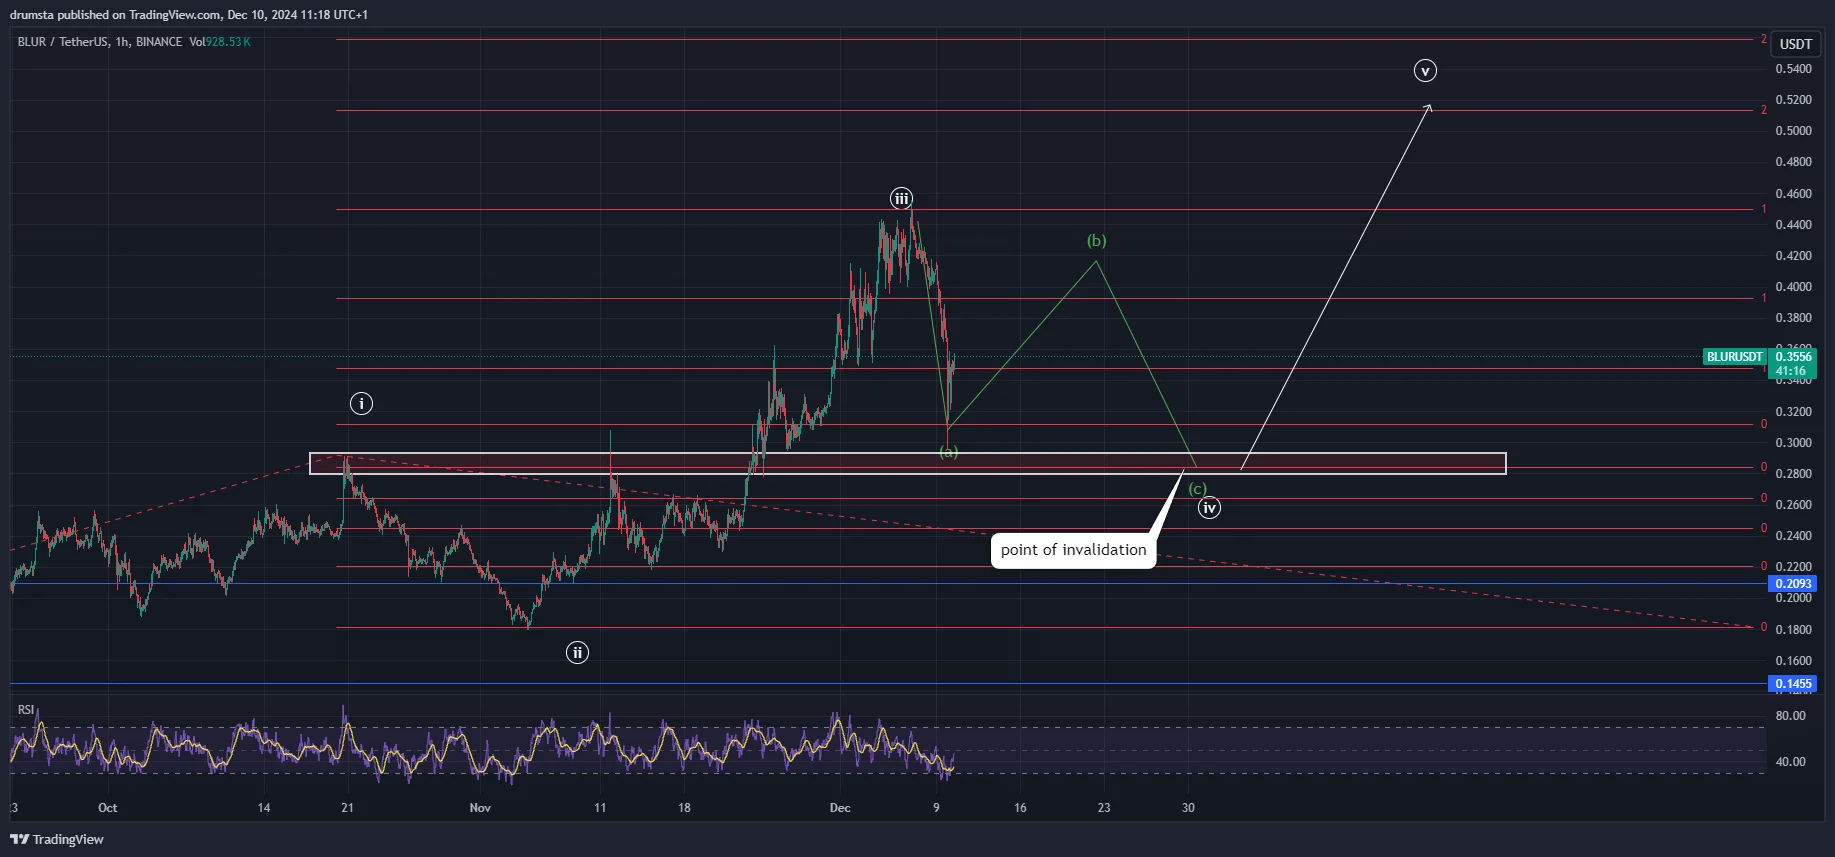
The hourly chart shows that BLUR is currently in a corrective wave (iv) following its impulsive wave (iii) completion, which peaked at $0.45.
The retracement lowered the price to a low of $0.29 on Dec. 9 but quickly spiked up. It currently trades at $0.35 – 22% lower than its recent high.
BLURUSD likely developing an ABC correction | Credit: Nikola Lazic/TradingView
This pullback aligns with Elliott Wave principles, where wave (iv) typically retraces part of the wave (iii) but avoids entering wave (i) territory, maintaining a bullish outlook.
The chart indicates that the price forms an ABC correction within wave (iv). The low at $0.29 marks wave (a), while wave (b) could test resistance near $0.38 before wave (c) potentially retests support closer to $0.28.
A deeper retracement toward $0.24 remains possible, but it would still align with the broader bullish structure as long as the point of invalidation near $0.22 holds.
A breakout from the correction will likely initiate wave (v), targeting Fibonacci extensions of wave (iii). Potential targets for wave (v) include $0.51 (2.0 Fib extension) and $0.55 (2.272 Fib extension). Conversely, a breakdown below $0.22 would invalidate the wave count and suggest a deeper bearish trend.
Key Levels to Watch
Support Levels:
$0.31 (0.5 Fibonacci): Immediate support is crucial for wave (iv) stabilization.
$0.28 (0.618 Fibonacci): Strong support level and likely target for wave (c).
$0.22: Critical point of invalidation for the bullish wave count.
Resistance Levels:
$0.38: Likely wave (b) resistance within the corrective structure.
$0.45: Previous high and a key wave (v) breakout level.
$0.51 and $0.55: Fibonacci extensions and targets for wave (v).
Disclaimer:
The information provided in this article is for informational purposes only. It is not intended to be, nor should it be construed as, financial advice. We do not make any warranties regarding the completeness, reliability, or accuracy of this information. All investments involve risk, and past performance does not guarantee future results. We recommend consulting a financial advisor before making any investment decisions.
Nikola Lazic is a cryptocurrency analyst and investor working in the industry since 2017. He holds a bachelor's degree in Sociology, which enables him to better understand the psychology behind the crowd´s positioning. Consequently his preferred analytical tool is Elliott Wave Theory in combination with price action analysis.
Combining his experience in trading and investing with knowledge in content writing he strives to bring the most accurate and actionable information.