
On the weekly chart, SEI’s price remains confined within a descending channel.
However, the current structure suggests the altcoin may be preparing to break out of this bearish pattern.
As shown below, SEI is now approaching the upper trendline while maintaining a firm hold above support near $0.13.
This setup positions the token to test overhead resistance around $0.22.
Even with this potential shift, a quick breakout appears unlikely. Several indicators still signal caution.
For example, Holders’ Sentiment has remained in deep negative territory since August, indicating that long-term participants have not yet regained confidence.
This persistent negativity often slows bullish continuation, even when the price attempts a structural reversal.
Additionally, the Supertrend indicator reinforces this hesitation. The red trend line remains above SEI’s price, signaling that the broader trend has not yet flipped bullish.
Until the SEI coin closes decisively above this line, upward moves may face strong resistance.
Overall, while SEI’s price is showing early signs of a breakout attempt, the mixed indicator landscape suggests that any rally may unfold gradually rather than explosively.

If sentiment improves and SEI breaks through the Supertrend barrier, momentum could accelerate. Otherwise, resistance near $0.22 may cap the move.
Sentiment Imbalance Favors Upside
From an on-chain perspective, SEI’s Weighted Sentiment remains extremely negative. Traders across social and analytical platforms continue to express skepticism, reflecting a broader lack of confidence in the asset.
However, this type of sentiment imbalance often precedes a reversal.
Historically, when Weighted Sentiment becomes heavily negative while technical indicators signal a buy, the price tends to move against the prevailing mood.
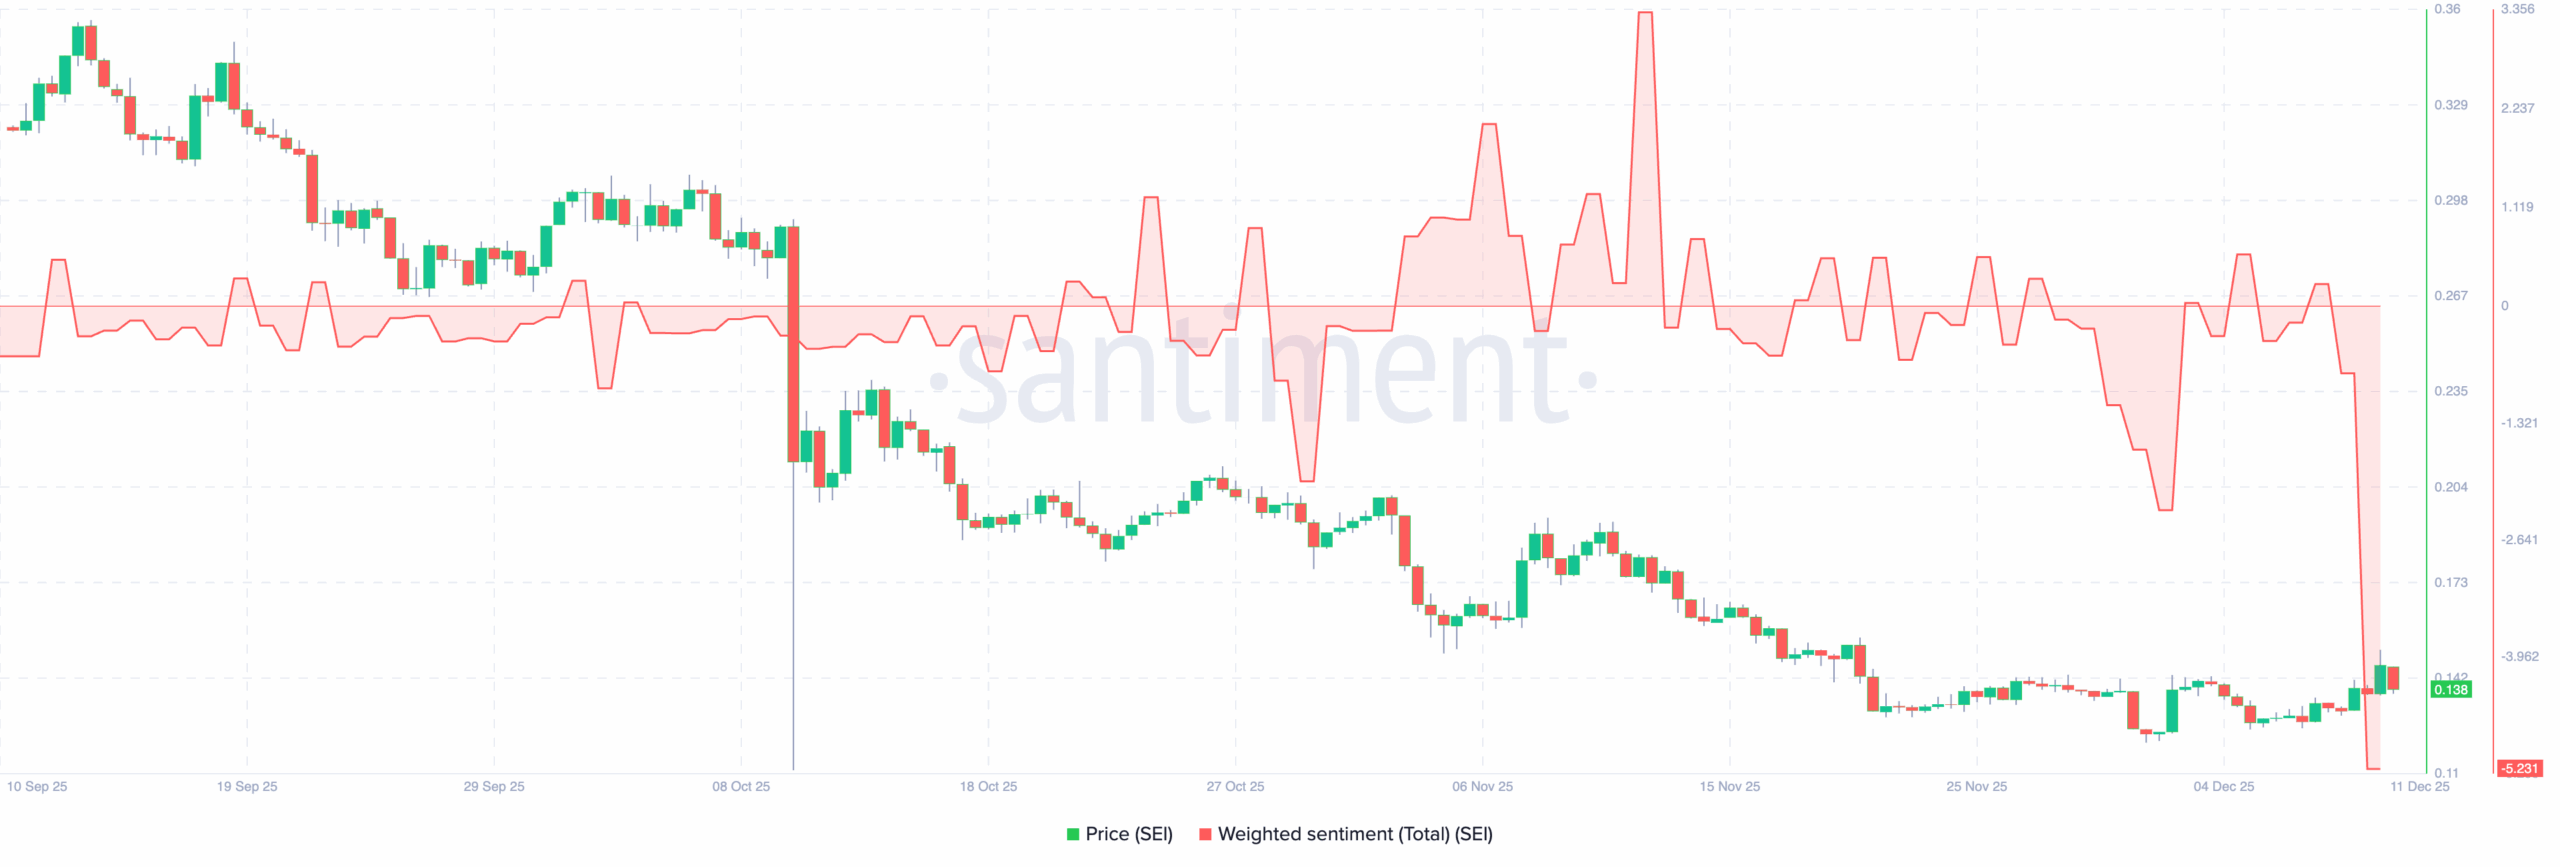
Given the SEI coin’s current setup, the negative sentiment may actually support the case for an upside move, especially if the emerging buy signal translates into stronger bullish momentum.
SEI Price Analysis: Bullish Divergence Emerges
Upon re-examining the technical setup, the daily chart indicates that SEI has formed a bullish divergence.
As shown below, the altcoin remains pinned beneath a descending resistance line, but conditions are beginning to turn in favor of the bulls.
The Moving Average Convergence Divergence (MACD) has now formed a bullish crossover, indicating that bearish momentum is fading and a trend reversal may be underway.
At the same time, the Chaikin Money Flow (CMF) has broken above the zero signal line for the first time since Nov. 10.
If these indicators continue to support the move, SEI’s price could break above its descending resistance and rally toward $0.17, which aligns closely with the 0.236 Fibonacci retracement level.
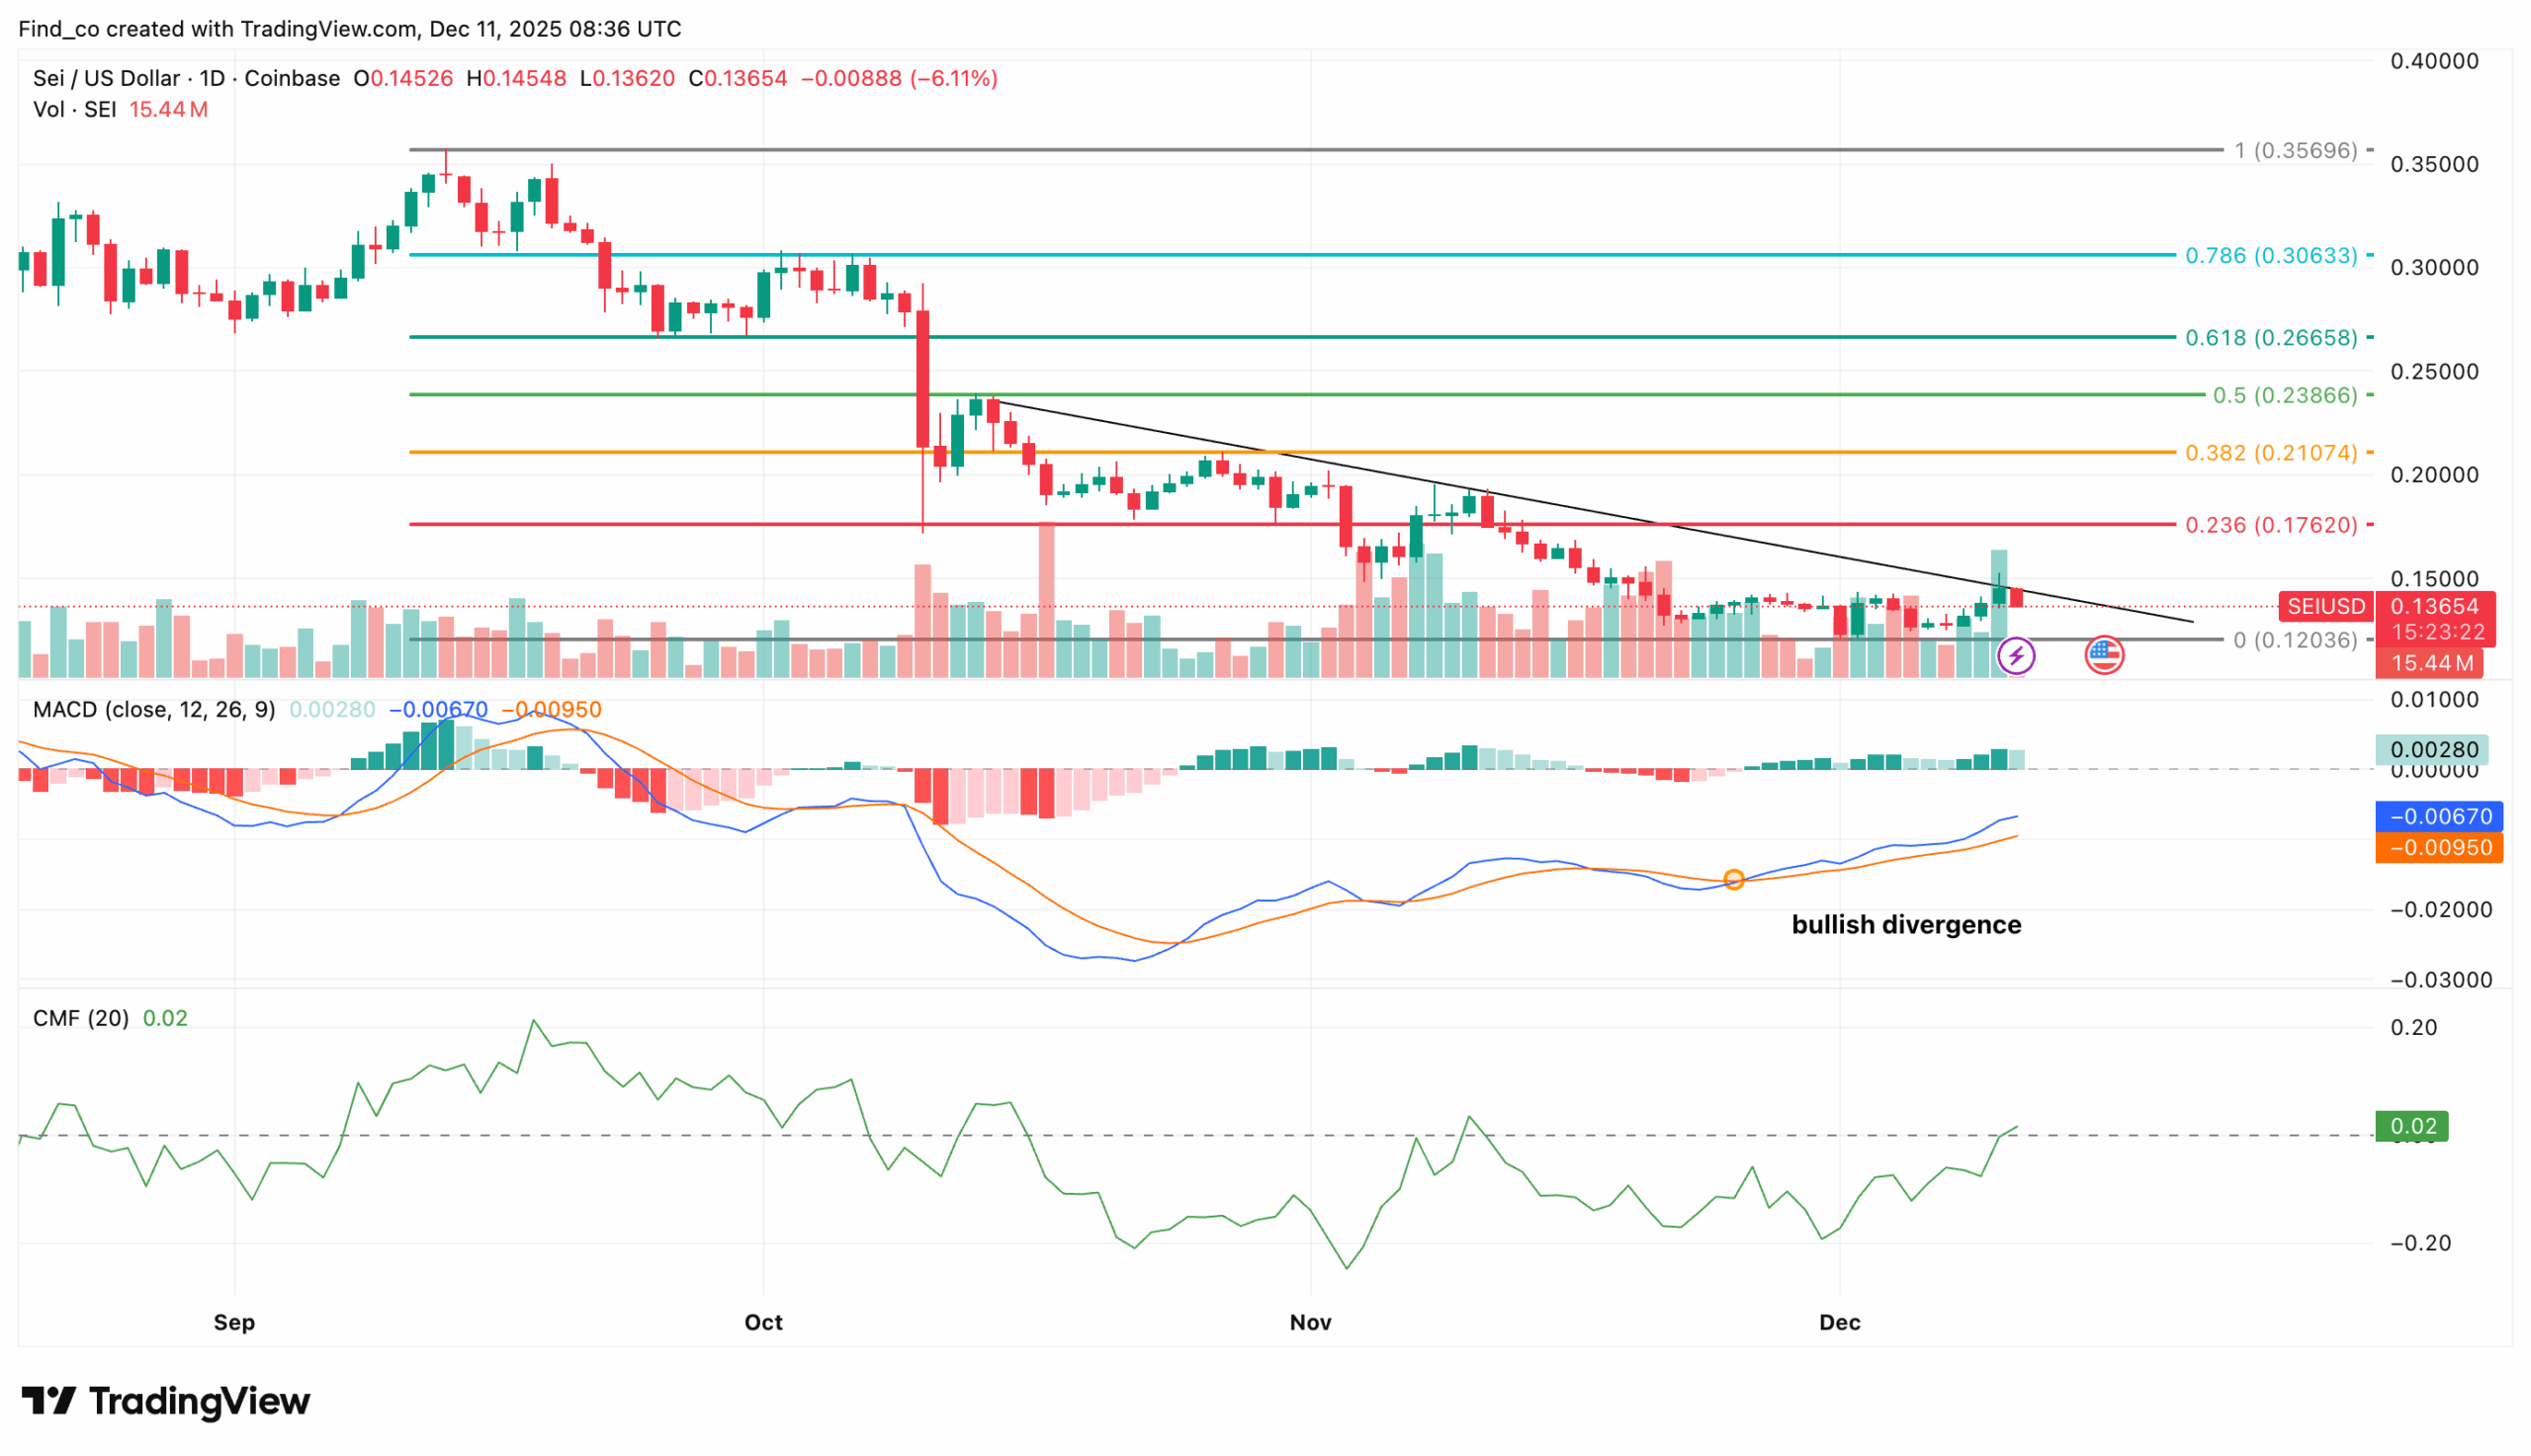
Should buying pressure intensify, the next target sits near $0.21, marking a stronger bullish extension.
However, if bears re-enter the market and overwhelm this progress, SEI could fail to breach resistance. In that scenario, the altcoin’s value may retreat toward $0.12.