SEI prepares for September rebound after bearish August | Credit: Hameem Sarwar
Share
Key Takeaways
SEI consolidates inside a symmetrical triangle, with support at $0.28 and resistance at $0.30.
Macro catalysts strengthen the outlook, including 21Shares’ filing for a SEI exchange-traded fund.
SEI could break resistance and rally toward $0.48, though failure to sustain demand risks declines
SEI, the native cryptocurrency of the layer-1 modular blockchain project, looks set to close August with a negative return. However, with a new month approaching, SEI’s price appears poised to reverse its fortunes.
At press time, the token trades at $0.29, nearly 74% below its all-time high. Yet signs suggest that this steep deficit could begin to shrink soon.
Here’s why SEI may be preparing for a rebound.
SEI Sees Strong Support
On the 4-hour chart, SEI’s price is consolidating within a symmetrical triangle. Notably, CCN observed that the cryptocurrency has held firm above the lower trendline, avoiding a breakdown that could have deepened losses.
The chart also highlights a clear support level at $0.28, while strong resistance sits near $0.30, setting the stage for a decisive move once the triangle pattern resolves.
Get These Top Crypto Casino Offers Now!
Sponsored
Disclosure
We sometimes use affiliate links in our content, when clicking on those we might receive a commission at no extra cost to you. By using this website you agree to our terms and conditions and privacy policy.
Despite SEI’s sideways movement, the MACD remains in positive territory, signaling underlying bullish momentum. This outlook is further reinforced by a bullish EMA crossover, where the 12 EMA (blue) has moved above the 26 EMA (orange).
Such a crossover typically suggests that short-term strength is overtaking longer-term weakness, increasing the probability of an upward breakout.
Should the MACD remain positive, SEI’s price might not just break the $0.30 resistance but also flirt with the obstacle at $0.33.
Macro Winds Favor It
Beyond the technical setup, macro developments are also tilting in SEI’s favor.
First, cryptocurrency could benefit from the U.S. government’s decision to collaborate with Pyth Network to bring economic data on-chain, strengthening the broader ecosystem in which SEI operates.
In addition, asset management giant 21Shares has disclosed that it filed with the U.S. Securities and Exchange Commission (SEC) for an SEI exchange-traded fund (ETF).
If approved, such a product could expand institutional exposure to SEI and legitimize the project in traditional financial markets.
“We’re excited to announce that we’ve filed with the SEC for a SEI ETF in the U.S. – a key milestone in our vision to expand exchange-traded access to Sei Network, 21Shares disclosed.”
SEI Price Forecast: Gains Ahead
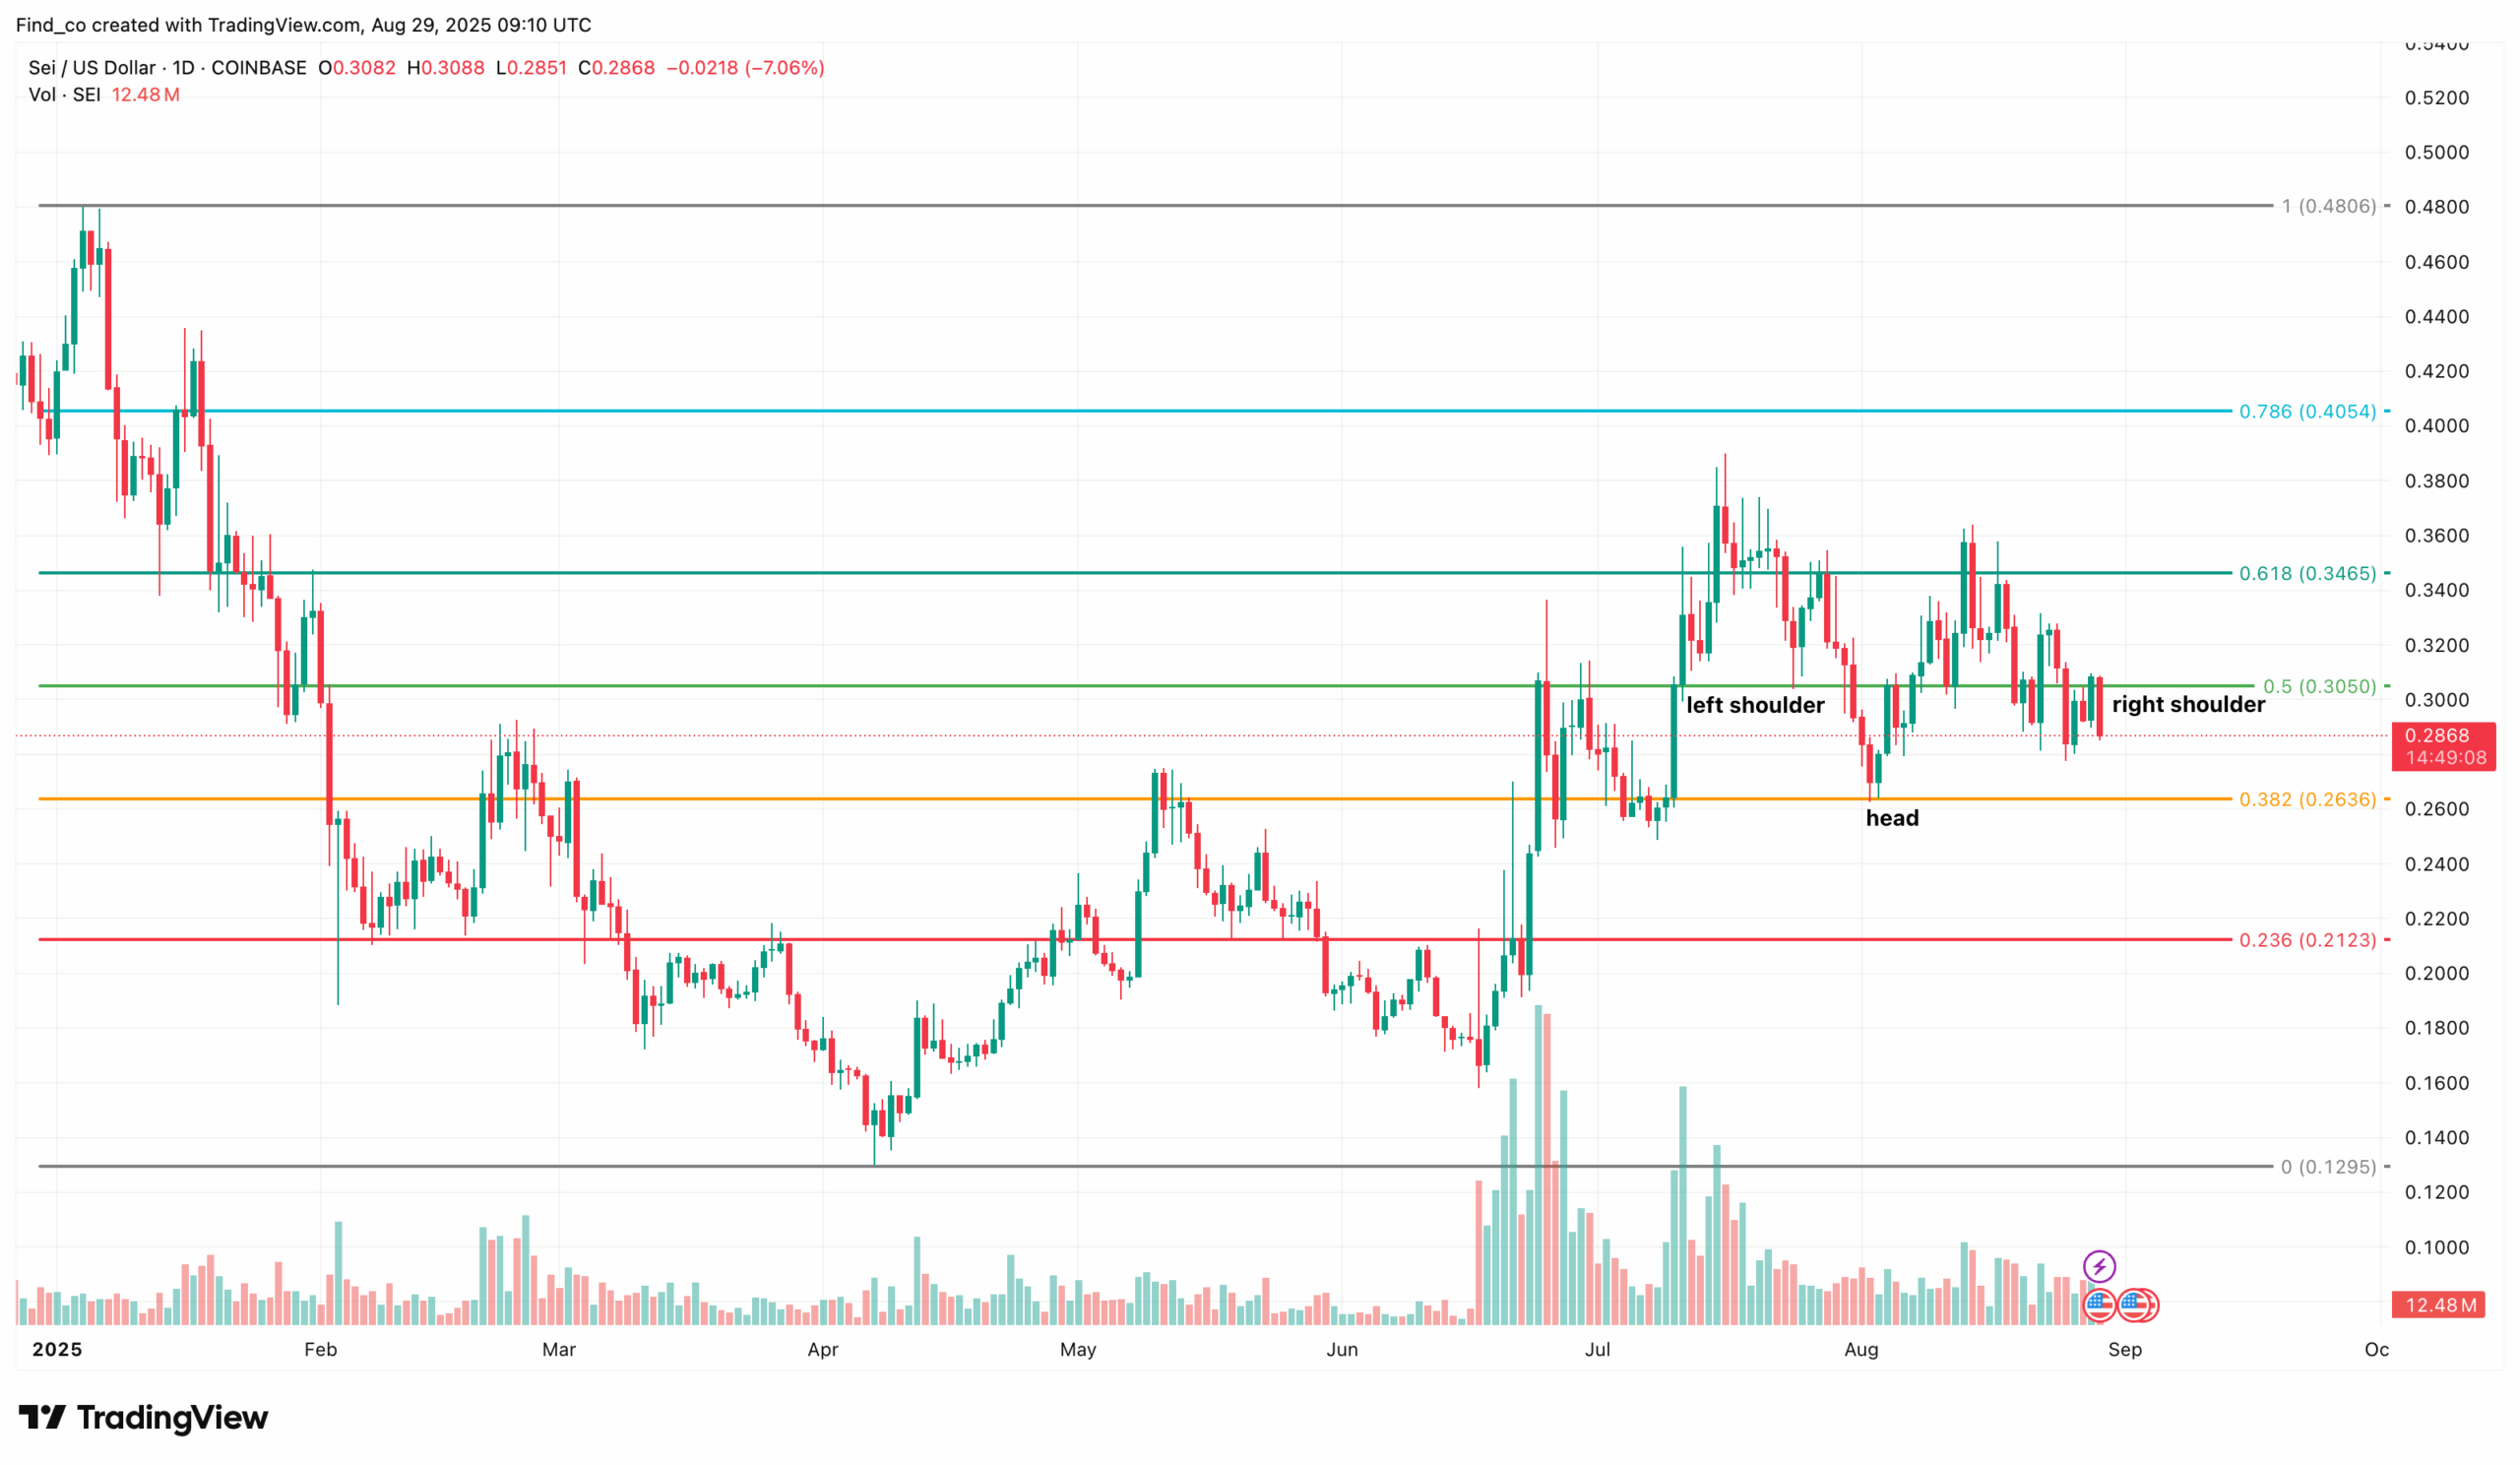
From a technical perspective on the daily chart, SEI’s price has formed an inverse head-and-shoulders pattern, a setup often viewed as a bullish reversal signal.
This formation suggests the token is preparing to challenge resistance at $0.35. If bulls manage a successful breakout, SEI could rally toward $0.48 — an upside of roughly 40% from its current value.
In a highly bullish market condition, SEI might experience a rally toward $1. However, if selling pressure increases, the altcoin might fail to break out.
Disclaimer:
The information provided in this article is for informational purposes only. It is not intended to be, nor should it be construed as, financial advice. We do not make any warranties regarding the completeness, reliability, or accuracy of this information. All investments involve risk, and past performance does not guarantee future results. We recommend consulting a financial advisor before making any investment decisions.
Victor Olanrewaju is a crypto analyst and reporter at CCN with deep roots in on-chain research and technical analysis. His crypto journey began in 2017, but it was the 2020 Uniswap airdrop that sparked a full-time pivot into the space.
With a foundation in copywriting, Victor honed his craft creating high-converting content for leading crypto brokers — most notably an XRP price prediction that ranked #1 on Google during the 2021 bull run.
He later joined AMBCrypto in 2022, where he combined storytelling with technical and on-chain analysis to cover key market narratives.
In 2024, he expanded his expertise at BeInCrypto, collaborating with analysts and using tools like Glassnode, Santiment, and IntoTheBlock to break down Bitcoin and altcoin trends.
At CCN, Victor covers the top cryptocurrencies, memecoins, macro shifts, blending real-time insights with deep-dive metrics.
He holds a Bachelor’s degree in Physics from the University of Ibadan, equipping him to simplify complex data for a wide audience. Follow his work or connect on LinkedIn or X.