Is the River rally over? | Credit: Veronica Cestari
Share
Key Takeaways
RIVER experienced a 22% price collapse despite being listed on Hyperliquid.
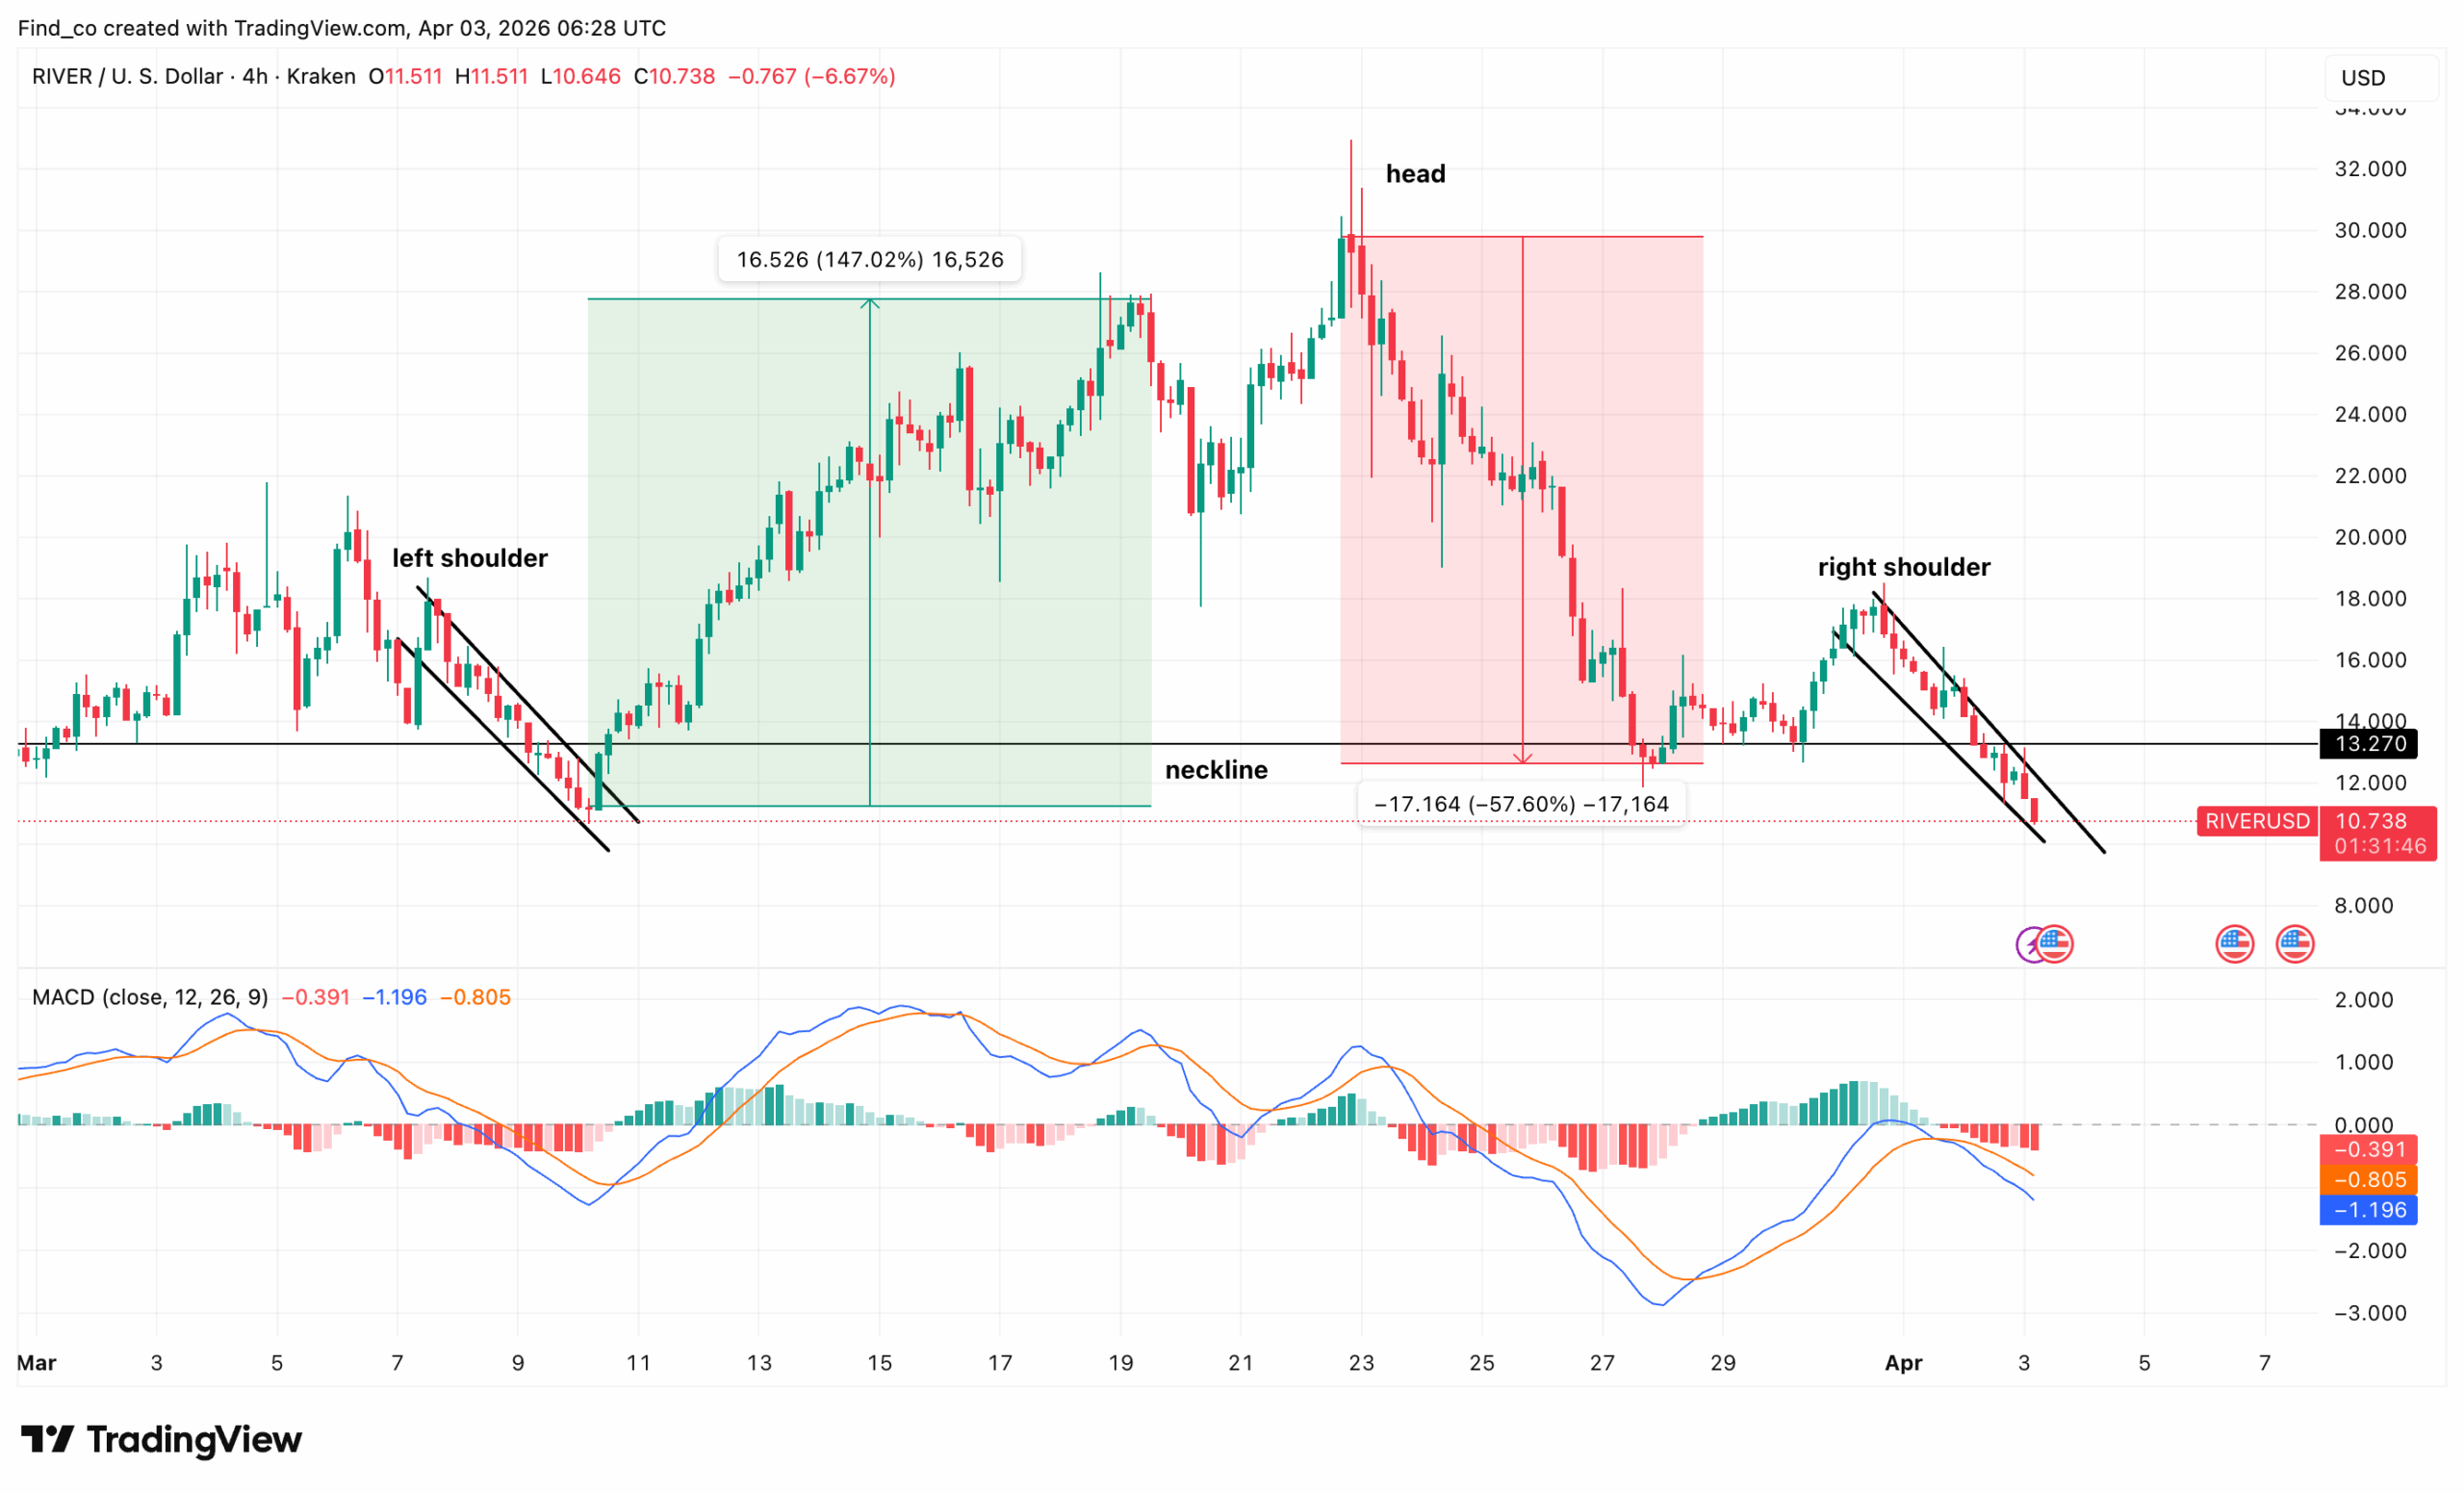
On the 4-hour chart, RIVER confirmed a textbook head-and-shoulders pattern.
Technical indicators reinforce the bearish outlook, but bulls need to reclaim resistance.
RIVER was expected to rally. Instead, it crashed.
Despite securing a spot listing on Hyperliquid, the token plunged 22%, leaving traders confused and raising fresh concerns about its short-term outlook.
So, what exactly went wrong with the RIVER crypto, and what lies ahead for the price?
RIVER Price Analysis: ‘Sell-the-News’ Reaction
At first, the listing looked bullish. Typically, exchange listings bring liquidity, visibility, and demand.
However, the opposite happened. Rather than pushing prices higher, the market reacted with heavy selling. This suggests a classic “sell-the-news” event, where traders exit positions after hype peaks.
As a result, the RIVER crypto quickly lost momentum. Looking at the 4-hour chart, the Hyperliquid spot listing could not stop the breakdown.
First, the chart confirms a head-and-shoulders pattern. The left shoulder formed in early March.
Then, price pushed higher into a clear head near the $30 zone. However, the right shoulder failed to match that strength.
Then, the neckline becomes critical. The $13.27 level acted as support multiple times. However, once RIVER’s price broke below it, the structure confirmed a bearish reversal. As a result, took control.
Moreover, the measured move adds weight to the decline. The projected drop from the neckline points to adownside extension.
At the same time, momentum confirms the breakdown. The MACD trends below the zero line.
In addition, both lines are sloping downward. This alignment signals sustained bearish momentum rather than a temporary dip.
Meanwhile, the RIVER crypto price action shows continuation toward the downside, not stabilization.
The right shoulder breakdown transitions directly into a steep selloff. Therefore, buying strength has faded.
Looking ahead, the neckline near $13.27 now acts as resistance. Any retest of that zone could attract sellers again. Above that, the right shoulder region becomes the next barrier.
On the downside, RIVER’s price is entering a weaker support zone. The chart shows limited structure below current levels.
As a result, volatility could increase as the price searches for a new support.
Other Metrics Fall in Line
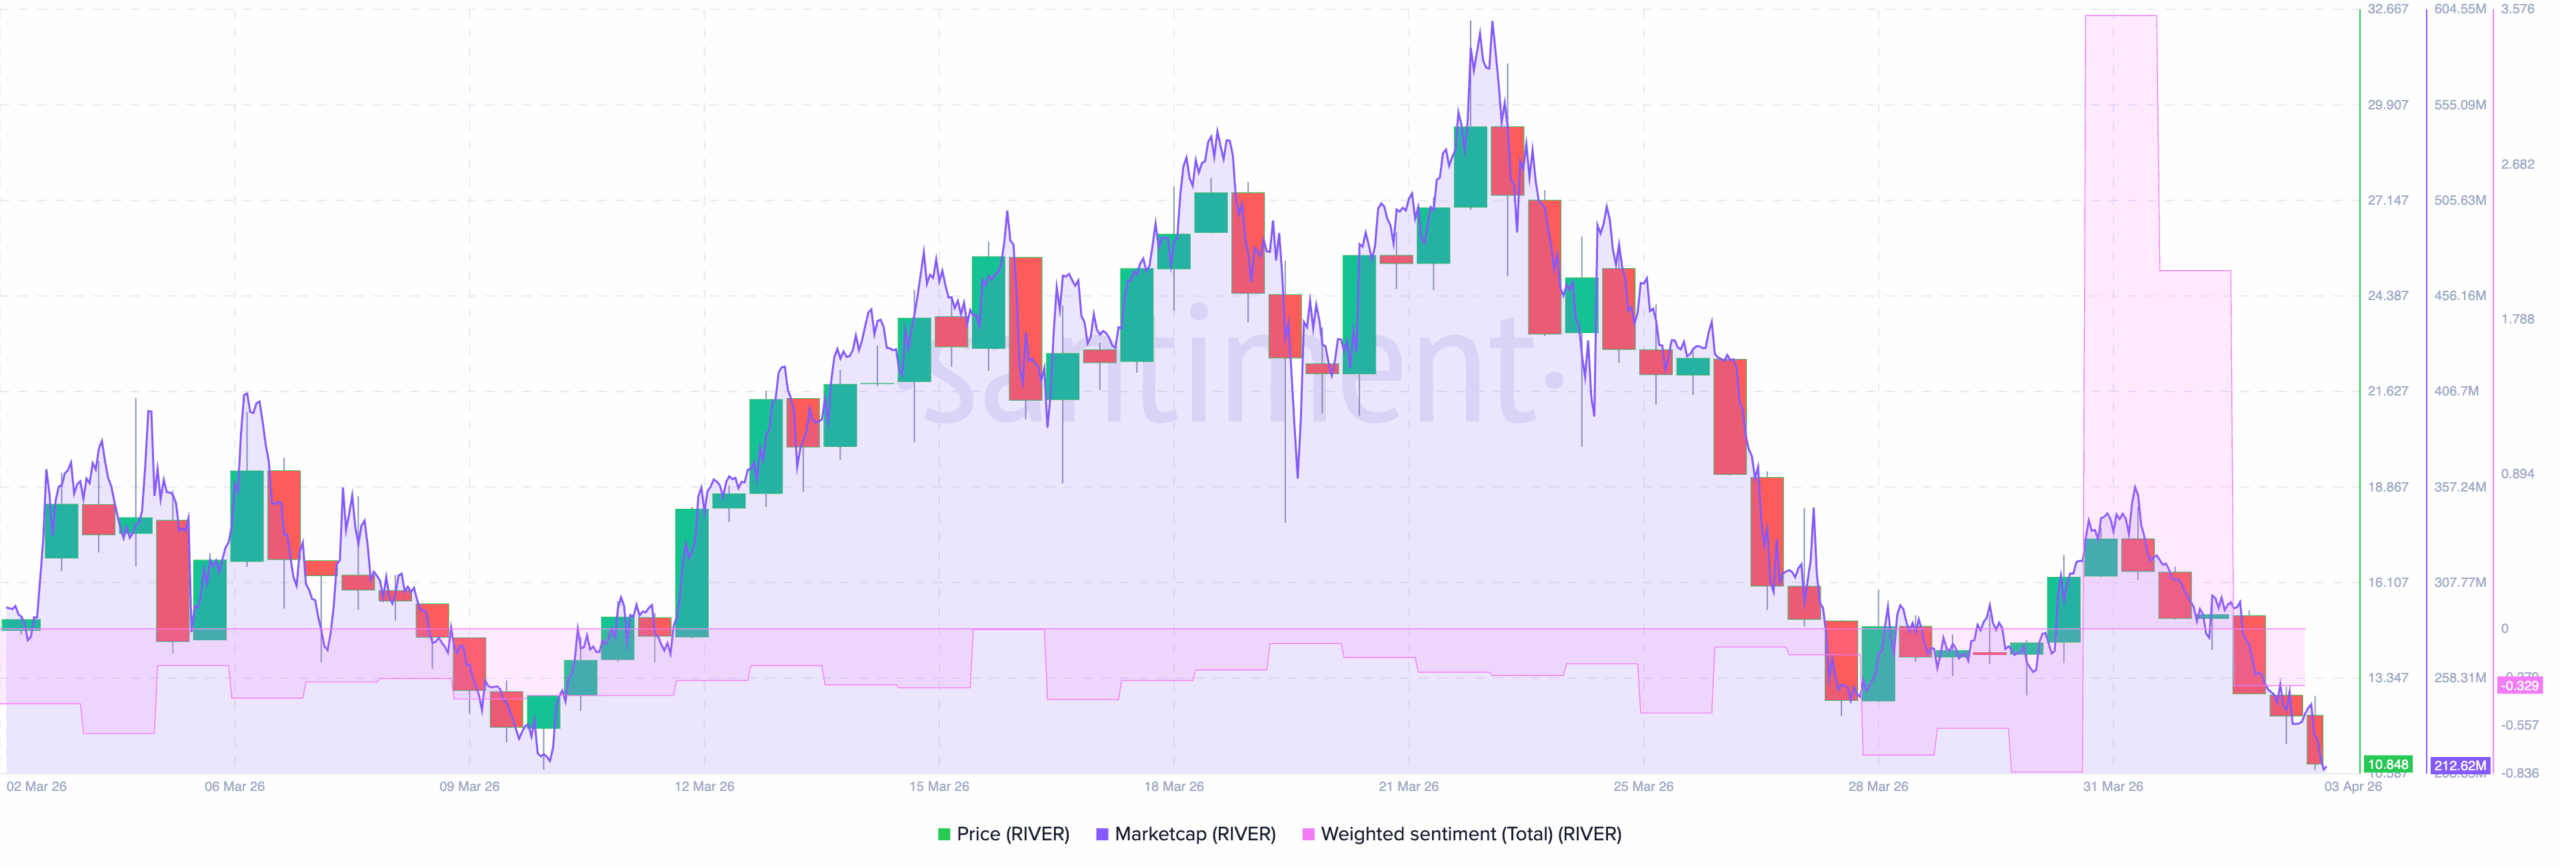
From an on-chain perspective, the RIVER weighted sentiment has dropped below the zero line.
First, price action shows a full cycle. RIVER’s price rallied strongly into mid-March. It then peaked near $30.
But as of this writing, it has dropped below $215 million.
Meanwhile, weighted sentiment adds an important layer. Sentiment improved gradually during the uptrend.
However, it failed to reach extreme optimism. Then, it turned lower before the price fully collapsed.
Then, the breakdown accelerates. Sentiment drops into negative territory. At the same time, price loses structure and sells off aggressively into late March. This confirms a transition from optimism to risk-off behavior.
Notably, the late-March bounce lacked strength as the RIVER crypto attempted a recovery around March 31.
RIVER Market Cap and Weighted Sentiment | Credit: Santiment
Now, both RIVER’s price and sentiment are trending downward.
Looking ahead, sentiment will be key. If it stabilizes and turns positive, the price could attempt a rebound. However, if sentiment stays depressed, downside pressure may continue.
RIVER Price Prediction
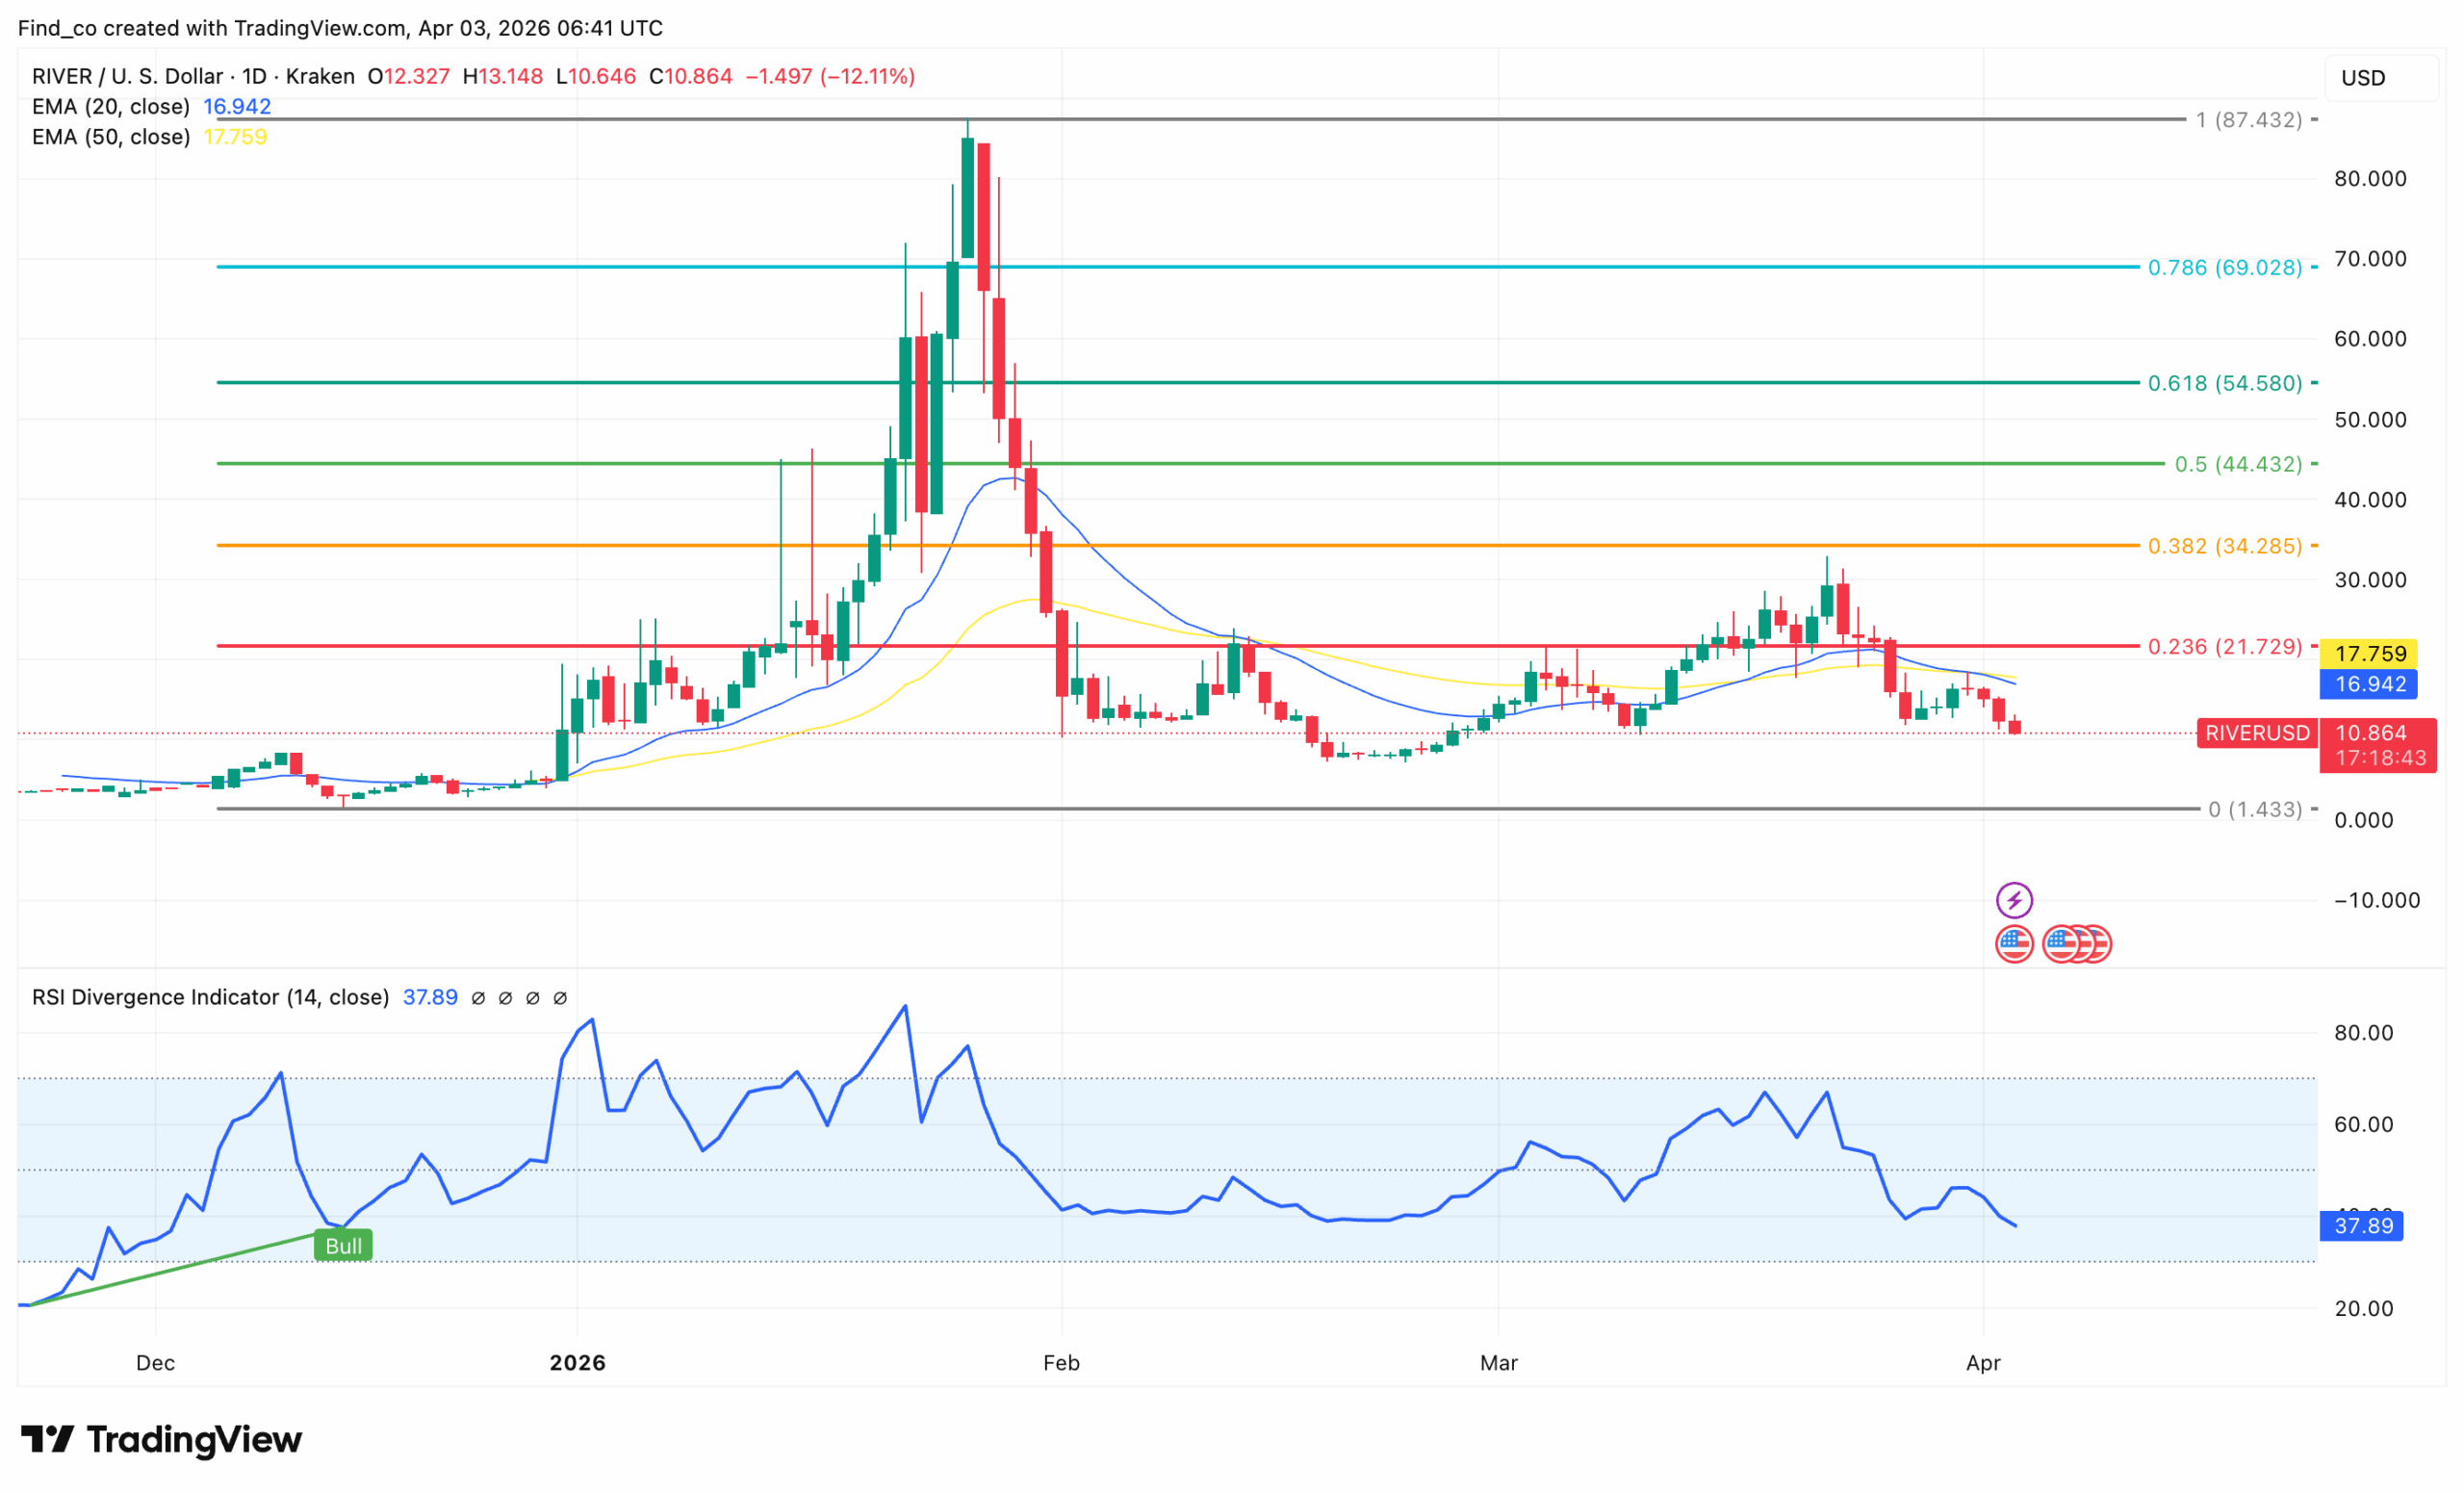
On the daily chart, RIVER has extended its downtrend, and recent price action confirms continued weakness.
First, the broader structure shows a sharp post-peak collapse. Earlier in the year, RIVER’s price surged aggressively.
However, that move has reversed. Since then, RIVER has failed to reclaim higher Fibonacci levels, signaling a shift from accumulation to distribution.
Then, key resistance levels continue to cap upside. The $21.7 zone (0.236 Fib) has repeatedly rejected the price.
At the same time, moving averages reinforce the bearish trend. The 20 EMA remains below the 50 EMA.
Moreover, price trades beneath both, reflecting sustained selling pressure rather than a temporary pullback.
Meanwhile, recent price action shows another failed recovery. Late-March strength pushed the price toward the $25–$30 region.
But sellers took control, driving the altcoin’s price toward $10.
Momentum also weakens again. RSI sits around 37 and trends downward. While not deeply oversold, it shows fading demand.
Therefore, there is still room for further downside.
Notably, the market is forming lower highs across multiple swings. Each bounce is weaker than the last.
If this zone breaks, the RIVER crypto price could revisit deeper levels with limited structure below.
On the upside, $17–$21 remains a strong resistance band that must be reclaimed to shift sentiment. However, that will only occur if buying pressure increases.
Disclaimer:
The views, thoughts, and opinions expressed in the article belong solely to the author, and not necessarily to CCN, its management, employees, or affiliates. This content is for informational purposes only and should not be considered professional advice.
Victor Olanrewaju is a crypto analyst and reporter at CCN with deep roots in on-chain research and technical analysis. His crypto journey began in 2017, but it was the 2020 Uniswap airdrop that sparked a full-time pivot into the space.
With a foundation in copywriting, Victor honed his craft creating high-converting content for leading crypto brokers — most notably an XRP price prediction that ranked #1 on Google during the 2021 bull run.
He later joined AMBCrypto in 2022, where he combined storytelling with technical and on-chain analysis to cover key market narratives.
In 2024, he expanded his expertise at BeInCrypto, collaborating with analysts and using tools like Glassnode, Santiment, and IntoTheBlock to break down Bitcoin and altcoin trends.
At CCN, Victor covers the top cryptocurrencies, memecoins, macro shifts, blending real-time insights with deep-dive metrics.
He holds a Bachelor’s degree in Physics from the University of Ibadan, equipping him to simplify complex data for a wide audience. Follow his work or connect on LinkedIn or X.