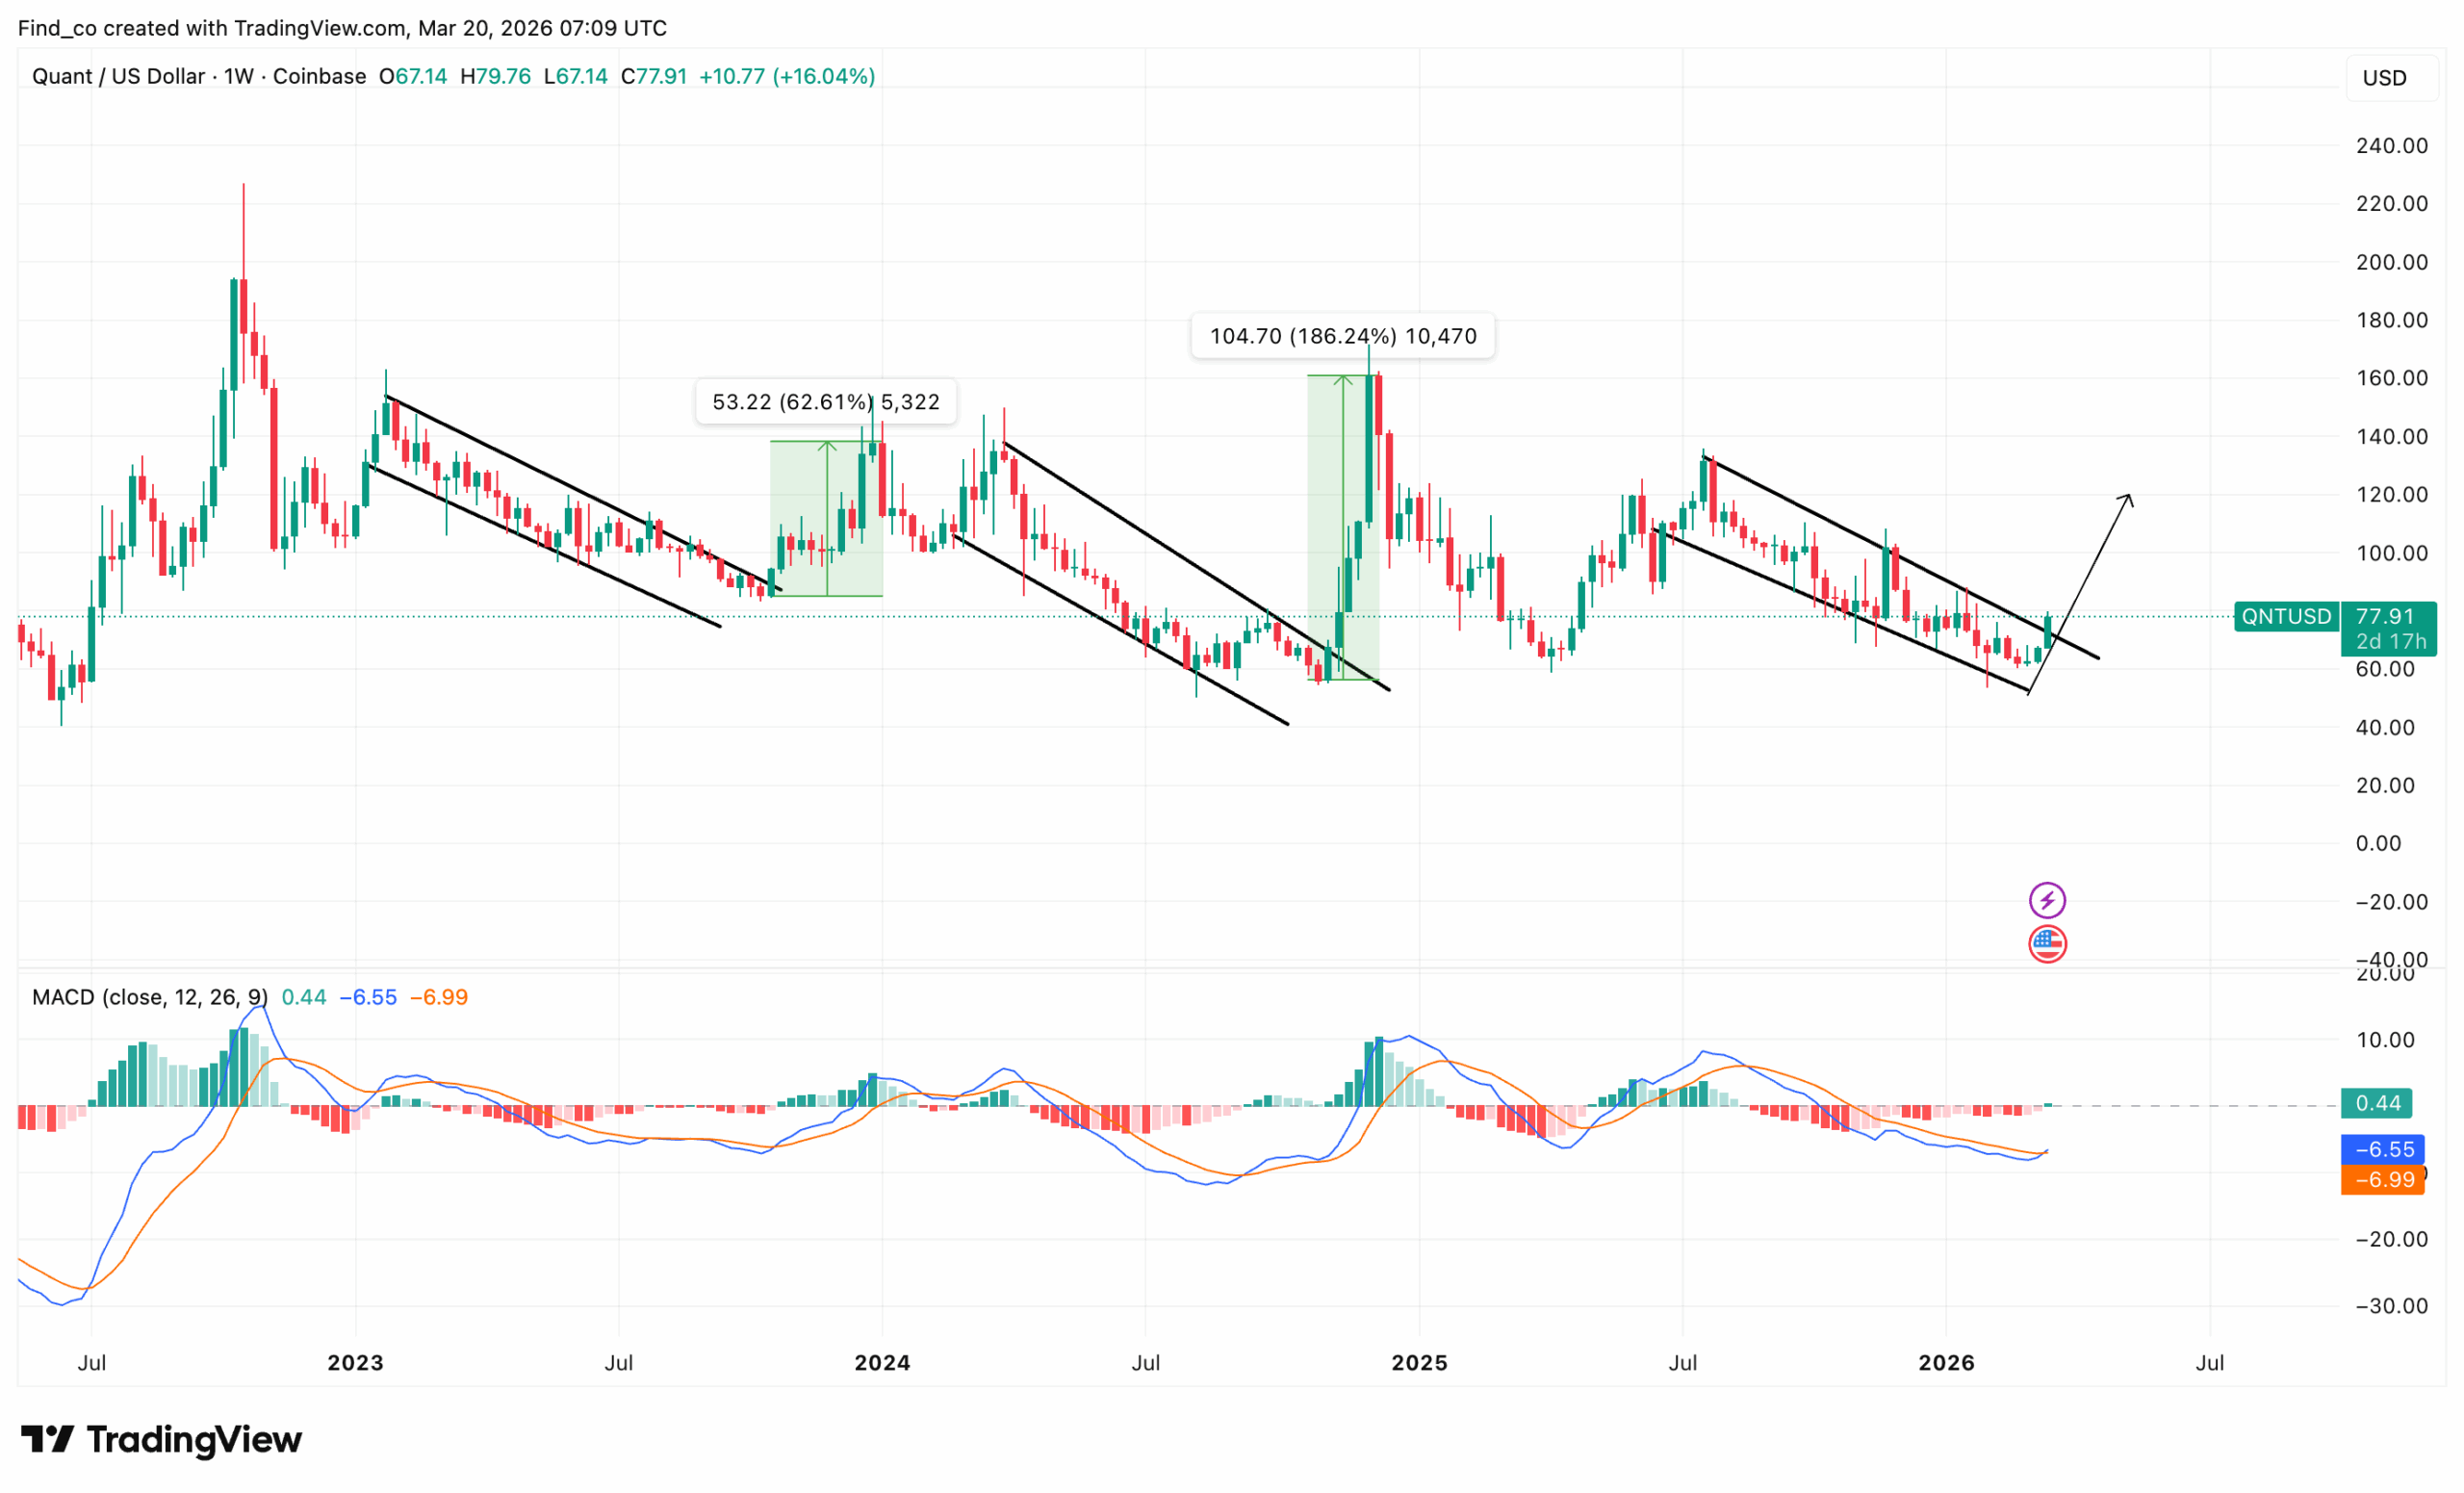
The first cycle (late 2022 into early 2024) saw the channel break and price surge 62.61% to $148.
The second cycle (2024 into early 2025 ) produced a 186.24% rally to $168. Each successive breakout has been larger in magnitude than the prior one.
The third channel (running from mid-2025 through today) has just broken. Amid this, the MACD line (0.44) has crossed above the signal (-6.55) on the weekly timeframe.
However, the signal line remains deeply negative at -6.99, meaning the crossover is early and fresh. That’s exactly where the prior two cycles were when they launched.
Consequently, if the pattern holds, the measured move for QNT’s price from this breakout targets a minimum 60–120% gain from current levels.
Still Underpriced
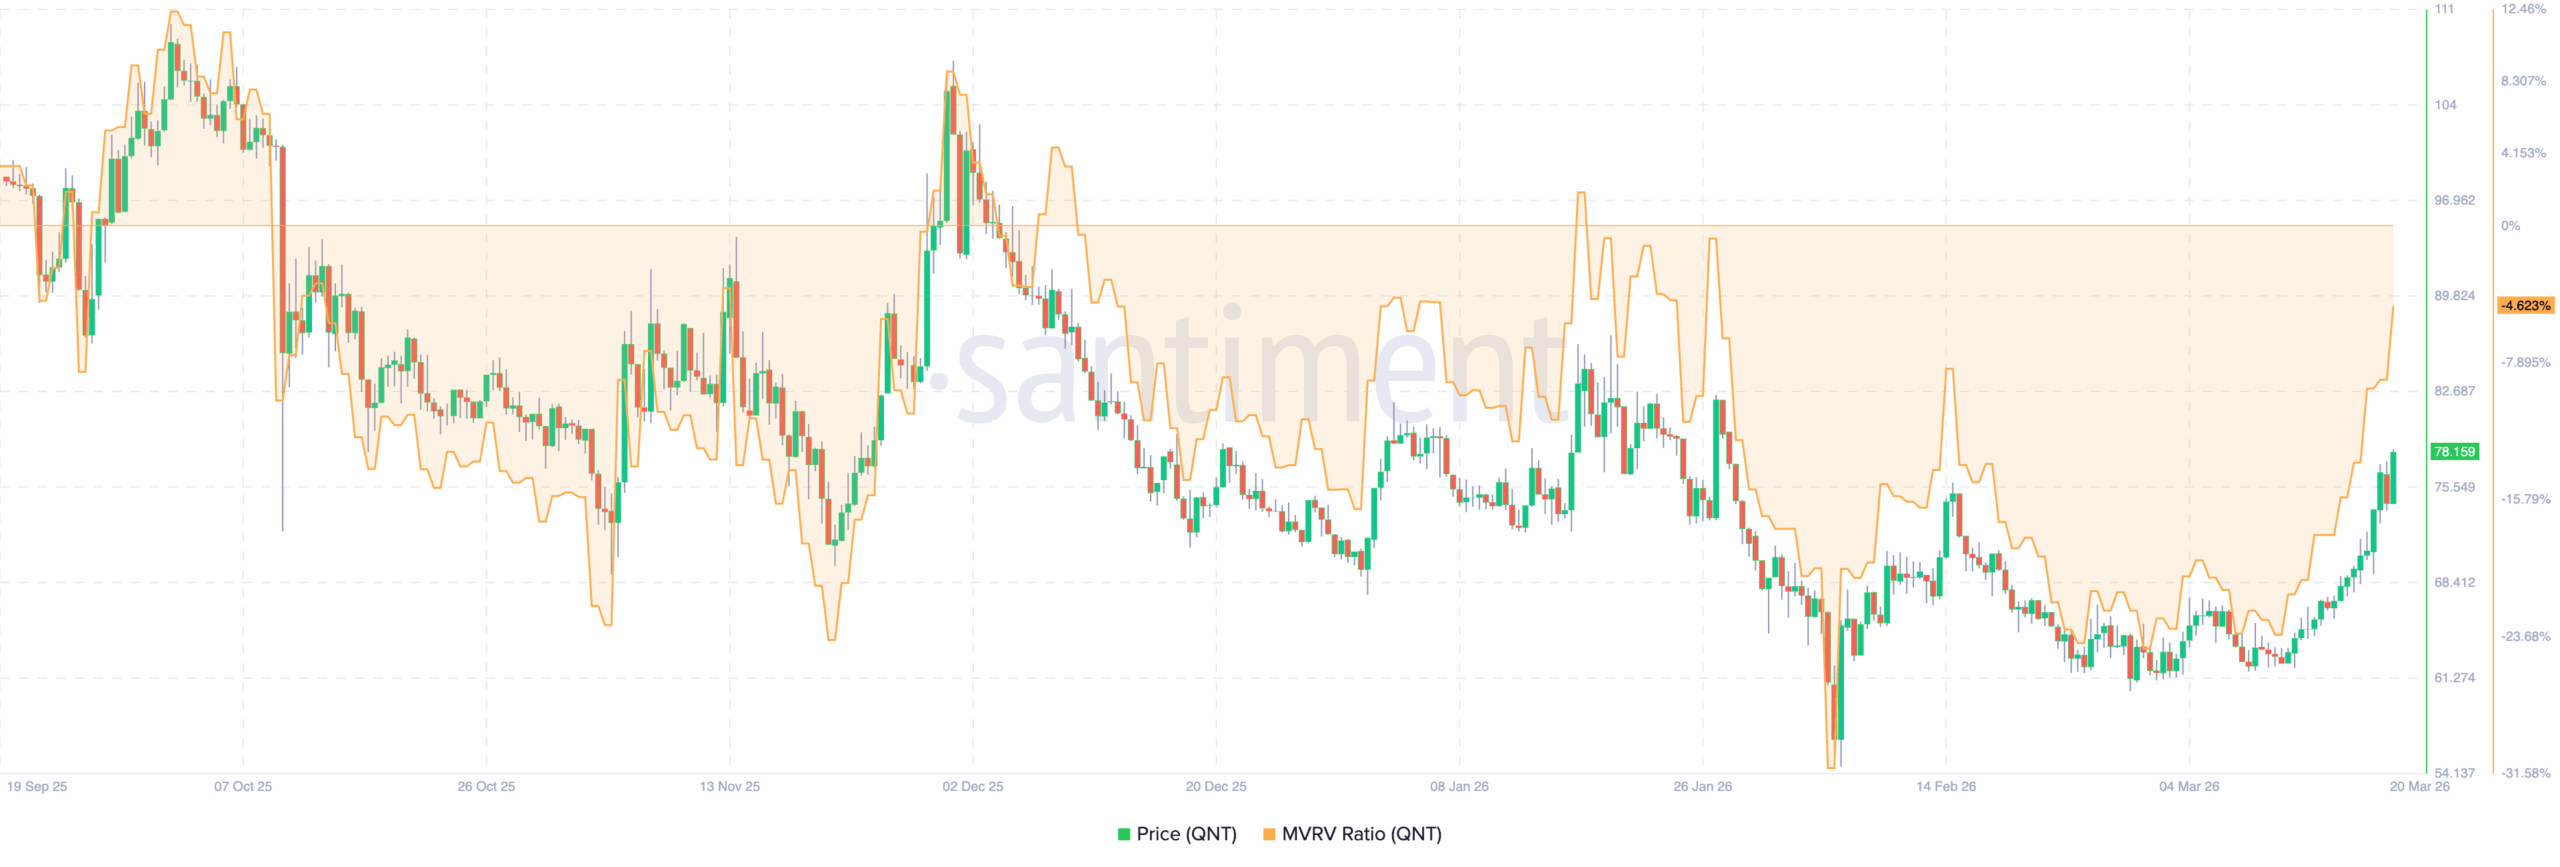
From an on-chain perspective, the MVRV chart is flashing one of the cleanest mean-reversion setups.
At the time of writing, the MVRV ratio is -4.62%, meaning the average QNT holder is barely underwater.
That reading, however, is recovering sharply. Following the Feb. 6 capitulation, which briefly pushed the ratio to approximately -31.58%, the MVRV has been steadily climbing back toward zero.
This happened as the Quant crypto price recovered from $54 toward $79.19.
As it stands, the MVRV is approaching zero from below for the first time since late January. That transition from negative to neutral to positive has historically marked the beginning of QNT’s strongest sustained price moves on this chart.
However, demand for the crypto might need to be higher to validate an extended uptrend. If that happens, QNT’s price might trade higher while the MVRV ratio could rise above zero.
QNT Price Prediction: Higher Highs
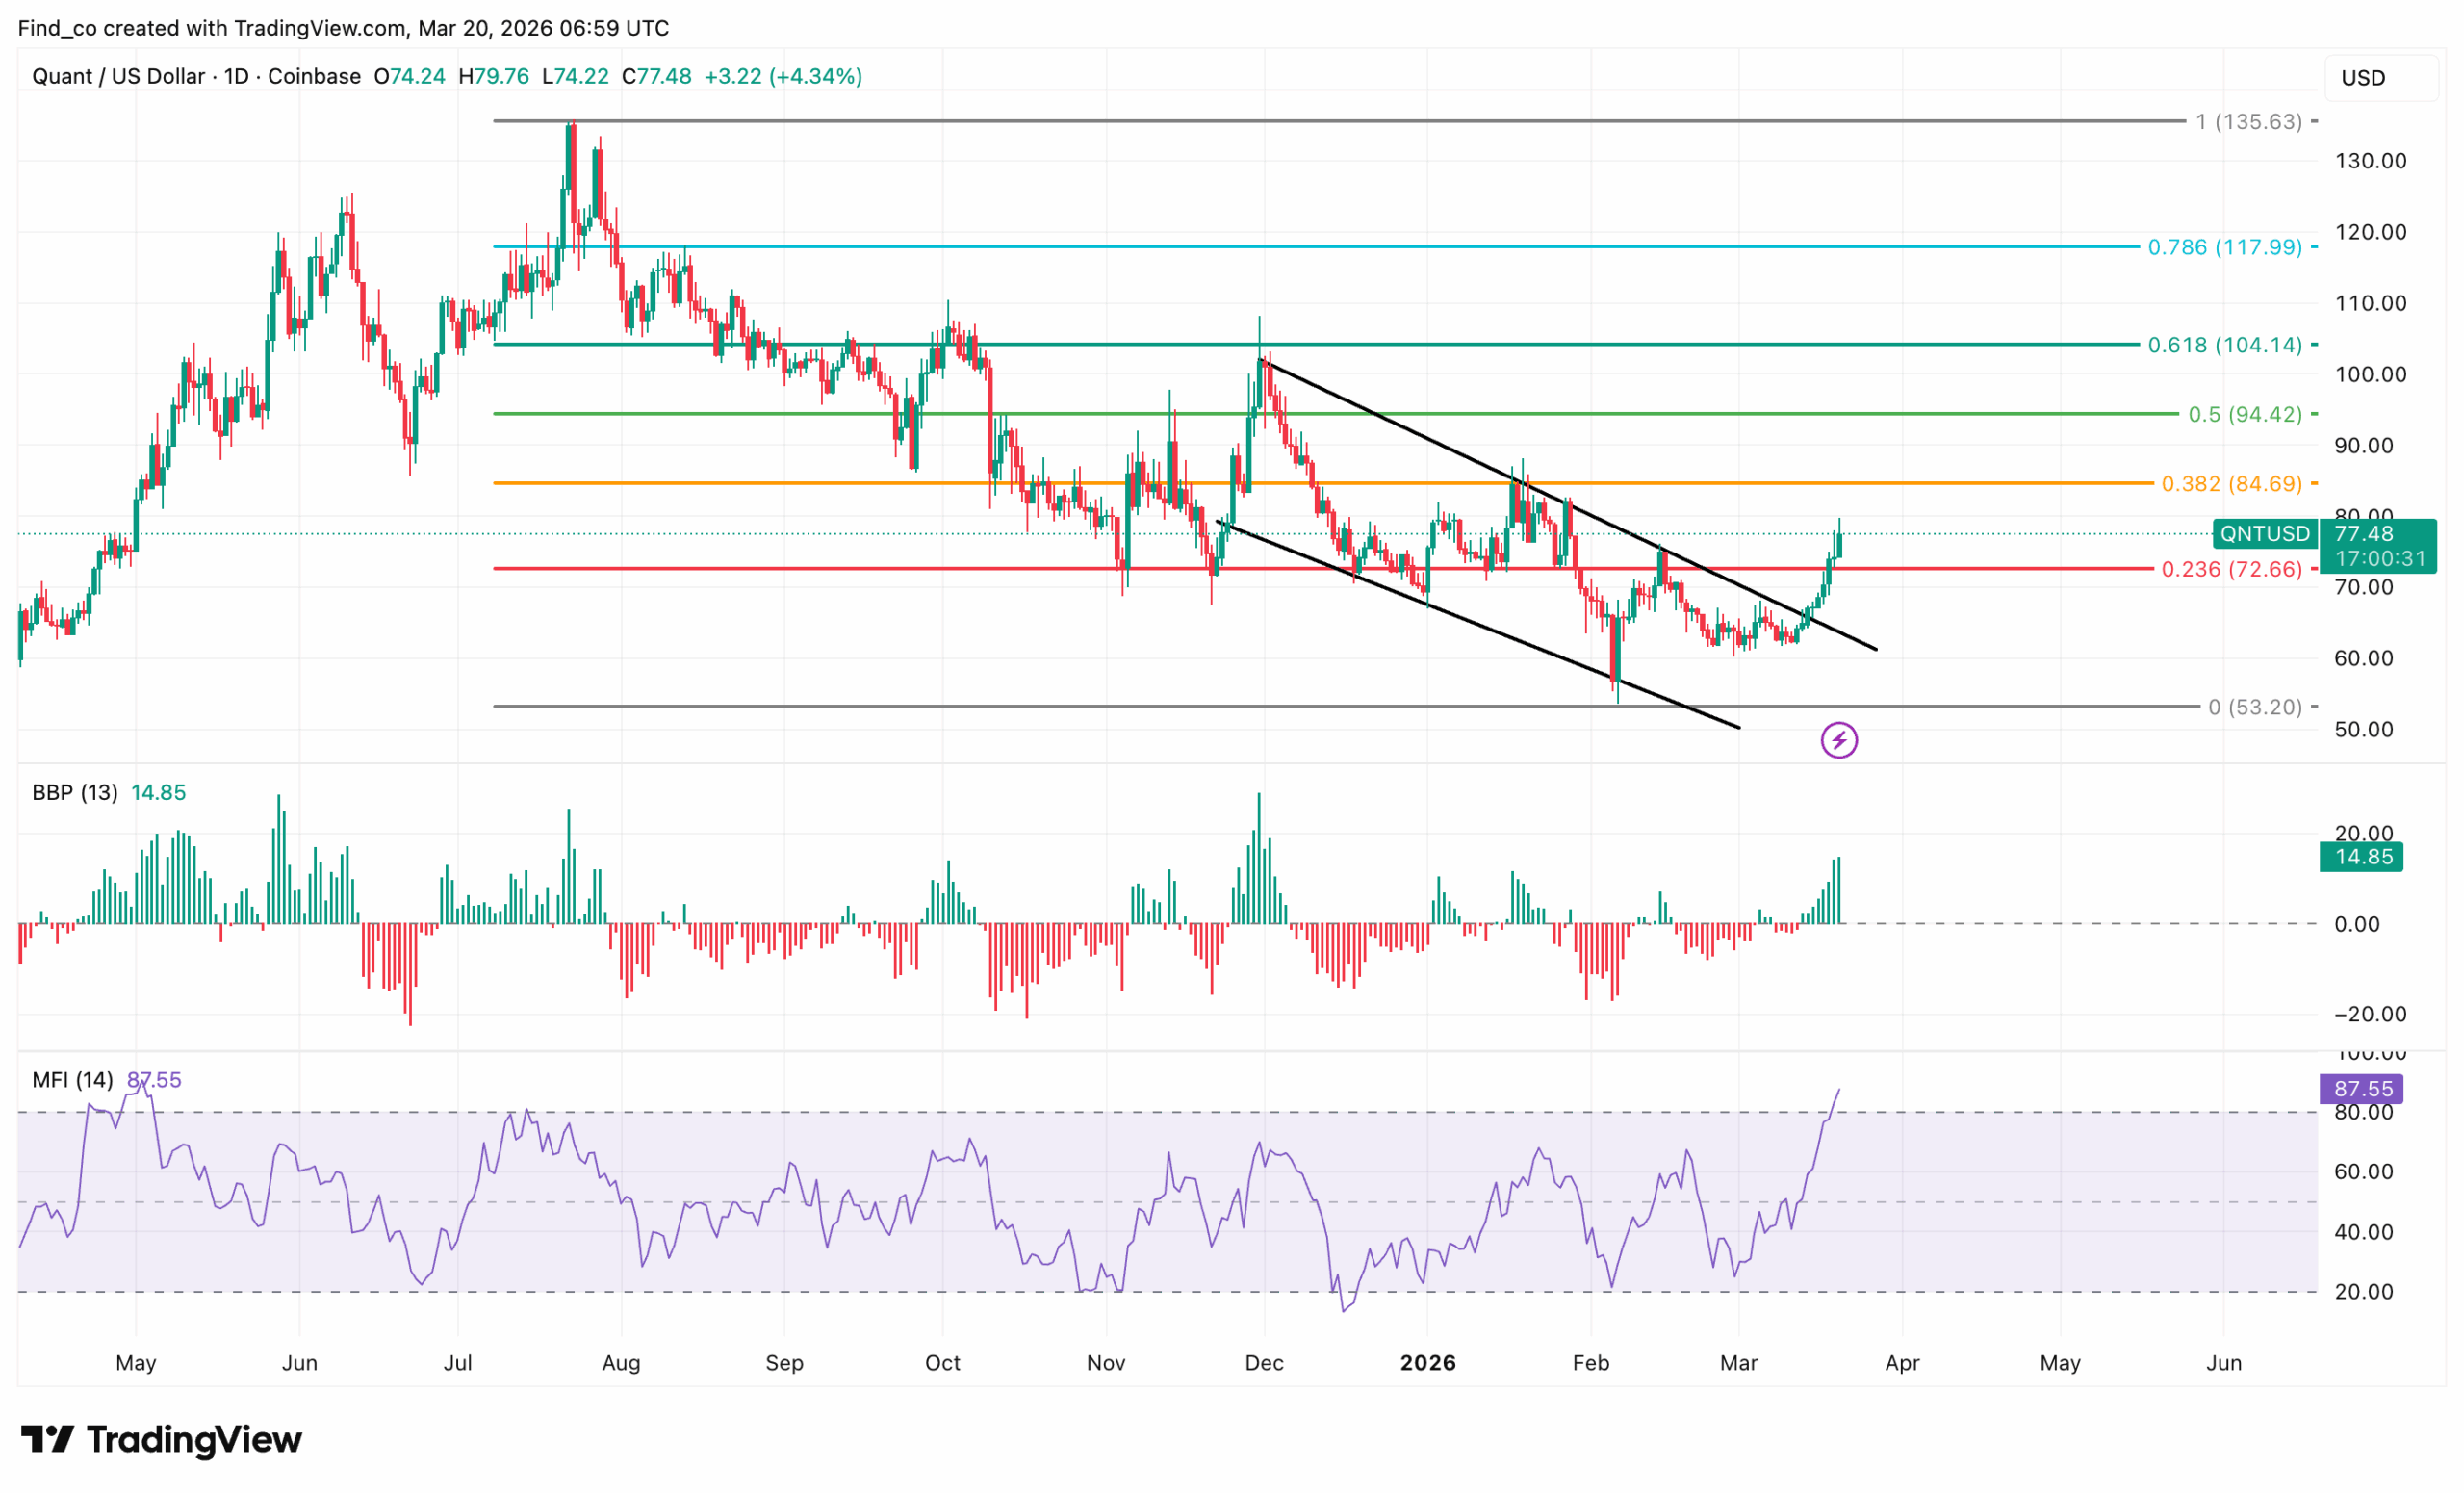
Meanwhile, the technical setup on the daily chart confirms that the MVRV was signalling.
At press time, the token trades at $77.48, having cleared the upper trendline of a descending channel
Two indicators are firing simultaneously, and both are at significant levels. The Bull Bear Power (BBP) at 14.85 is its most positive reading since the October–November 2025 rally peak.
Throughout the January–February decline, the BBP was persistently negative, reflecting bear dominance.
So, the reversal signals that buyers have taken control of short-term price discovery for the first time in months.
Meanwhile, the Money Flow Index (MFI) at 87.55 is approaching overbought territory.
Prior MFI peaks near 90 on this chart were followed by brief consolidations before resuming their upward trend.
However, the key distinction is that those prior peaks occurred within established uptrends.
Disclaimer:
The information provided in this article is for informational purposes only. It is not intended to be, nor should it be construed as, financial advice. We do not make any warranties regarding the completeness, reliability, or accuracy of this information. All investments involve risk, and past performance does not guarantee future results. We recommend consulting a financial advisor before making any investment decisions.
Victor Olanrewaju is a crypto analyst and reporter at CCN with deep roots in on-chain research and technical analysis. His crypto journey began in 2017, but it was the 2020 Uniswap airdrop that sparked a full-time pivot into the space.
With a foundation in copywriting, Victor honed his craft creating high-converting content for leading crypto brokers — most notably an XRP price prediction that ranked #1 on Google during the 2021 bull run.
He later joined AMBCrypto in 2022, where he combined storytelling with technical and on-chain analysis to cover key market narratives.
In 2024, he expanded his expertise at BeInCrypto, collaborating with analysts and using tools like Glassnode, Santiment, and IntoTheBlock to break down Bitcoin and altcoin trends.
At CCN, Victor covers the top cryptocurrencies, memecoins, macro shifts, blending real-time insights with deep-dive metrics.
He holds a Bachelor’s degree in Physics from the University of Ibadan, equipping him to simplify complex data for a wide audience. Follow his work or connect on LinkedIn or X.