This supply-side shock has sharply reduced new issuance, while demand remains, tightening the available supply in the market.
Historically, such emission reductions have intensified upward price pressure when combined with favorable technical conditions, an alignment that TAO now appears to have firmly established.
Capital Inflows Remain Strong
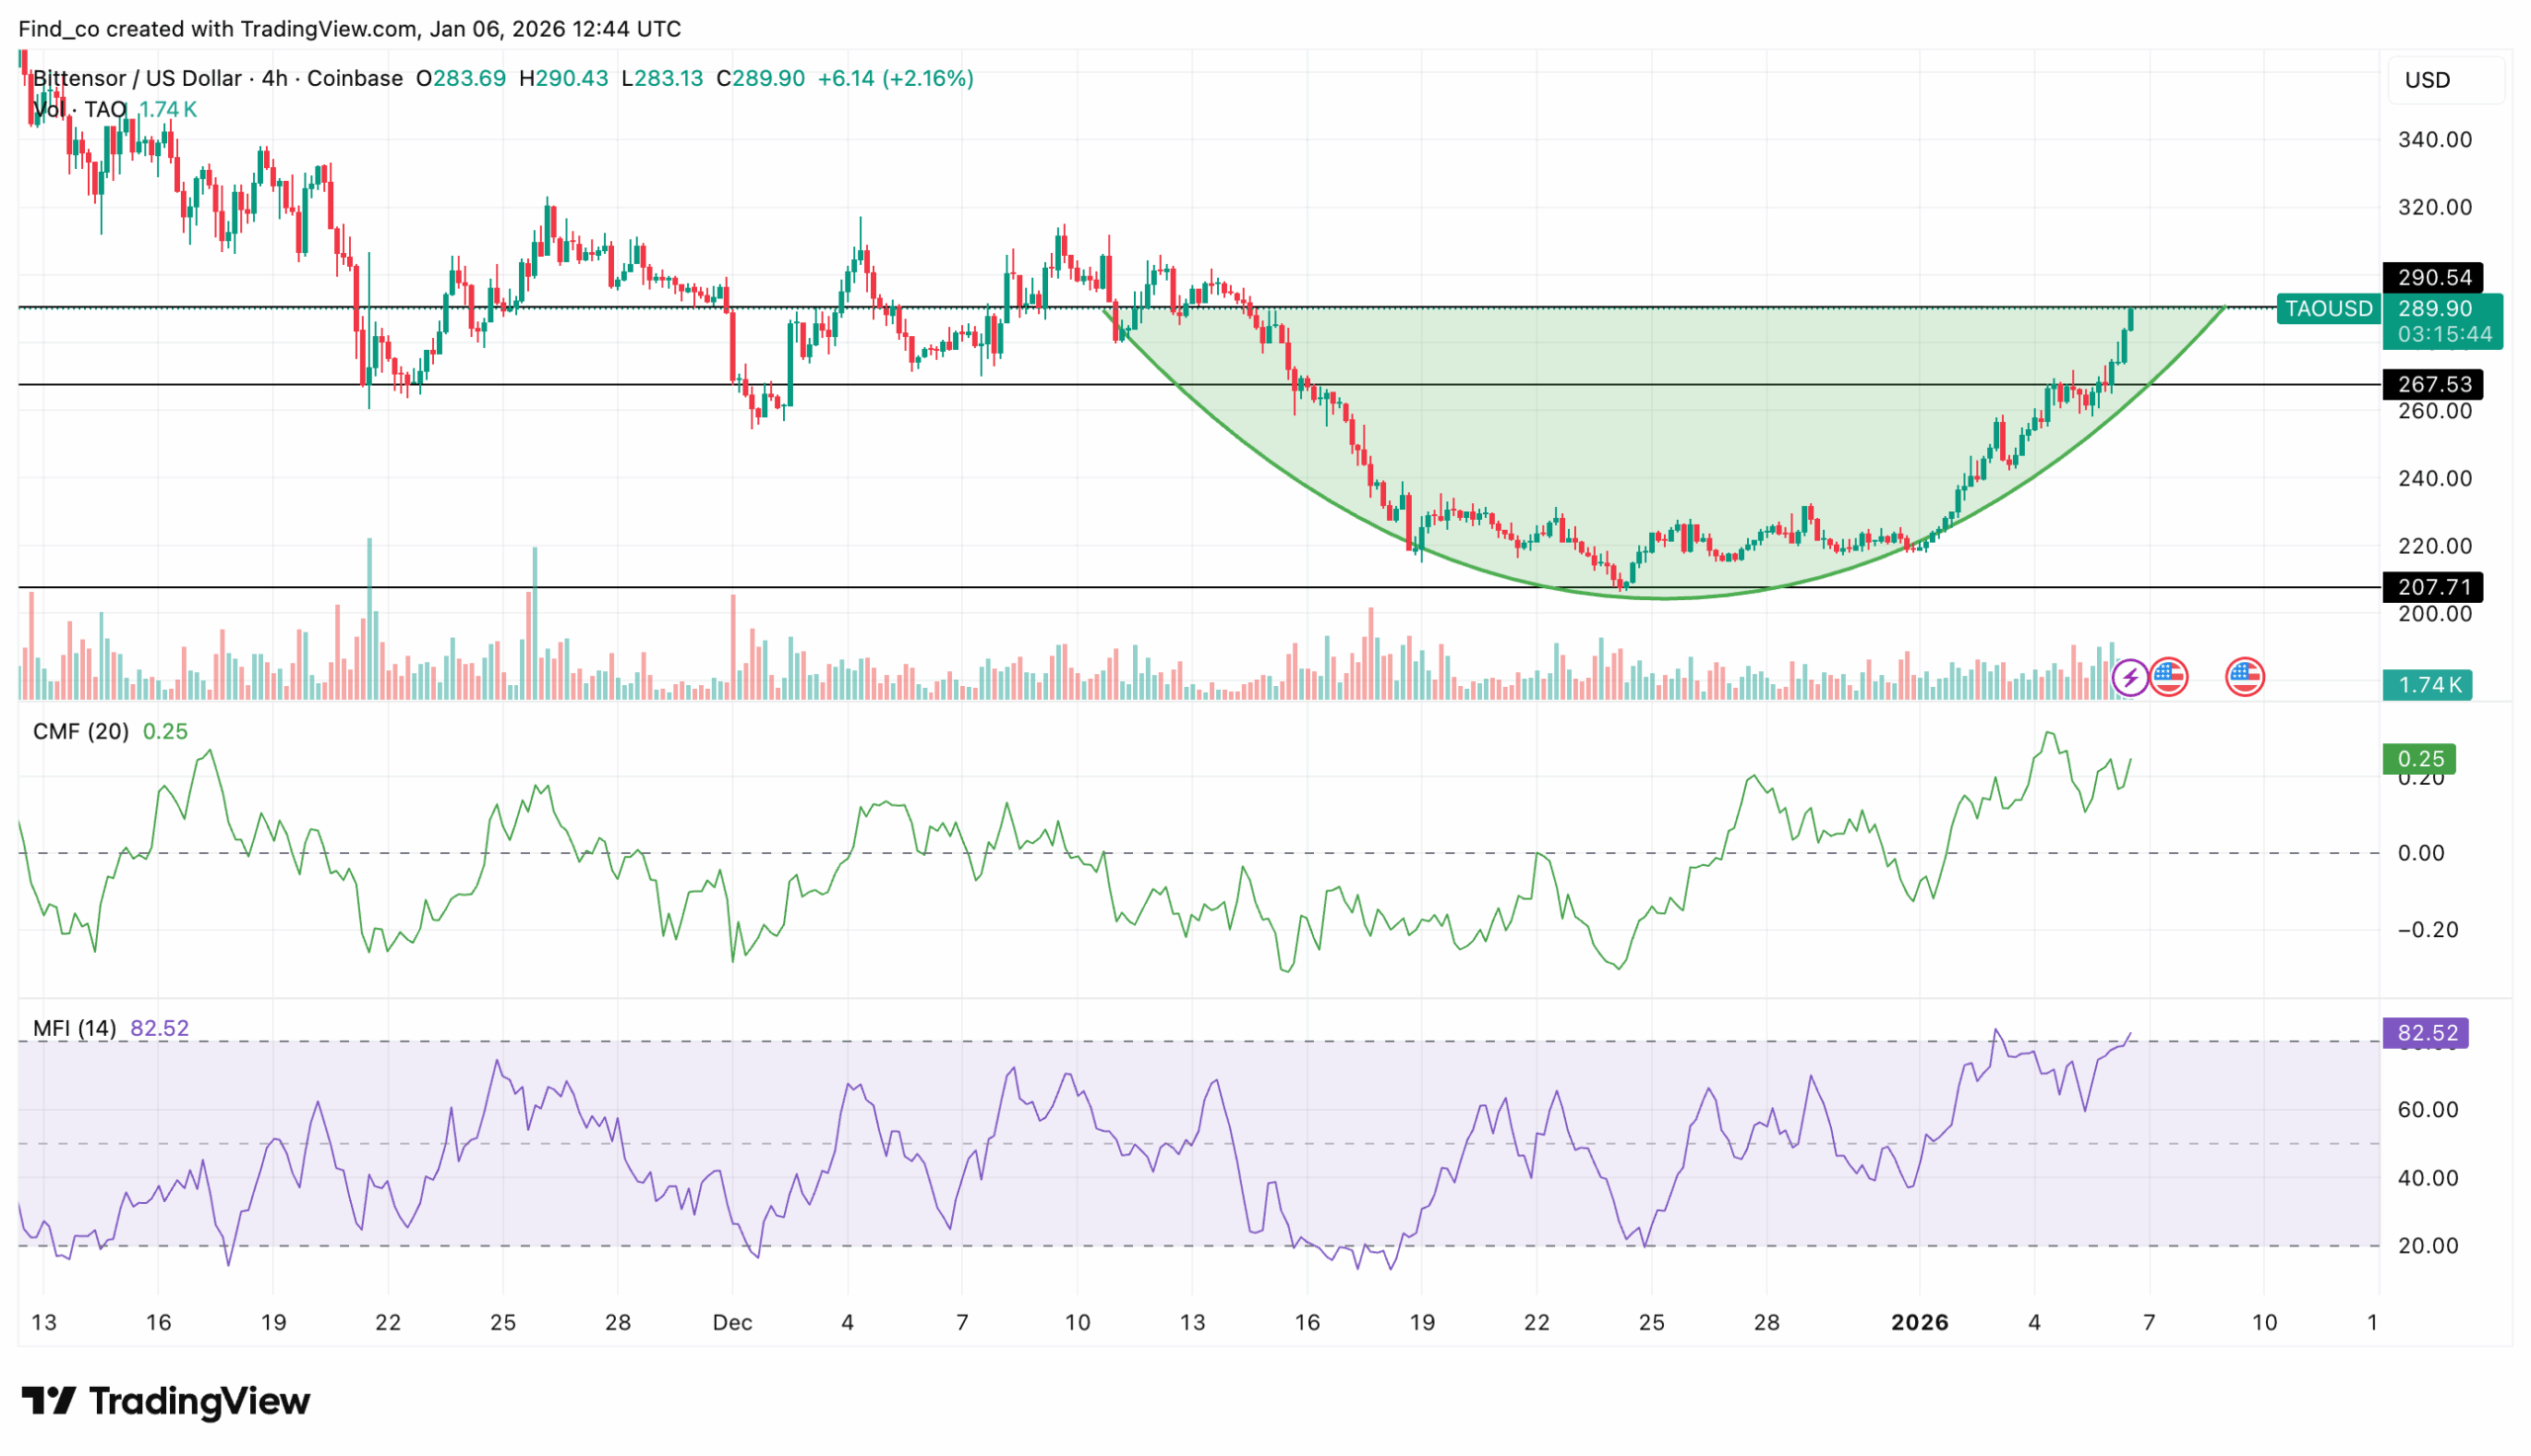
On the 4-hour chart, the Chaikin Money Flow (CMF) reinforces TAO’s price bullish structure. This happened as the altcoin formed a rounding bottom on the same timeframe.
Currently holding around 0.14, CMF remains in positive territory, signaling sustained capital inflows and confirming that buyers continue to dominate market participation rather than distributing into strength.
The Money Flow Index (MFI) tells a similar story. At 82.52, the indicator approaches overbought conditions but has not yet signaled exhaustion.
In strong post-breakout environments, elevated MFI readings typically reflect aggressive accumulation rather than an imminent reversal, indicating that demand remains intact.
TAO’s price action shows that the altcoin has reclaimed the $275 to $290 resistance zone, flipping it into short-term support.
This level previously capped upside throughout December, making the breakout structurally significant.
As long as the TAO price holds above this zone, the bullish continuation bias remains valid.
TAO Price Outlook: Bullish
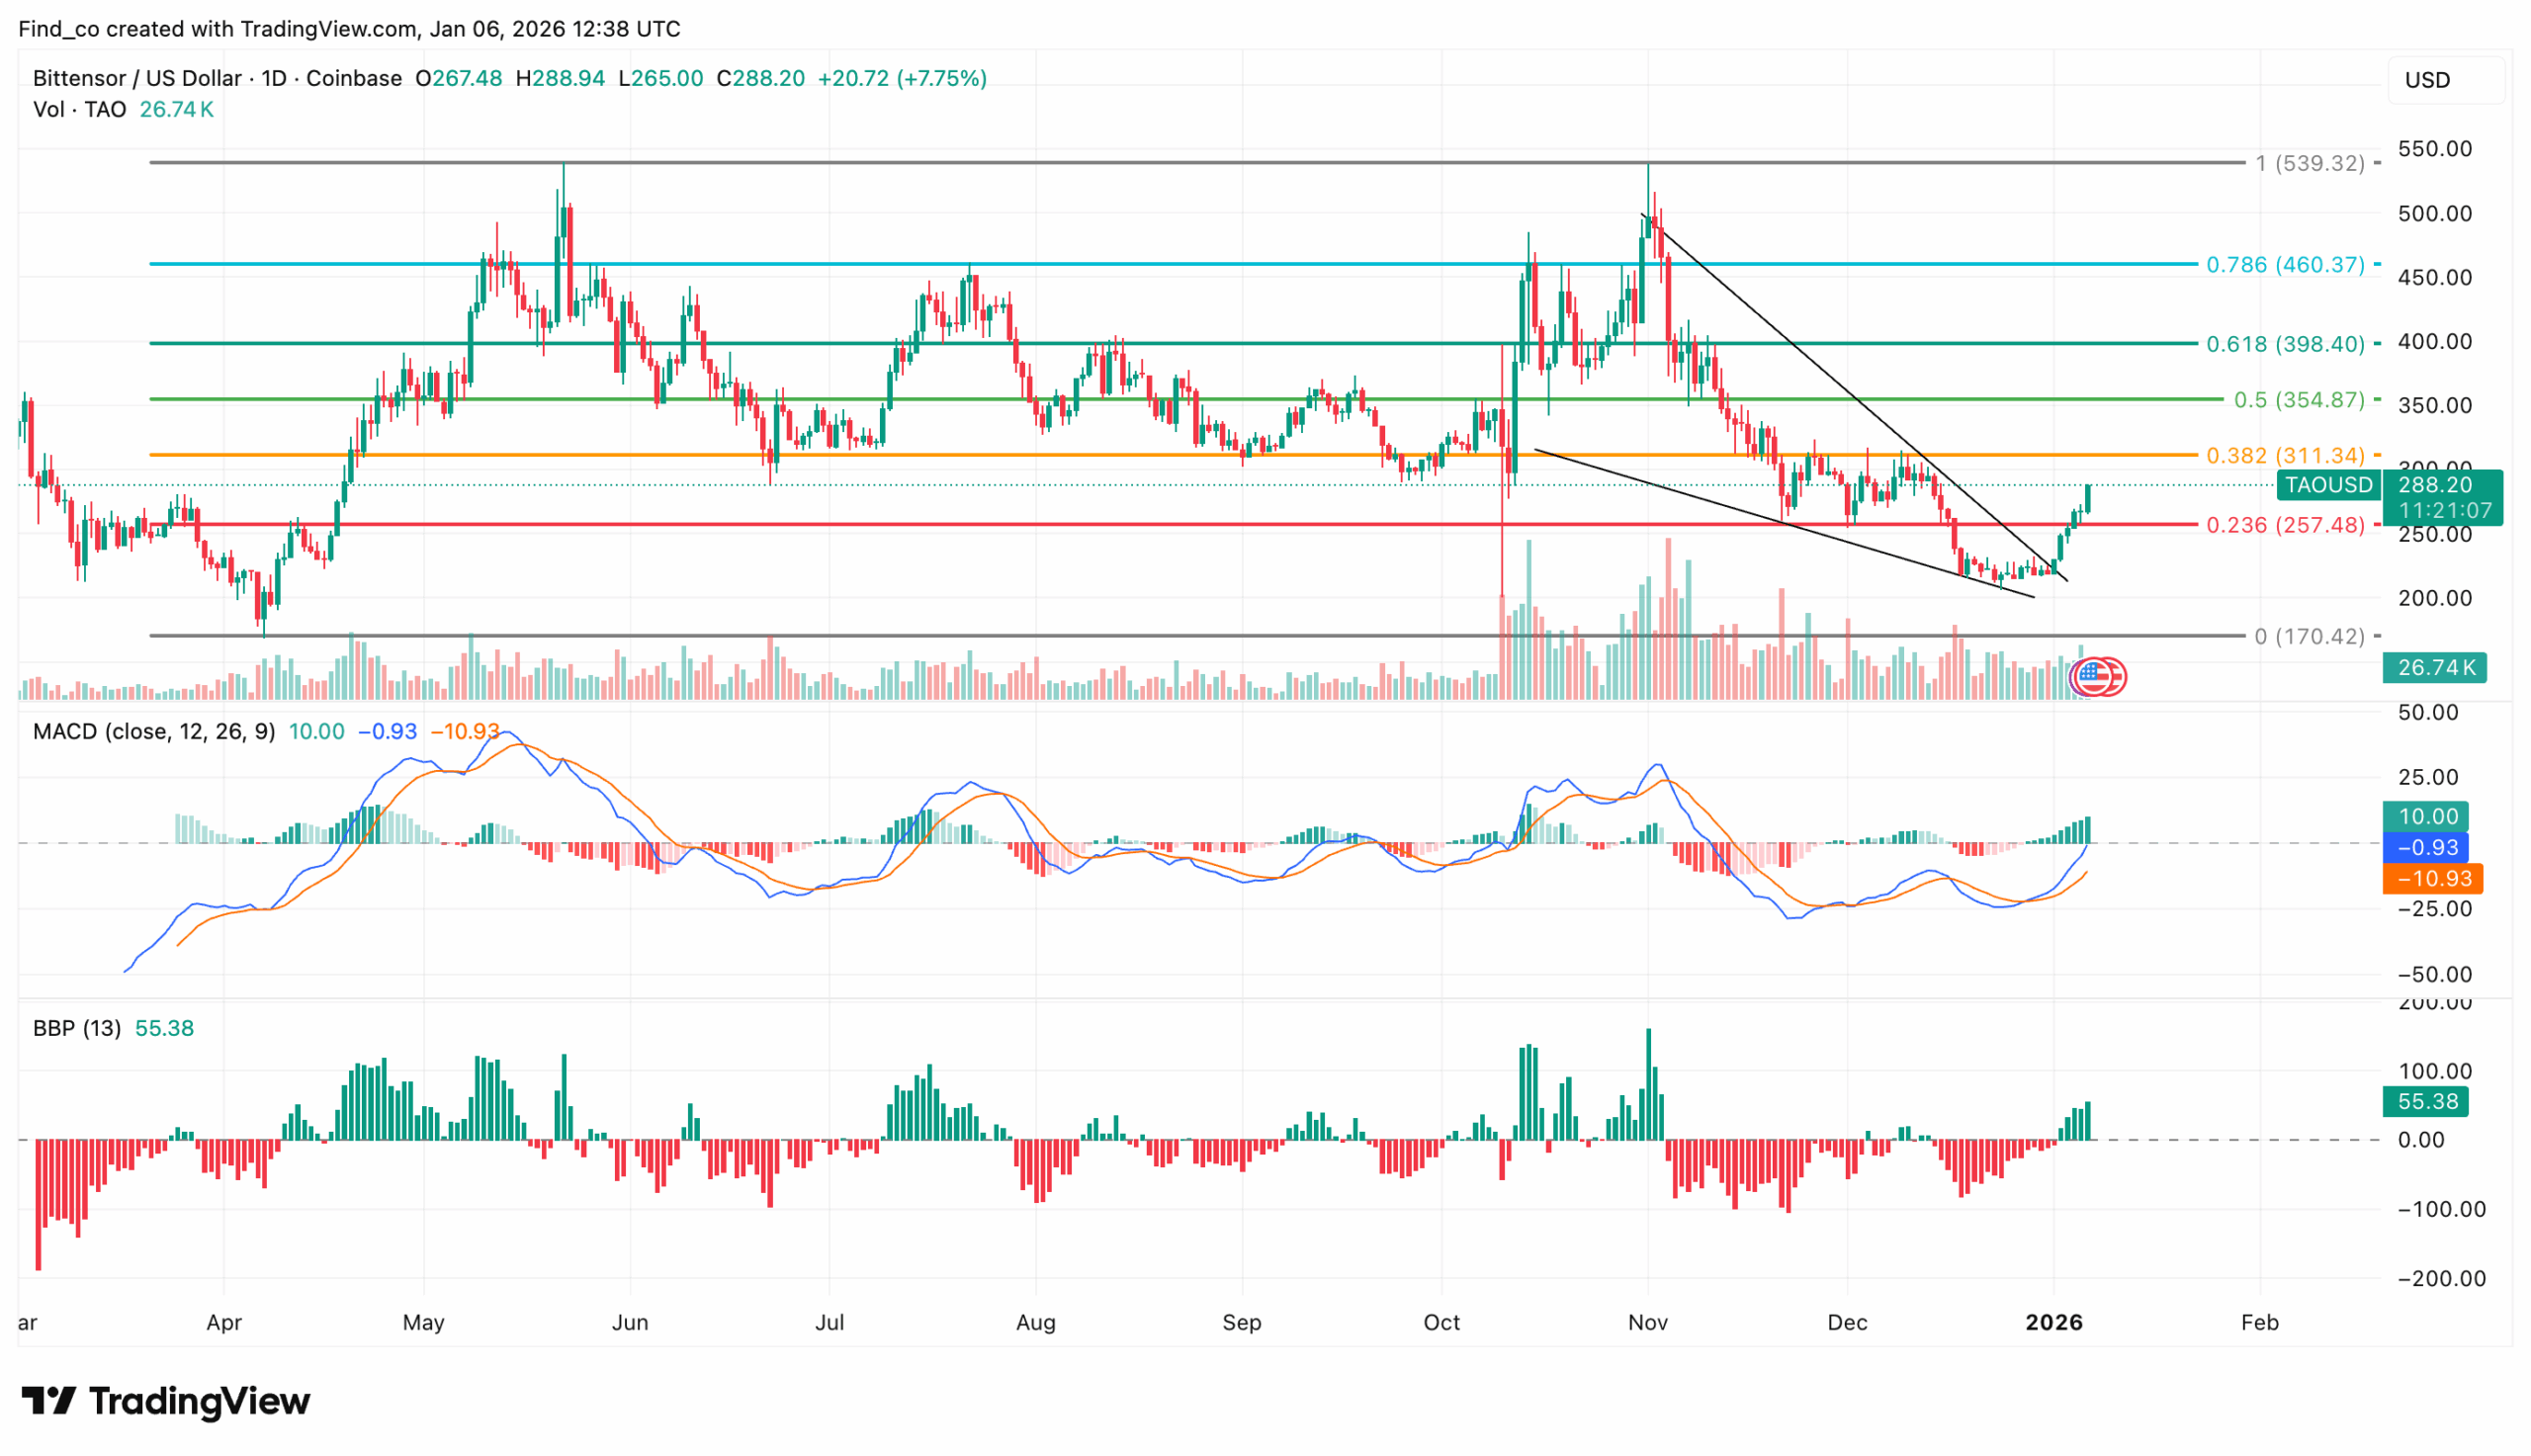
On the daily chart, TAO’s price has surged sharply after breaking out of its falling wedge pattern.
The Moving Average Convergence Divergence (MACD) confirms the breakout, while the 12-day EMA crossing above the 26-day EMA signals strong bullish momentum and heightened buyer activity.
Similarly, the Bull-Bear Power indicator is printing multiple green histogram bars in positive territory, reflecting sustained buying dominance over selling pressure.
This alignment across key technical indicators reinforces the bullish outlook and suggests that momentum could carry TAO’s price toward its next resistance around $400.
Fibonacci retracement levels provide a clearer view of TAO’s price action. At the time of writing, TAO is trading at $288.20 as it trends toward the 0.382 Fib level at $311.34
TAO/USD Daily Chart | Credi
A break above this level could push TAO’s price to retest the next resistance at $398.40, before continuing its move toward $460.37.
However, a break below this level could trigger accelerated selling pressure. If that were to happen, this could potentially drive the price down to the next critical support zone.
Disclaimer:
The information provided in this article is for informational purposes only. It is not intended to be, nor should it be construed as, financial advice. We do not make any warranties regarding the completeness, reliability, or accuracy of this information. All investments involve risk, and past performance does not guarantee future results. We recommend consulting a financial advisor before making any investment decisions.
Victor Olanrewaju is a crypto analyst and reporter at CCN with deep roots in on-chain research and technical analysis. His crypto journey began in 2017, but it was the 2020 Uniswap airdrop that sparked a full-time pivot into the space.
With a foundation in copywriting, Victor honed his craft creating high-converting content for leading crypto brokers — most notably an XRP price prediction that ranked #1 on Google during the 2021 bull run.
He later joined AMBCrypto in 2022, where he combined storytelling with technical and on-chain analysis to cover key market narratives.
In 2024, he expanded his expertise at BeInCrypto, collaborating with analysts and using tools like Glassnode, Santiment, and IntoTheBlock to break down Bitcoin and altcoin trends.
At CCN, Victor covers the top cryptocurrencies, memecoins, macro shifts, blending real-time insights with deep-dive metrics.
He holds a Bachelor’s degree in Physics from the University of Ibadan, equipping him to simplify complex data for a wide audience. Follow his work or connect on LinkedIn or X.