XPL rebounds from demand while momentum improves | Credit: Hameem Sarwar
Share
Key Takeaways
XPL is still down 94% from its ATH, but the sell-pressure appears to be easing.
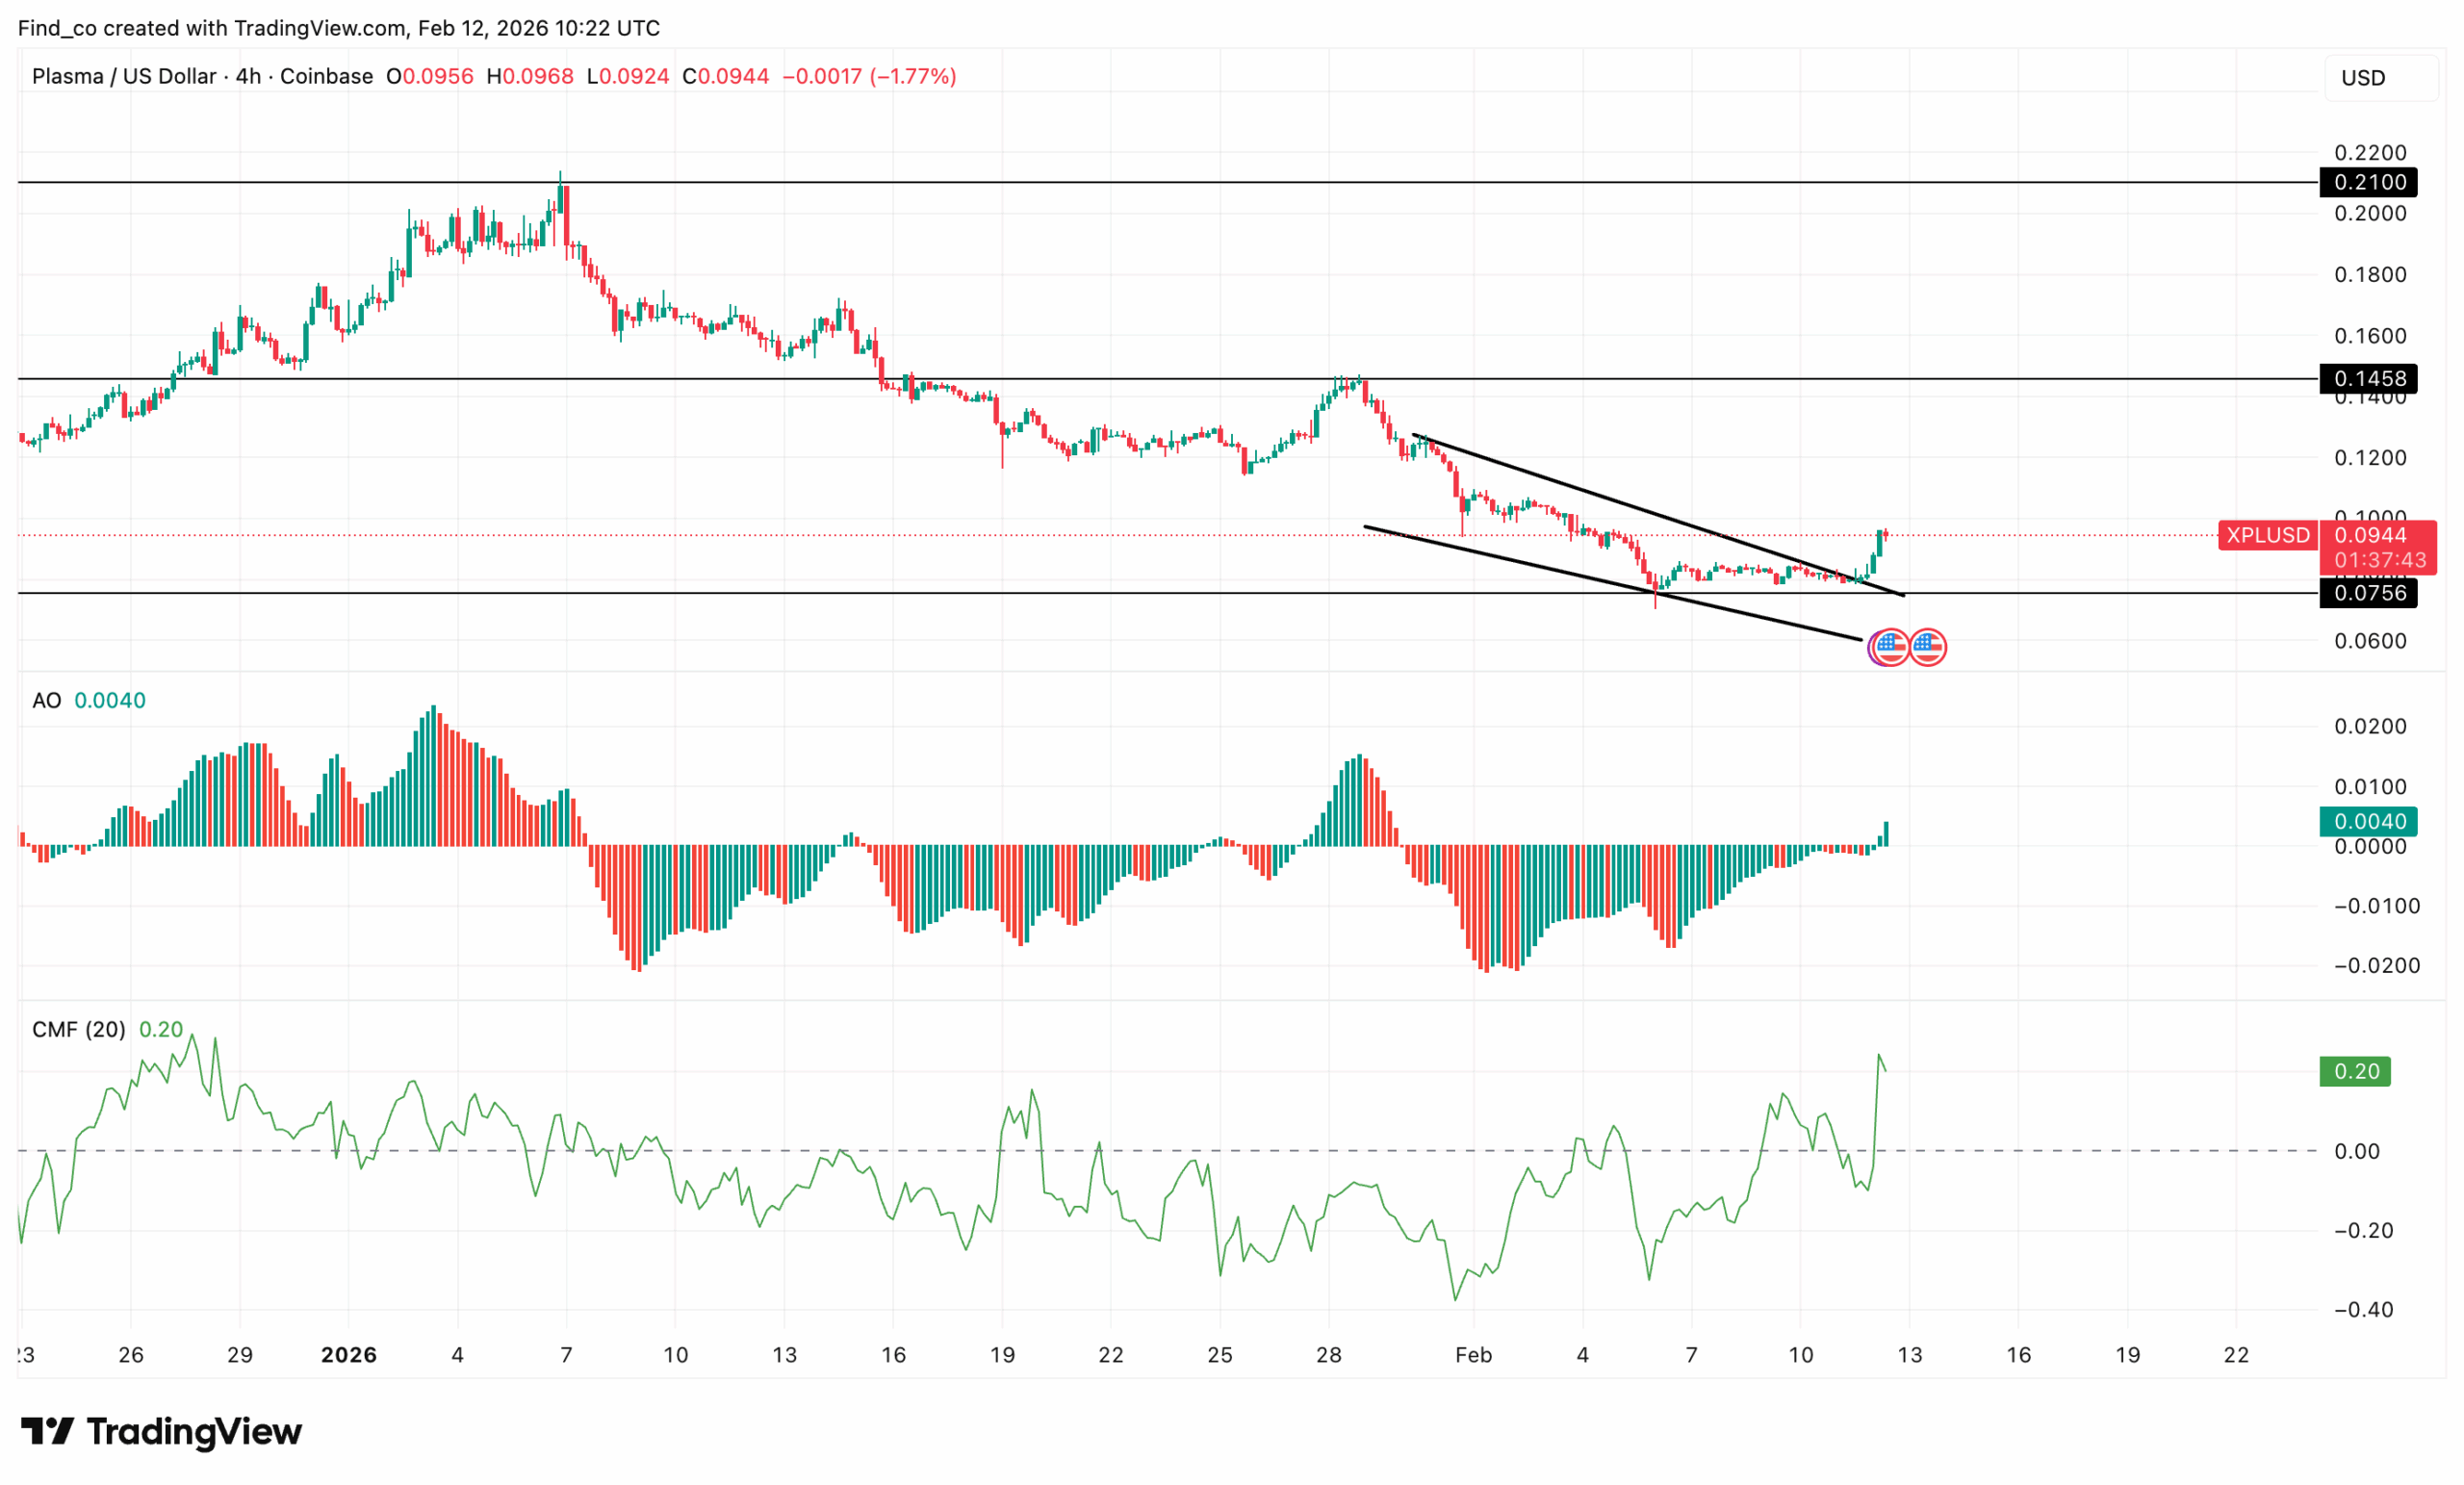
On the 4-hour chart, the AO has flipped positive, and the CMF is slightly above zero.
The key target is XPL’s break and hold above the $0.11 resistance.
After Plasma (XPL) launched its mainnet beta and native token in September 2025, early enthusiasm from the community and institutional backers drove a brief surge.
However, sharp price swings gave way to broader market pressures. Now, the XPL token is down 94% from its all-time high.
The downturn, largely driven by airdroppers taking profits, is now easing as selling moderates.
Also, buyers are gradually returning. This slowdown in outflows sets the stage for potential consolidation and a possible recovery.
The Awesome Oscillator (AO) reflects a shift seen in the early phase of trend transitions.
Printing green histogram bars above the zero line, the indicator points to strengthening bullish momentum as buyers gradually regain confidence.
Similarly, the Chaikin Money Flow (CMF) is climbing and now hovers slightly above zero, signaling that capital inflows are beginning to outweigh outflows.
This subtle but important shift suggests accumulation may be underway, supporting the case for a developing recovery.
Price structure reinforces this narrative. XPL’s price has rebounded from a major demand zone near recent lows and is attempting to form higher lows for the first time in weeks.
This pattern often marks the transition from capitulation to early accumulation, where smart money positions ahead of a broader move.
However, the path higher is not without friction. Overhead resistance near the $0.11 zone remains a key barrier that previously acted as support before the breakdown.
A break above this region would strengthen bullish sentiment and could pave the way toward $0.15, a level that aligns with the prior consolidation structure.
XPL Price Outlook: Bullish
After an extended stretch of lower lows and lower highs, the XPL token has mounted a notable rebound, attempting to carve out a short-term base.
The broader structure remains technically bearish, yet the intensity of the decline appears to be easing.
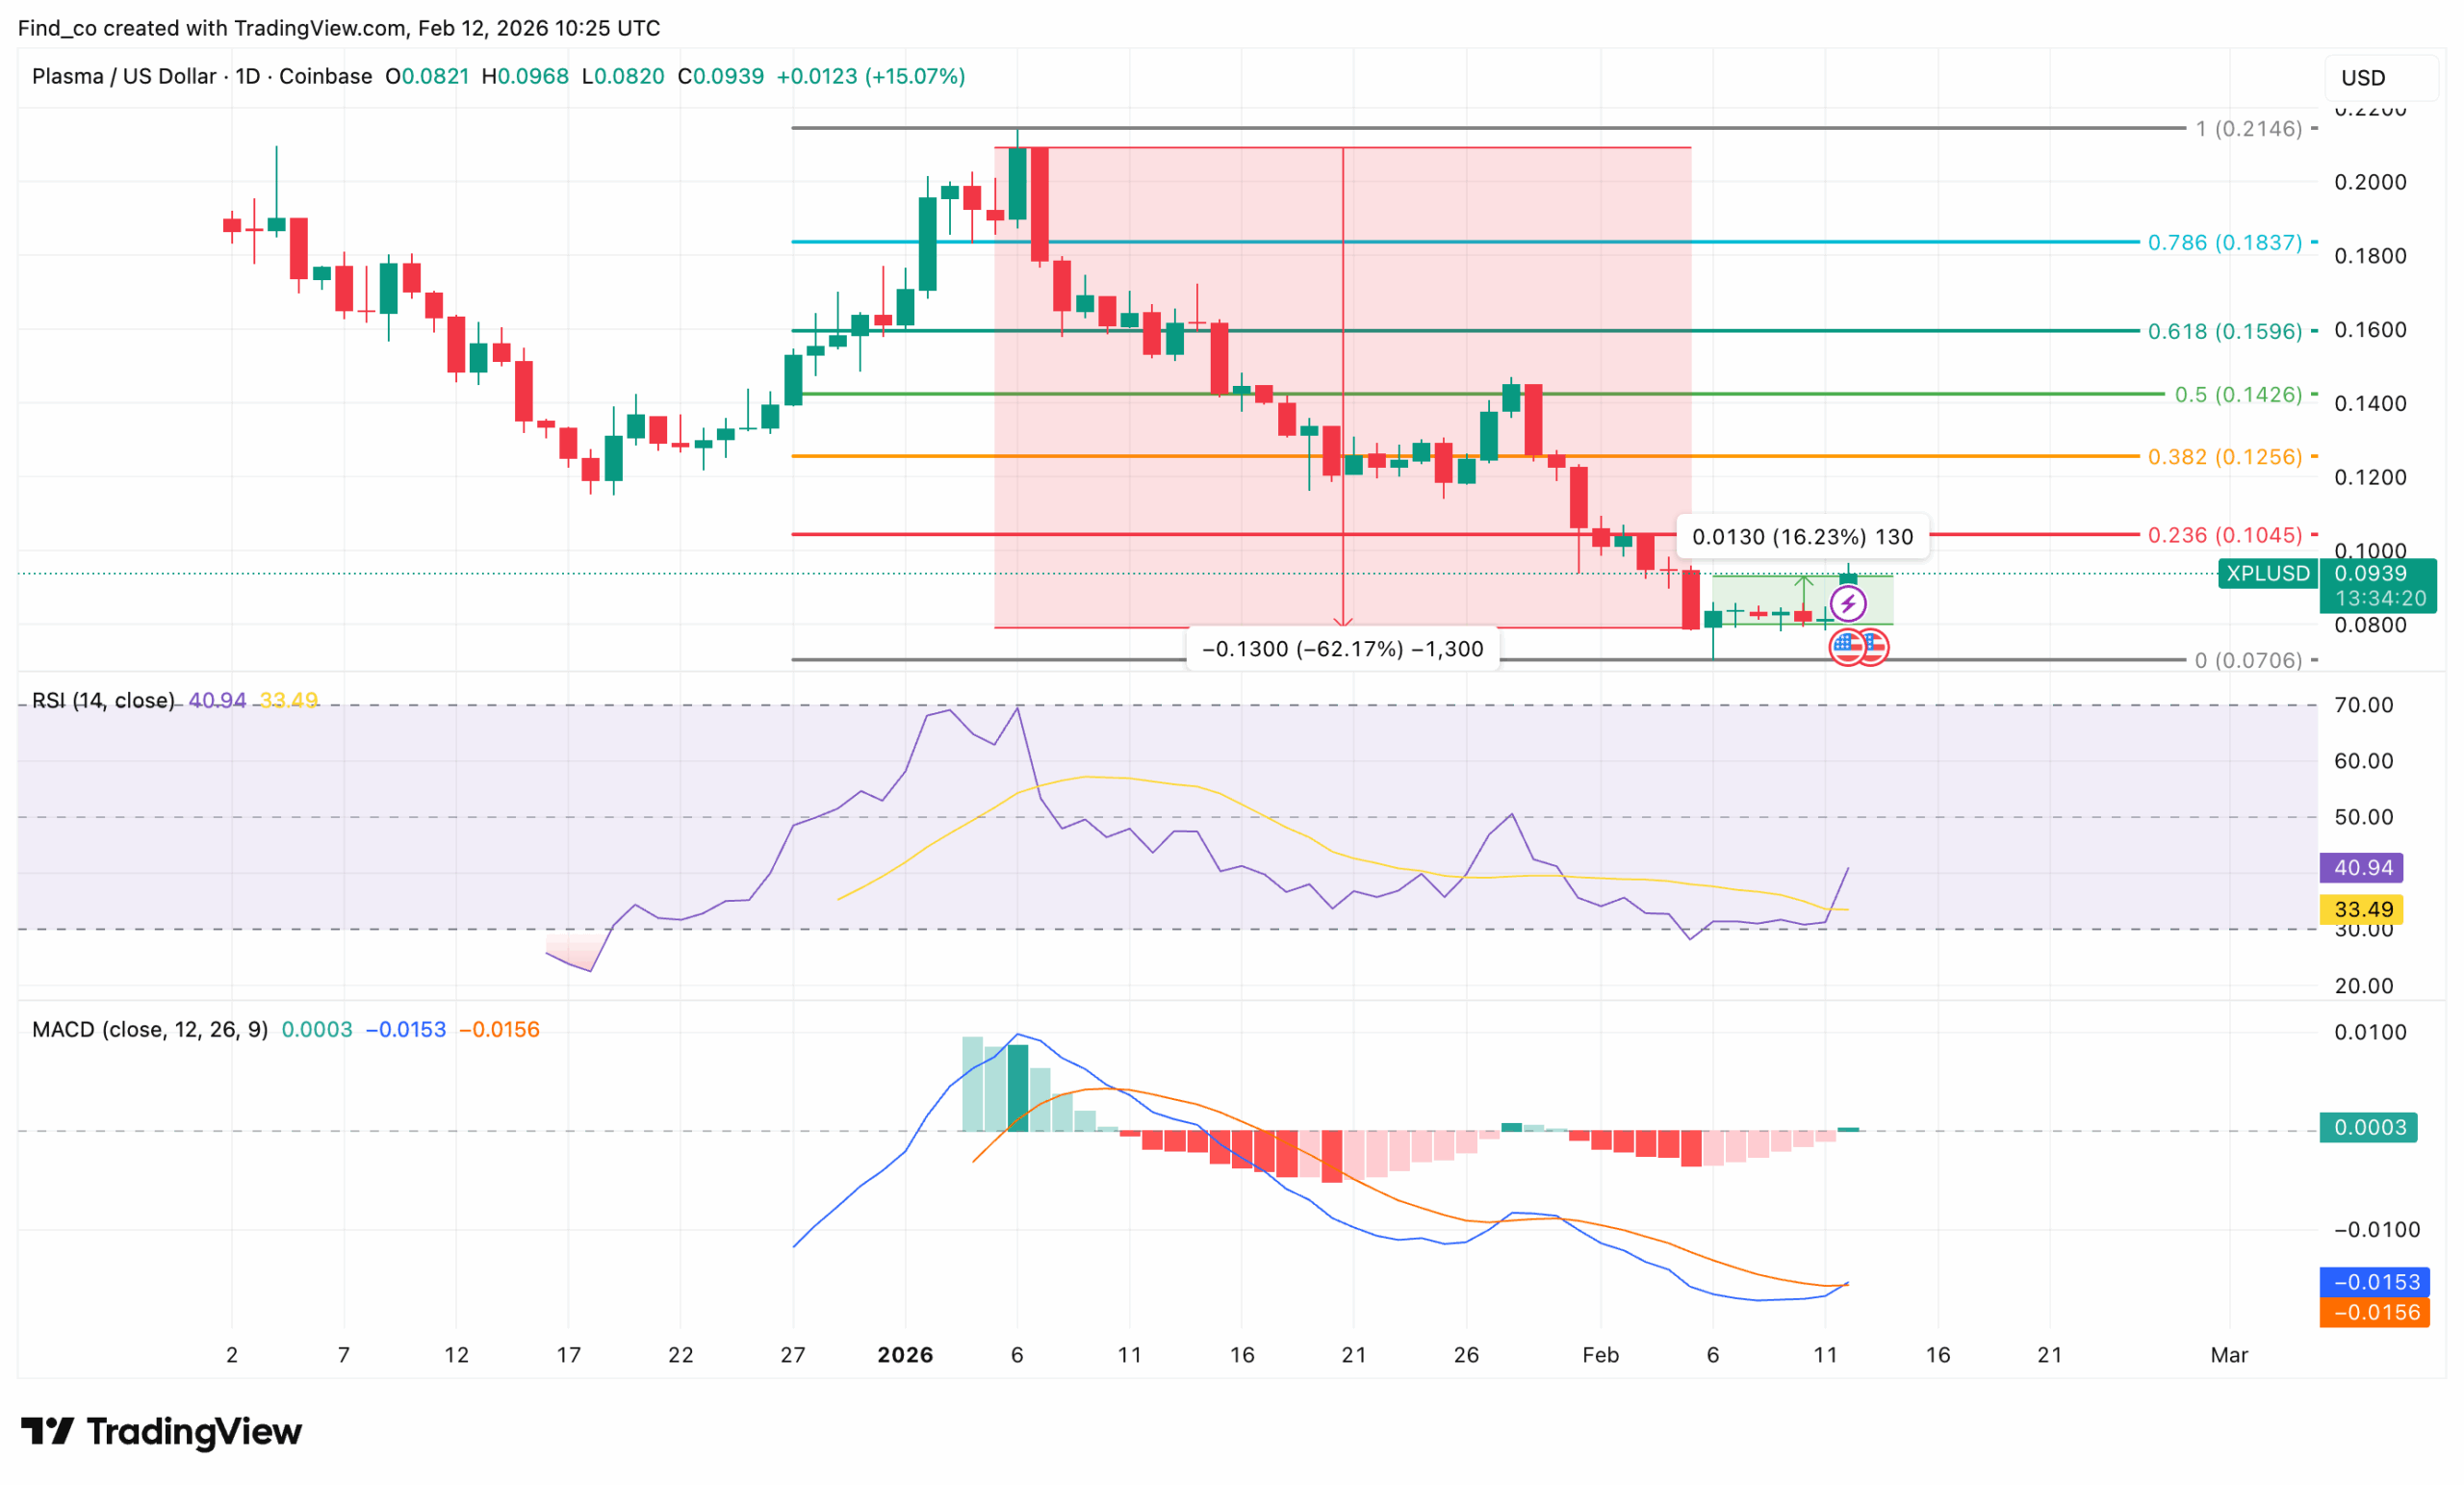
On the daily chart, buyers are gradually stepping back in, defending support levels that previously failed to hold.
The Relative Strength Index (RSI) is trending upward with steady momentum.
While it still trades below the 50 midline, the climb toward neutral territory suggests that selling pressure is weakening.
On previous occasions, RSI recovery has preceded structural shifts, but only when the price has followed through with higher highs.
Meanwhile, the Moving Average Convergence Divergence (MACD) has crossed out of negative territory and printed its first green histogram bar, signaling early bullish momentum.
XPL’s price now faces its first meaningful test. It sits just below the 0.236 Fibonacci retracement level and is capped at the $0.095 resistance zone.
This level aligns with the prior breakdown structure, making it a critical inflection point. A close above $0.095 could open the door toward the next resistance zone at $0.15.
Disclaimer:
The information provided in this article is for informational purposes only. It is not intended to be, nor should it be construed as, financial advice. We do not make any warranties regarding the completeness, reliability, or accuracy of this information. All investments involve risk, and past performance does not guarantee future results. We recommend consulting a financial advisor before making any investment decisions.
Victor Olanrewaju is a crypto analyst and reporter at CCN with deep roots in on-chain research and technical analysis. His crypto journey began in 2017, but it was the 2020 Uniswap airdrop that sparked a full-time pivot into the space.
With a foundation in copywriting, Victor honed his craft creating high-converting content for leading crypto brokers — most notably an XRP price prediction that ranked #1 on Google during the 2021 bull run.
He later joined AMBCrypto in 2022, where he combined storytelling with technical and on-chain analysis to cover key market narratives.
In 2024, he expanded his expertise at BeInCrypto, collaborating with analysts and using tools like Glassnode, Santiment, and IntoTheBlock to break down Bitcoin and altcoin trends.
At CCN, Victor covers the top cryptocurrencies, memecoins, macro shifts, blending real-time insights with deep-dive metrics.
He holds a Bachelor’s degree in Physics from the University of Ibadan, equipping him to simplify complex data for a wide audience. Follow his work or connect on LinkedIn or X.