Plasma shows early recovery signs after a harsh 2025 | Credit: Hameem Sarwar
Share
Key Takeaways
XPL has bounced from its all-time low, with a rising RSI and bullish MACD.
The price currently consolidates below $0.17, where a breakout could target $0.20.
Open Interest has risen in tandem with the price, and the wedge breakout appears to be a valid development.
Plasma (XPL) is showing early signs of a reversal after a difficult 2025, rebounding more than 40% from its all-time low.
The move comes as market structure begins to stabilize, hinting at renewed interest heading into the New Year.
While XPL’s price remains far below prior highs, improving momentum suggests the cryptocurrency may be transitioning into a short-term recovery phase rather than extending its year-long downtrend.
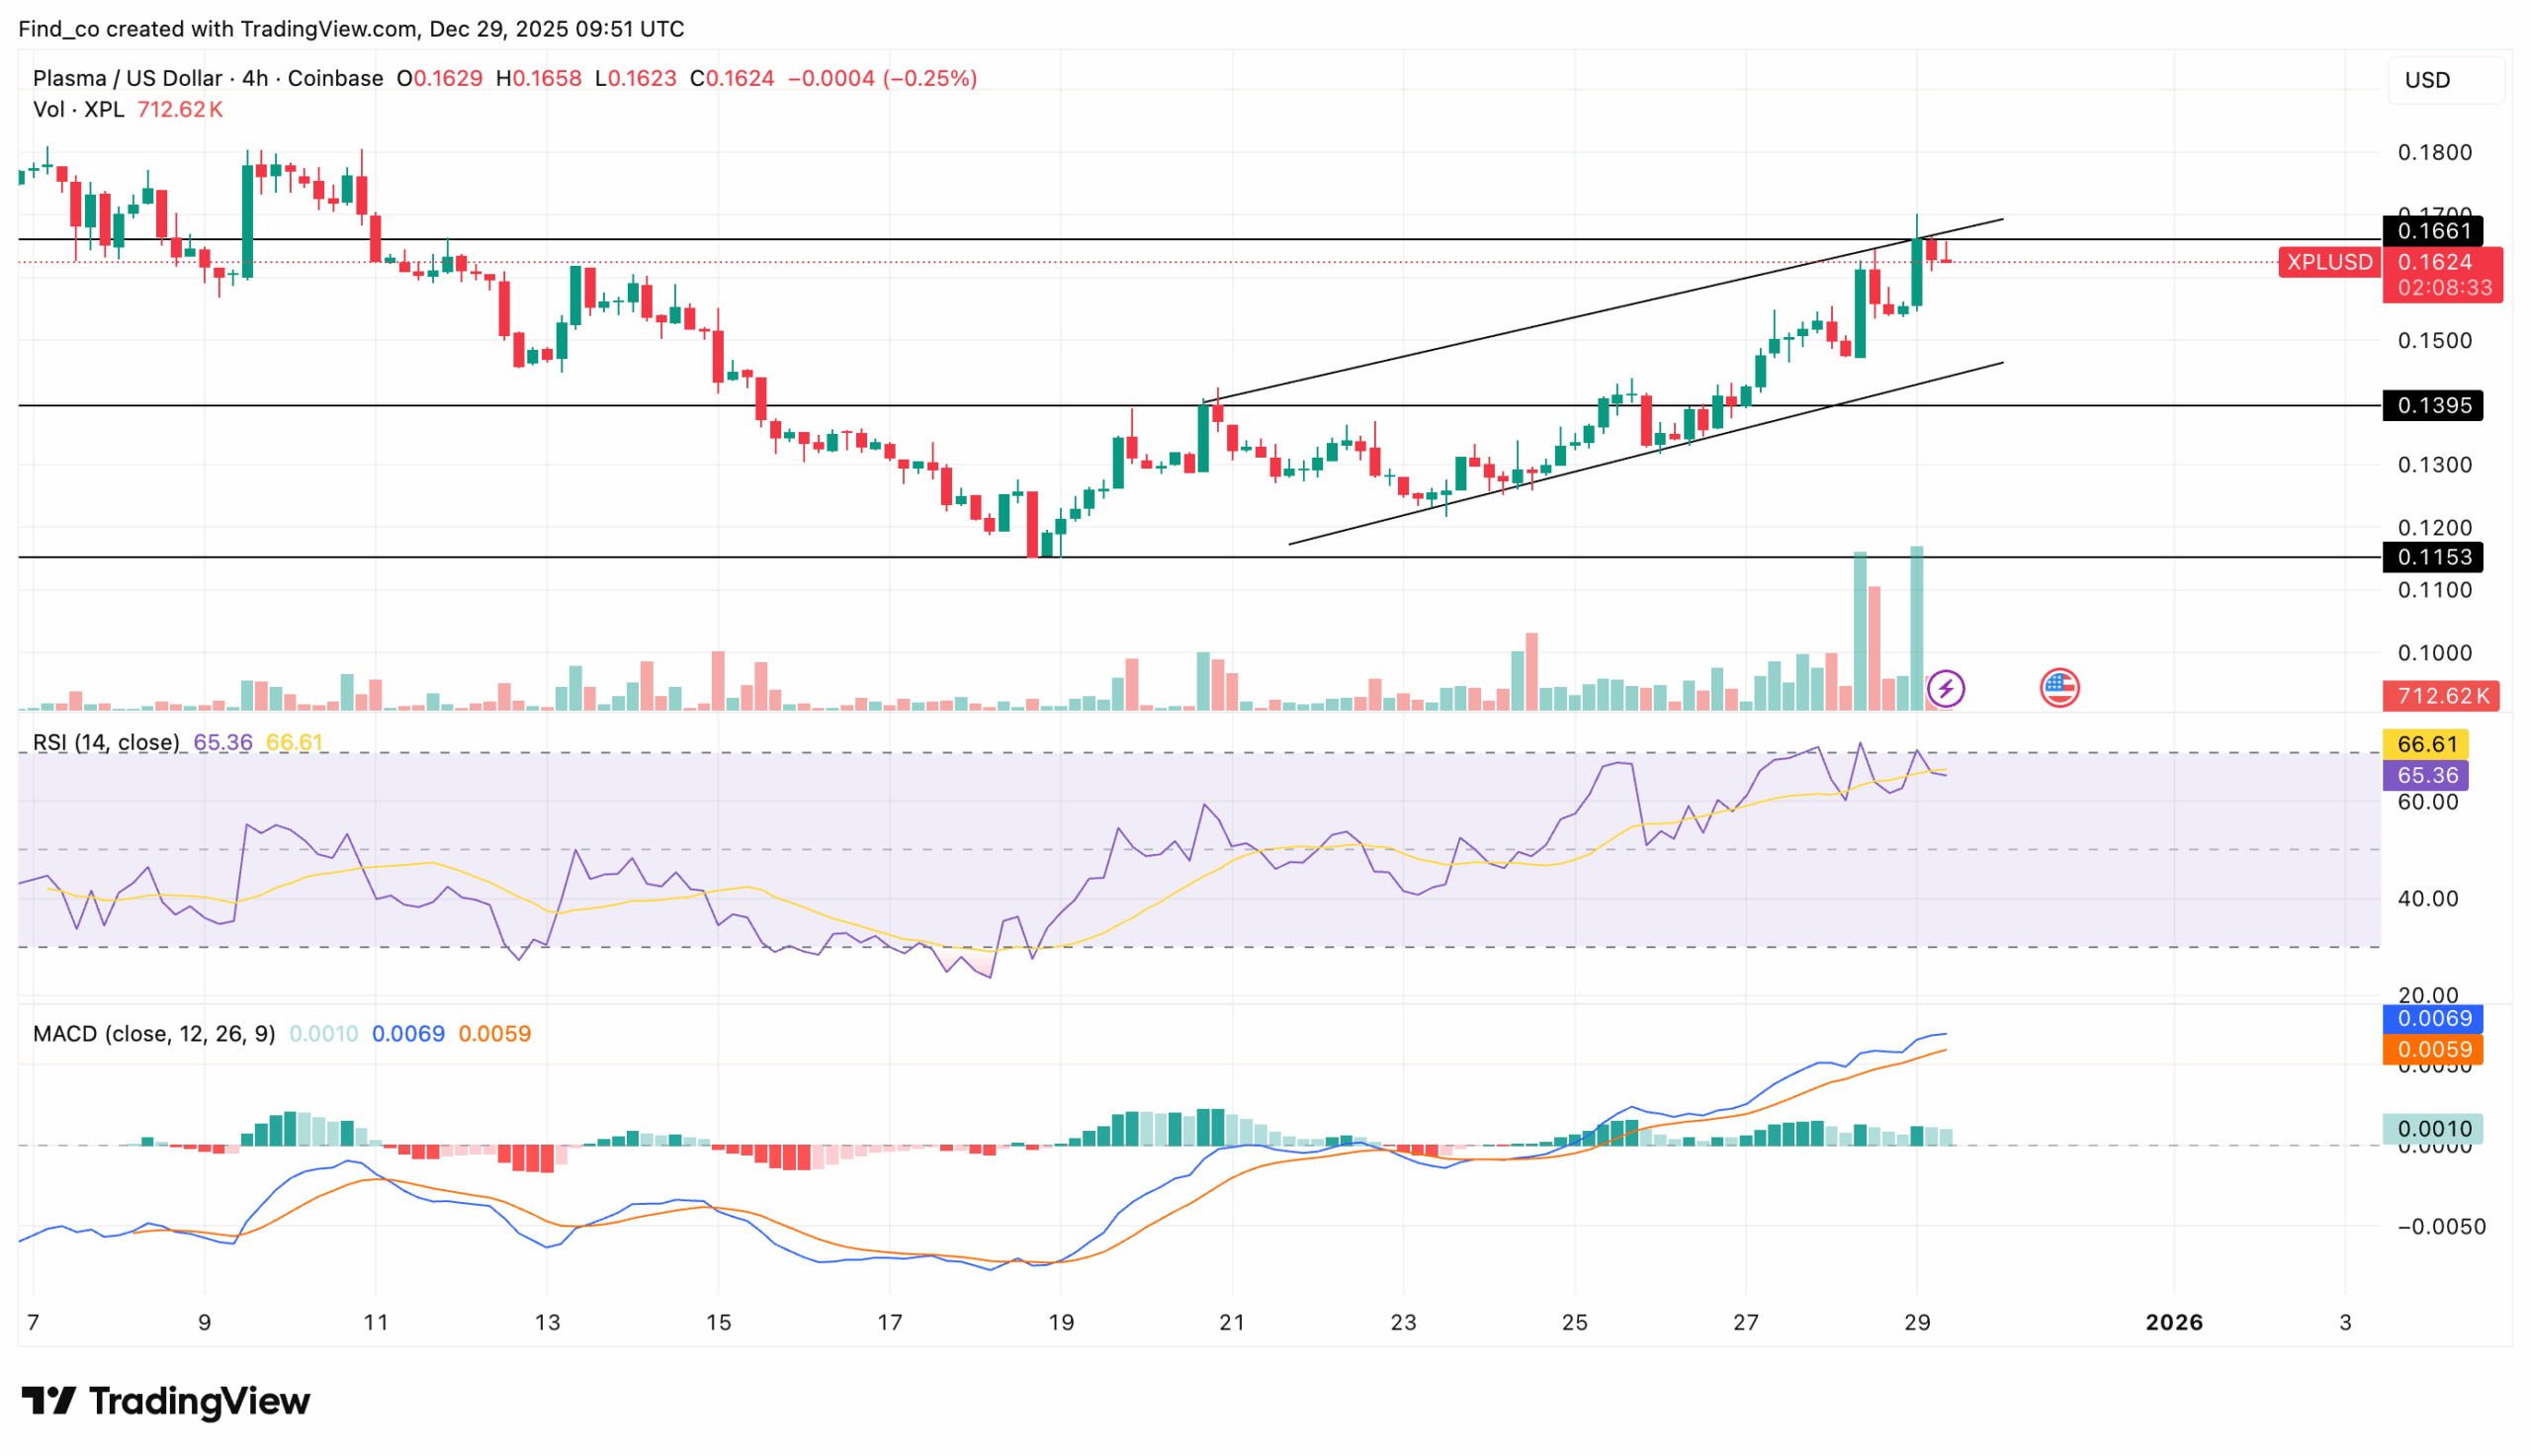
XPL Presses Key Resistance
On the 4-hour chart, the Relative Strength Index (RSI) continues to trend higher, currently at 65.15 at the time of writing.
We sometimes use affiliate links in our content, when clicking on those we might receive a commission at no extra cost to you. By using this website you agree to our terms and conditions and privacy policy.
Notably, the RSI structure reflects strengthening trend behavior rather than immediate exhaustion.
The Moving Average Convergence Divergence (MACD) reinforces that setup.
Bullish histogram bars continue to print consistently, and the 12-day EMA remains above the 26-day EMA, confirming that upside momentum is still active rather than fading.
Due to this setup, XPL has been able to hold the support at $0.12. In the process, it has breached the $0.14 resistance.
A breakout and hold above this zone would strengthen the bullish case.
Additionally, the current setup could also pave the way for an extension into the $0.18 to $0.20 range, where prior supply was concentrated before the earlier breakdown.
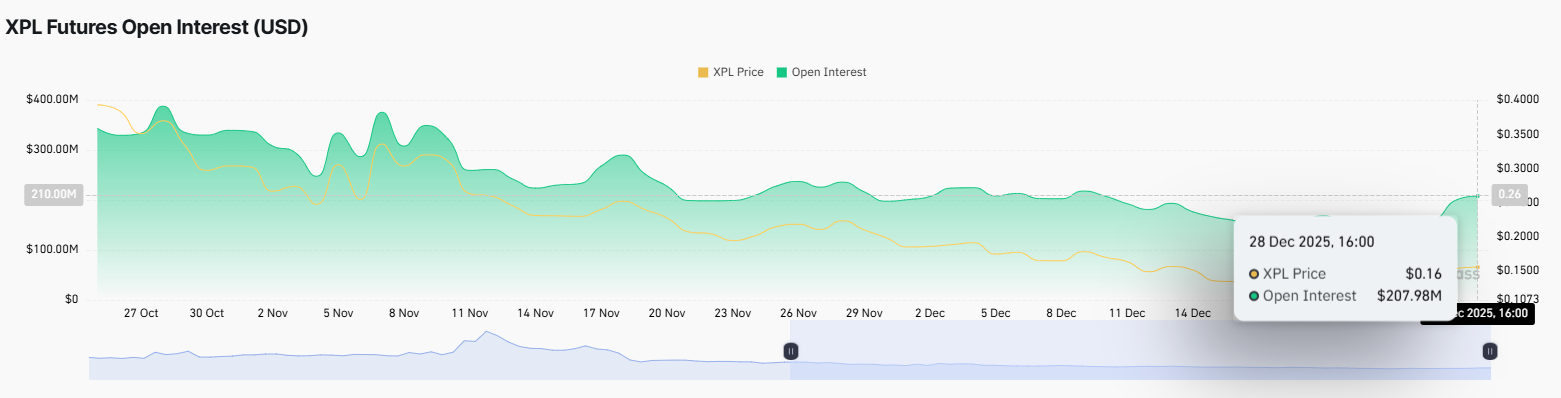
Open Interest Rises Alongside Price
Derivatives data adds another layer of support. At the time of writing, the Open Interest (OI) has climbed roughly 11% over the past 24 hours.
This signals that fresh capital is entering the market, rather than traders unwinding positions.
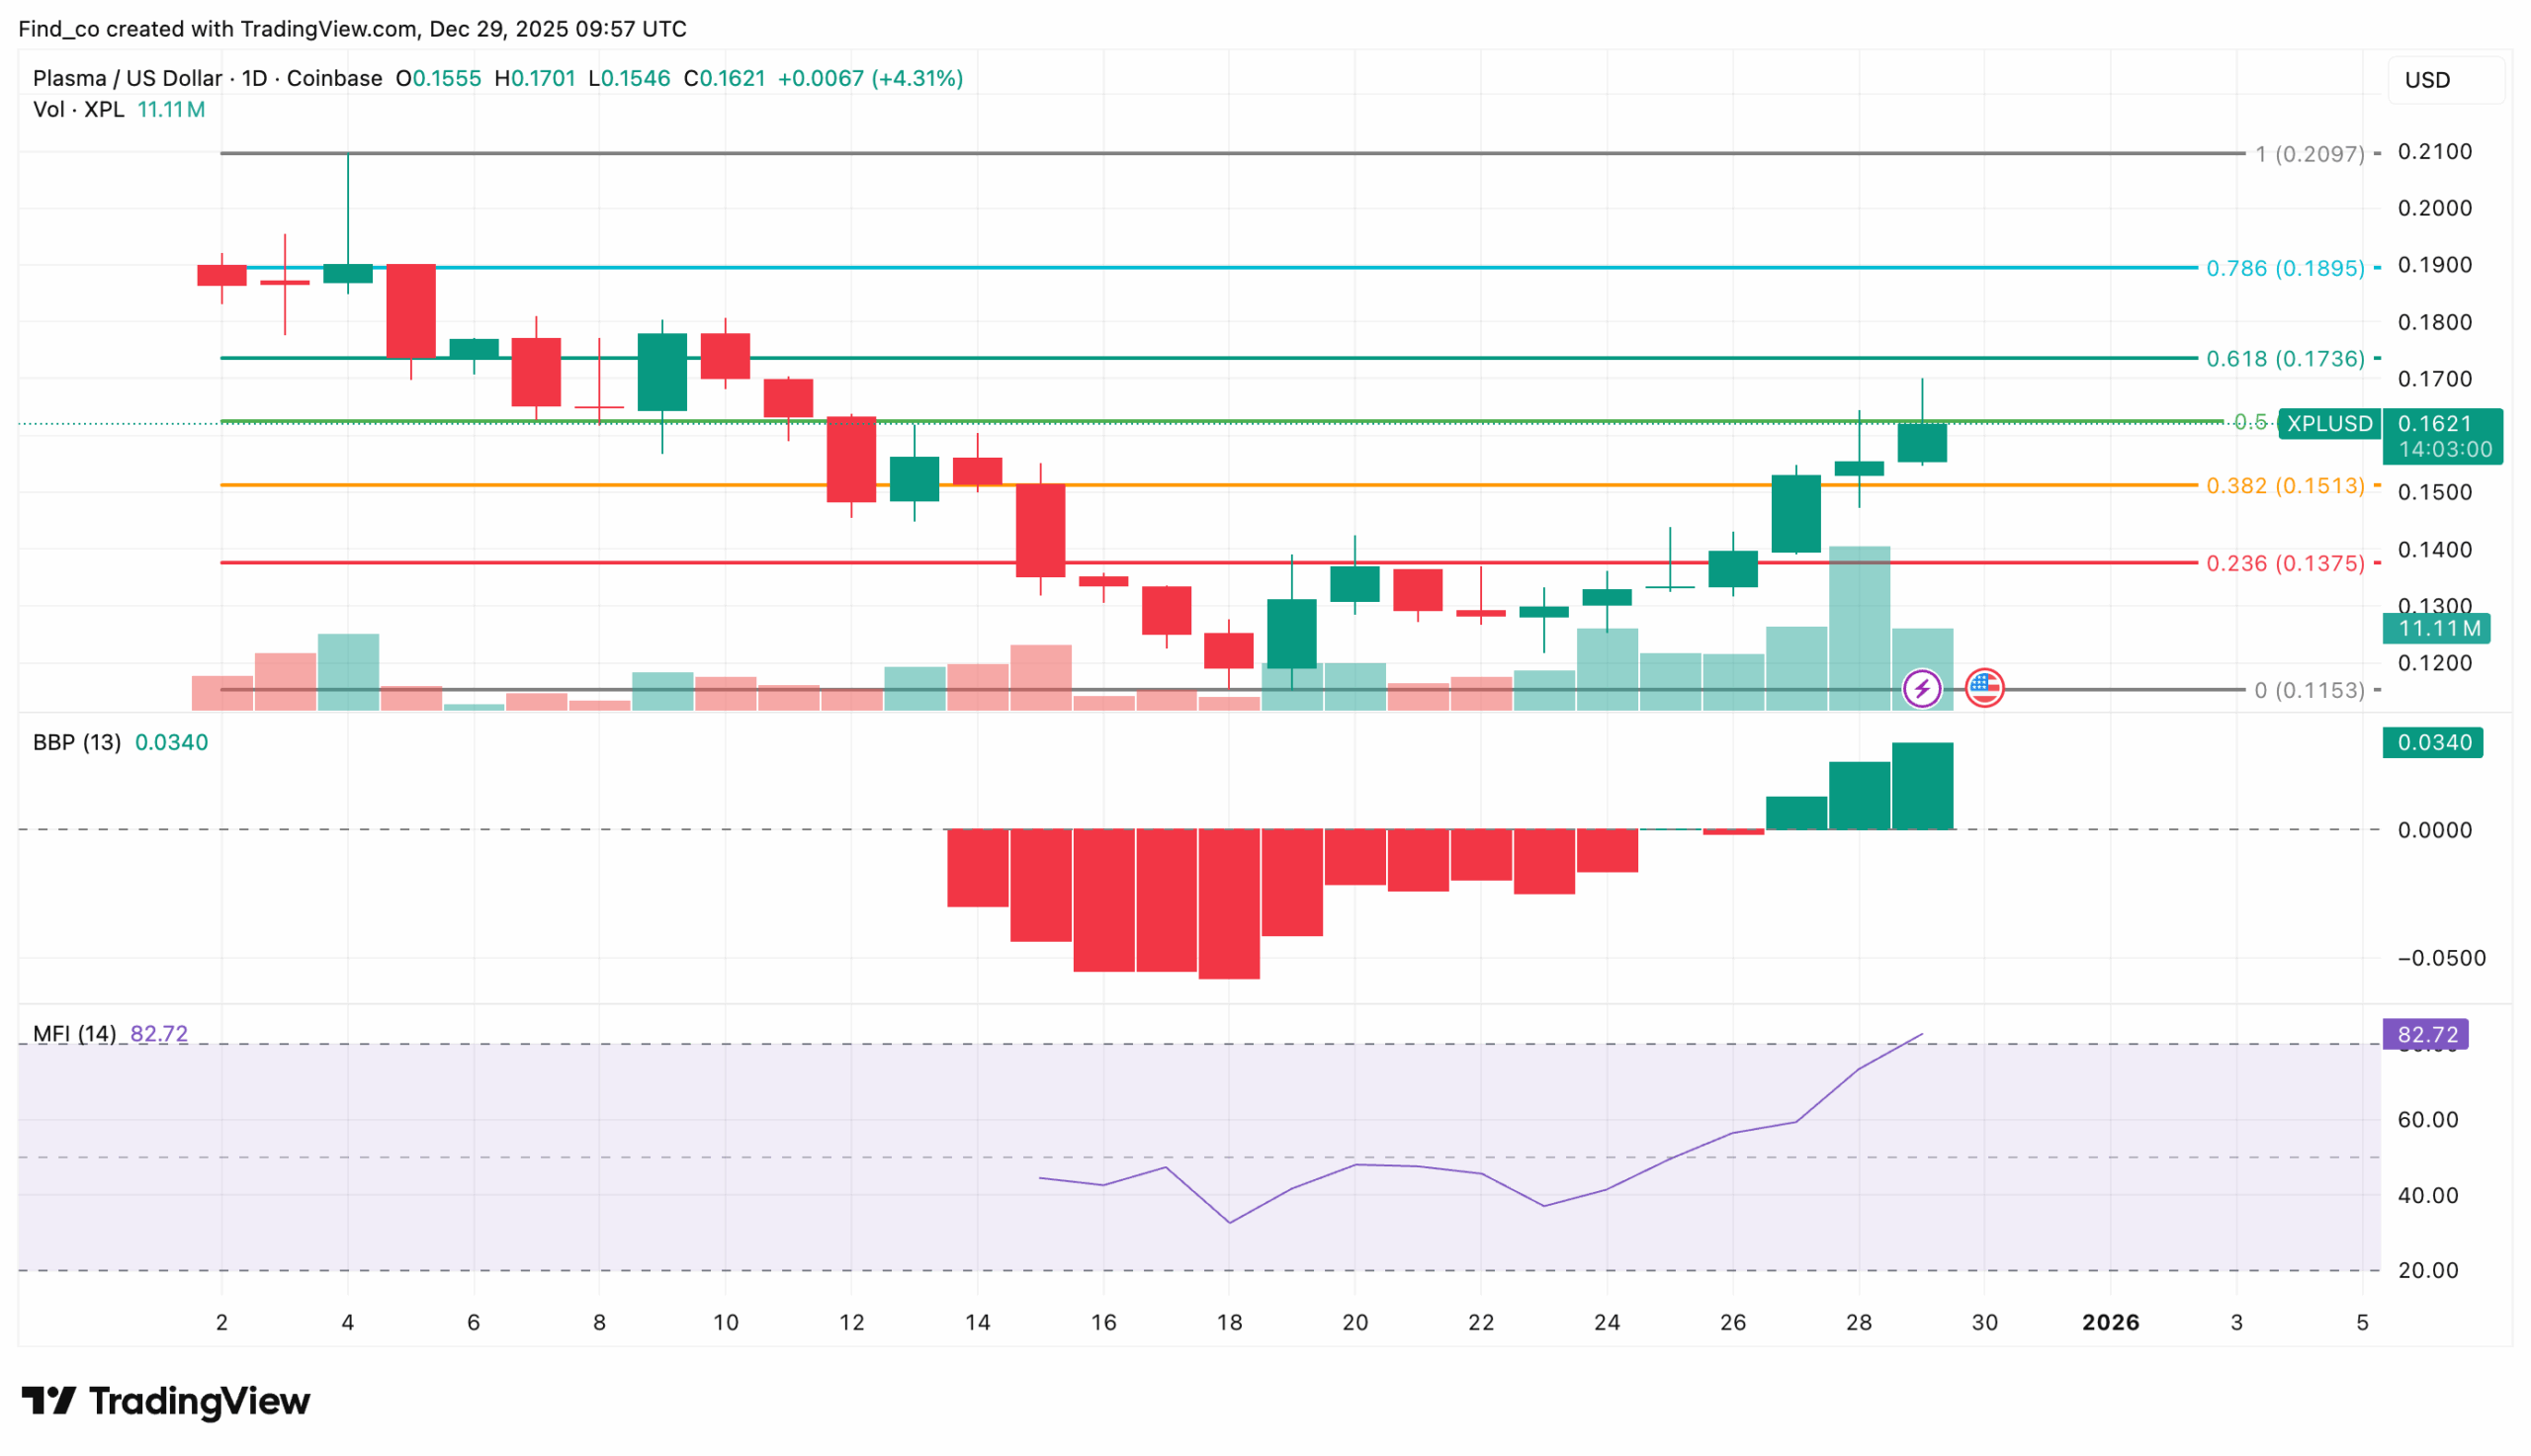
On the daily timeframe, XPL’s price has confirmed a breakout from a falling wedge, following through with multiple consecutive green candles.
This improvement in structure supports the idea of a recovery phase.
Furthermore, the Money Flow Index (MFI) is currently elevated at 82.56, signaling strong capital inflows.
However, overbought readings can also precede short-term pullbacks, making consolidation a realistic possibility even if the trend remains bullish.
Bull Bear Power (BBP) remains supportive, printing consecutive green bars in positive territory. The rise in the BBP also serves as evidence that buyers continue to dominate directional momentum.
It also implies that the breakout has not yet been invalidated.
Fibonacci retracement levels provide clearer reference points.
Disclaimer:
The information provided in this article is for informational purposes only. It is not intended to be, nor should it be construed as, financial advice. We do not make any warranties regarding the completeness, reliability, or accuracy of this information. All investments involve risk, and past performance does not guarantee future results. We recommend consulting a financial advisor before making any investment decisions.
Victor Olanrewaju is a crypto analyst and reporter at CCN with deep roots in on-chain research and technical analysis. His crypto journey began in 2017, but it was the 2020 Uniswap airdrop that sparked a full-time pivot into the space.
With a foundation in copywriting, Victor honed his craft creating high-converting content for leading crypto brokers — most notably an XRP price prediction that ranked #1 on Google during the 2021 bull run.
He later joined AMBCrypto in 2022, where he combined storytelling with technical and on-chain analysis to cover key market narratives.
In 2024, he expanded his expertise at BeInCrypto, collaborating with analysts and using tools like Glassnode, Santiment, and IntoTheBlock to break down Bitcoin and altcoin trends.
At CCN, Victor covers the top cryptocurrencies, memecoins, macro shifts, blending real-time insights with deep-dive metrics.
He holds a Bachelor’s degree in Physics from the University of Ibadan, equipping him to simplify complex data for a wide audience. Follow his work or connect on LinkedIn or X.