Will PEPE price continue to increase? | Credit: Hameem Sarwar
Share
Key Takeaways
PEPE is gaining momentum, up 11%, and maintaining a bullish structure on the 4-hour chart.
Positive on-chain activity shows real participation, though resistance may cause pullbacks.
A confirmed breakout could drive further gains, while failure to hold support may lead to a drop.
PEPE is starting to show signs of life again.
After weeks of quiet price action and fading attention, the frog-themed memecoin has climbed about 11% over the past week, hinting at a shift in short-term momentum.
The move has brought PEPE back into focus, marking its first meaningful gain in several weeks.
But this isn’t just about a bounce—it’s about whether that momentum can actually stick.
So, can PEPE keep pushing higher, or is this just a short-lived move? Let’s take a closer look.
Pepe Bulls Defend Bullish Structure
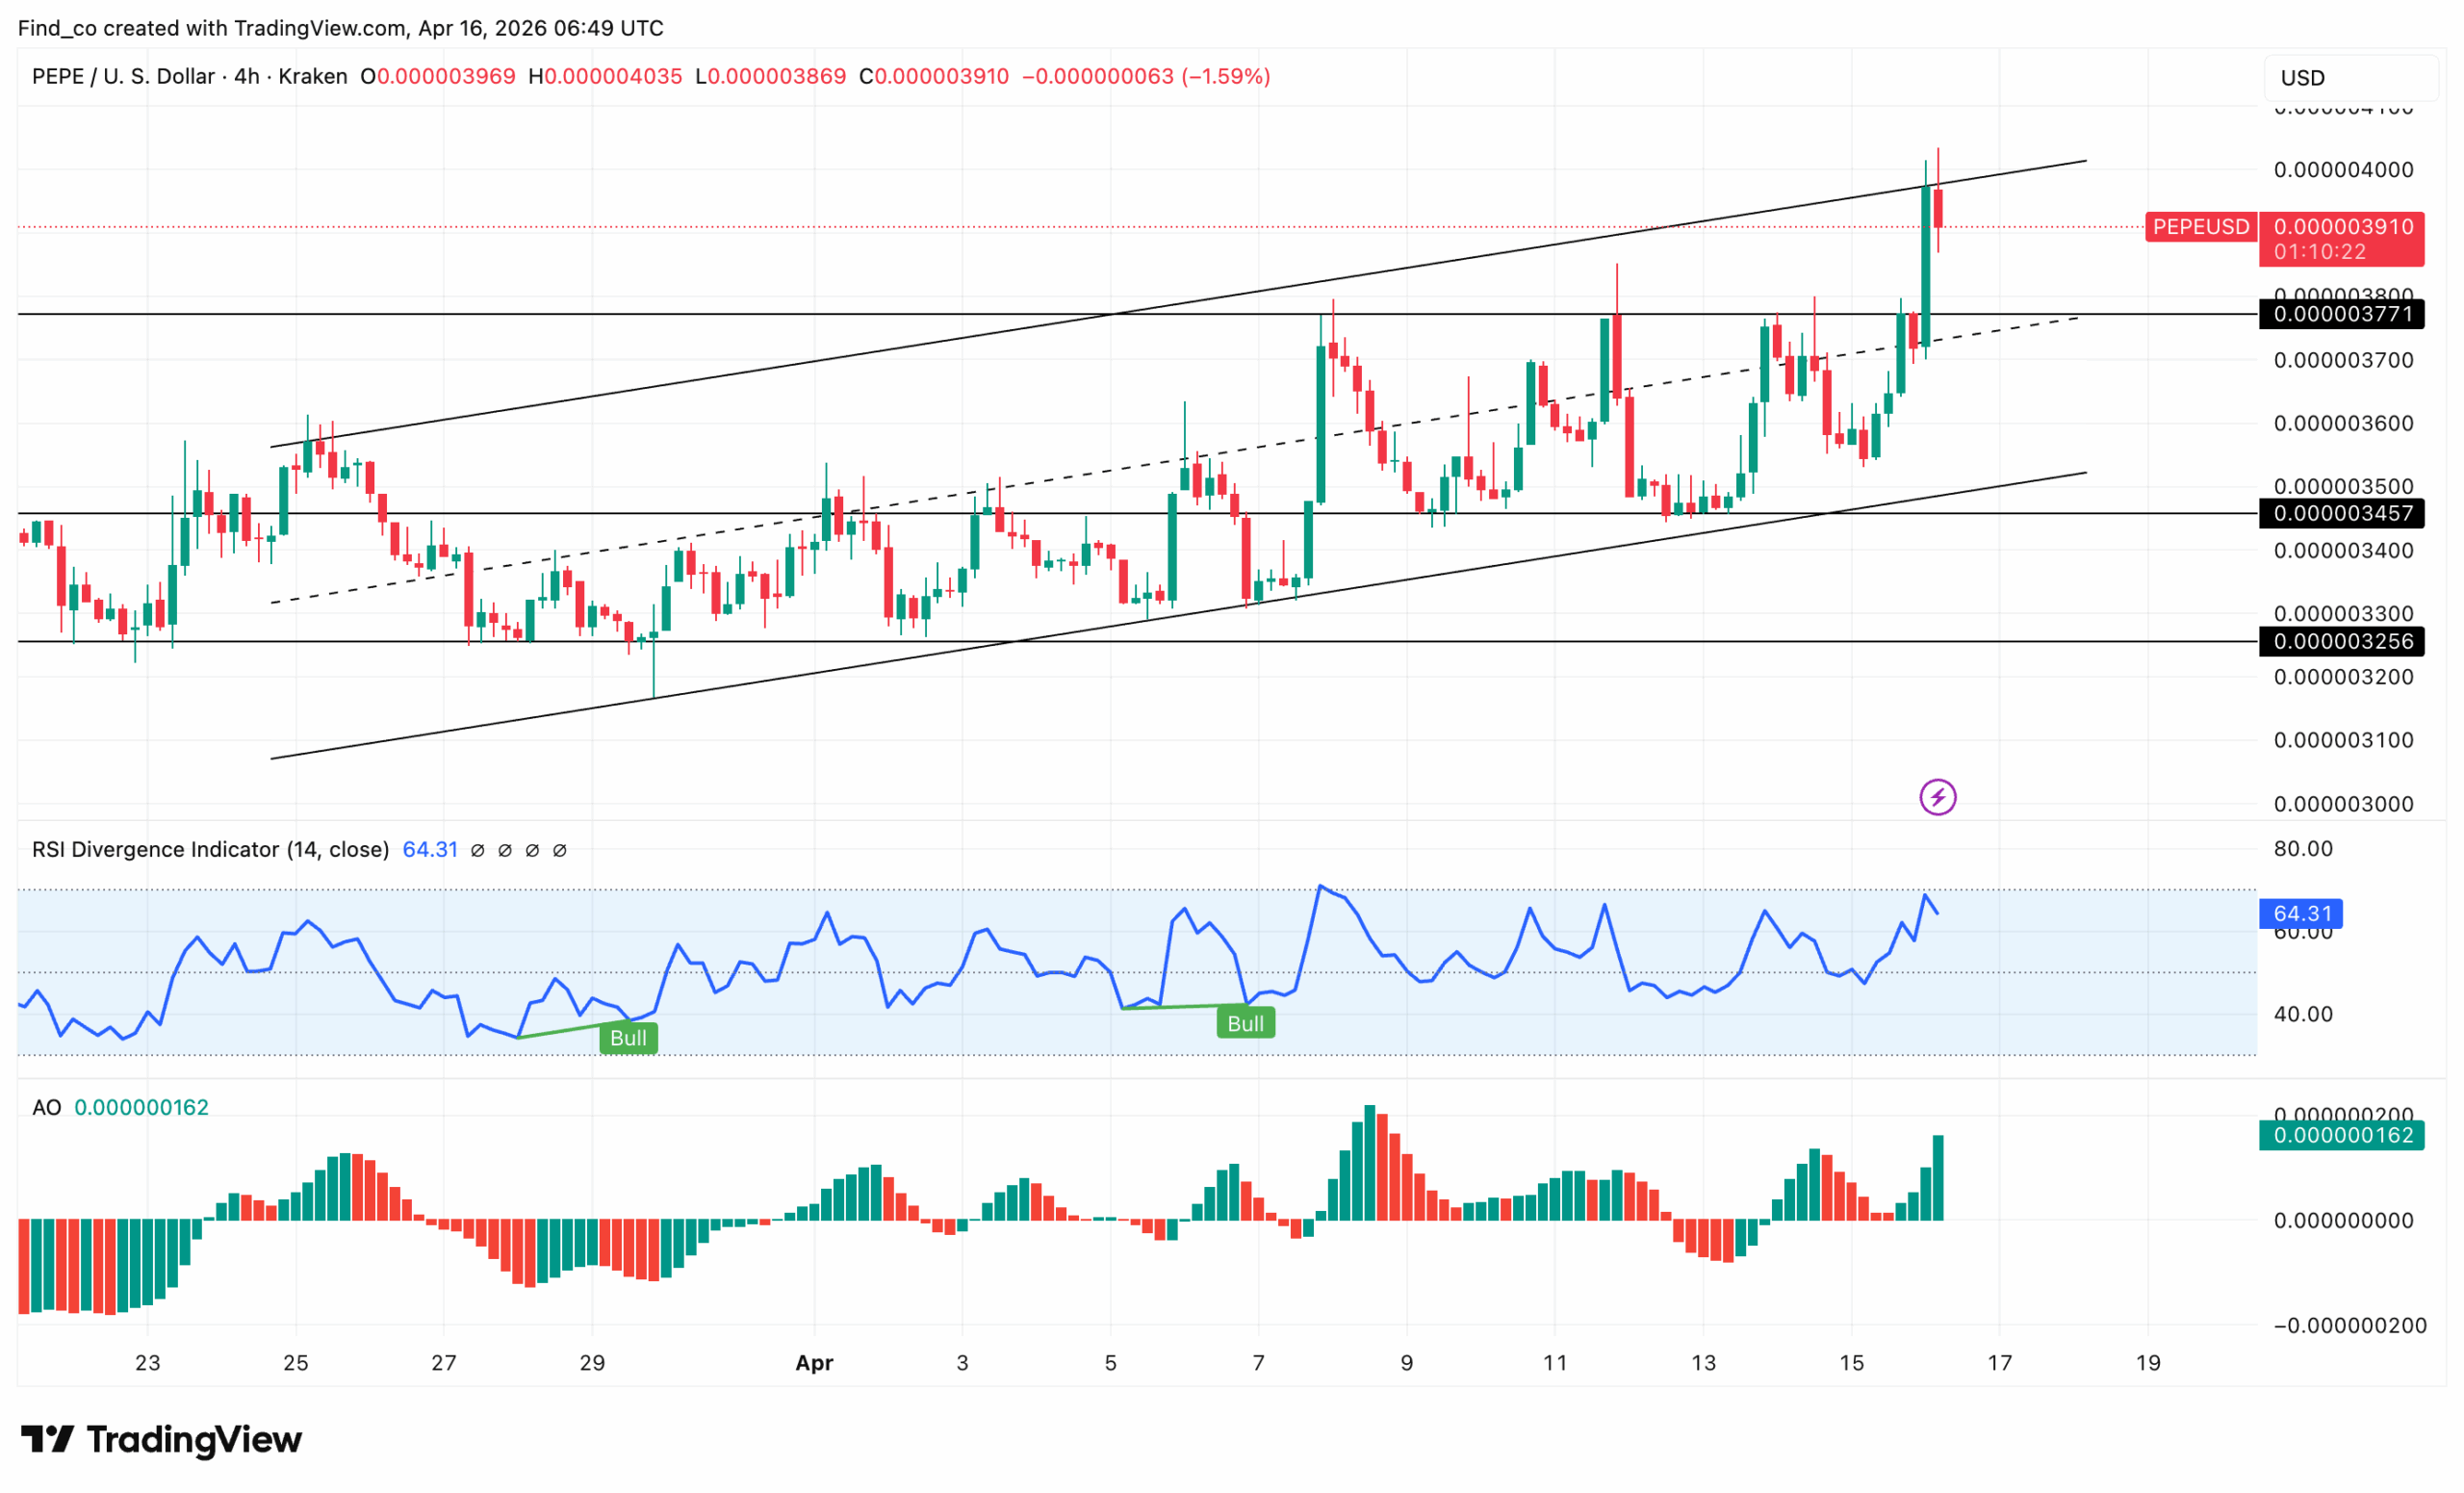
On the 4-hour chart, PEPE continues to trend higher within a rising parallel channel, keeping the overall structure bullish.
The price has respected both the upper and lower bounds of the channel, with higher lows forming consistently, an indication of steady demand.
The mid-range trendline is also holding as key support, helping maintain the upward structure.
Recently, PEPE pushed back toward the upper boundary of the channel, showing that buyers are still active.
However, there was a slight rejection near the top, hinting at some short-term exhaustion.
Momentum indicators reflect a balanced picture. The Relative Strength Index (RSI) sits around 64, suggesting strength without being overbought, which leaves room for further upside.
At the same time, the Awesome Oscillator (AO) has turned positive again, pointing to a pickup in bullish momentum after a brief pause.
That said, with price now testing resistance near the top of the channel, a short-term pullback toward the midline—or even lower support—remains possible before any further move higher.
PEPE 4-Hour Chart | Credit: TradingView
Overall, the structure remains bullish. As long as price holds above the channel support ($0.00000345), the trend stays intact, with upside pressure toward the upper boundary.
Real Participation Backs the Trend
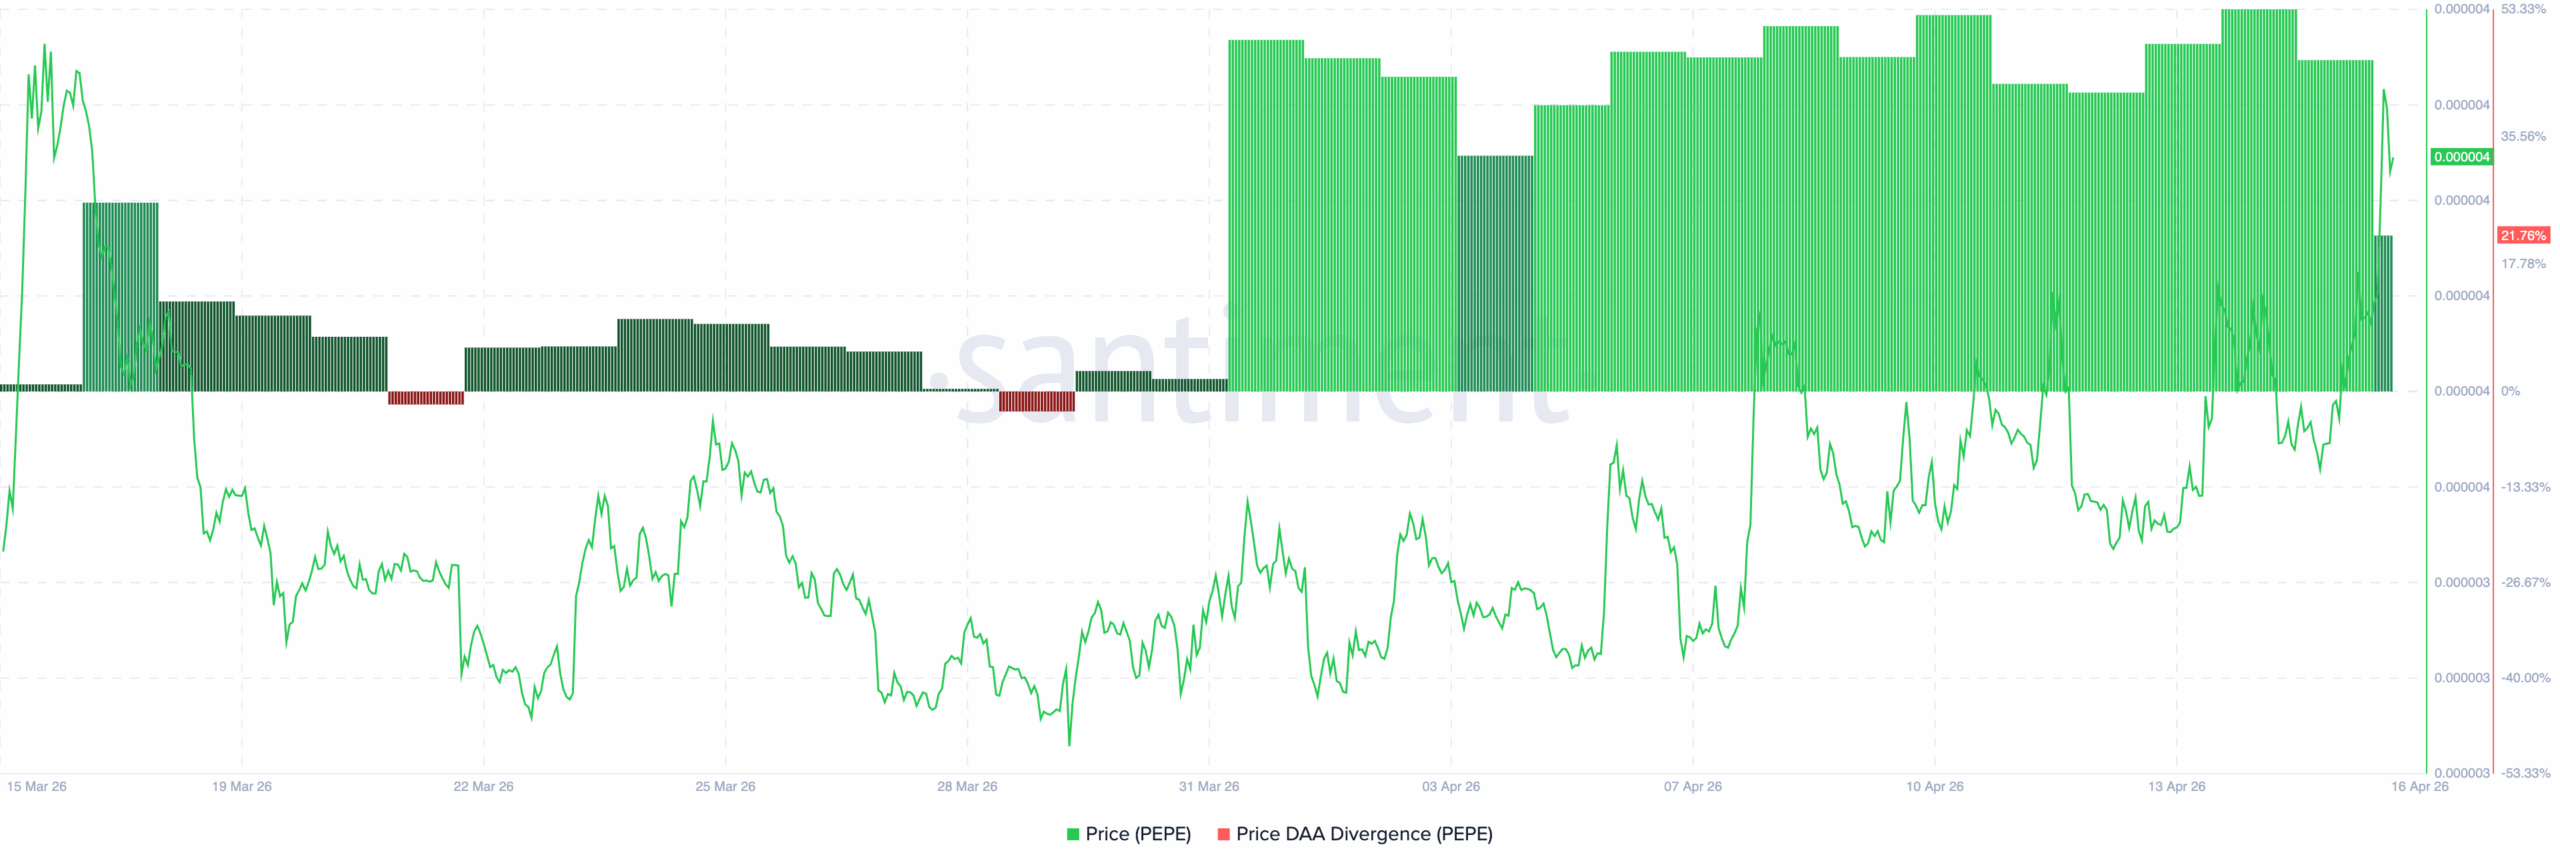
In the meantime, PEPE is showing strong on-chain support, reinforcing the ongoing uptrend.
Notably, the Price–Daily Active Addresses (DAA) Divergence has turned positive. This indicates that network activity is growing faster than the memecoin’s price.
In other words, underlying usage supports the current upswing. This also signals sustained demand, not just a short-term spike.
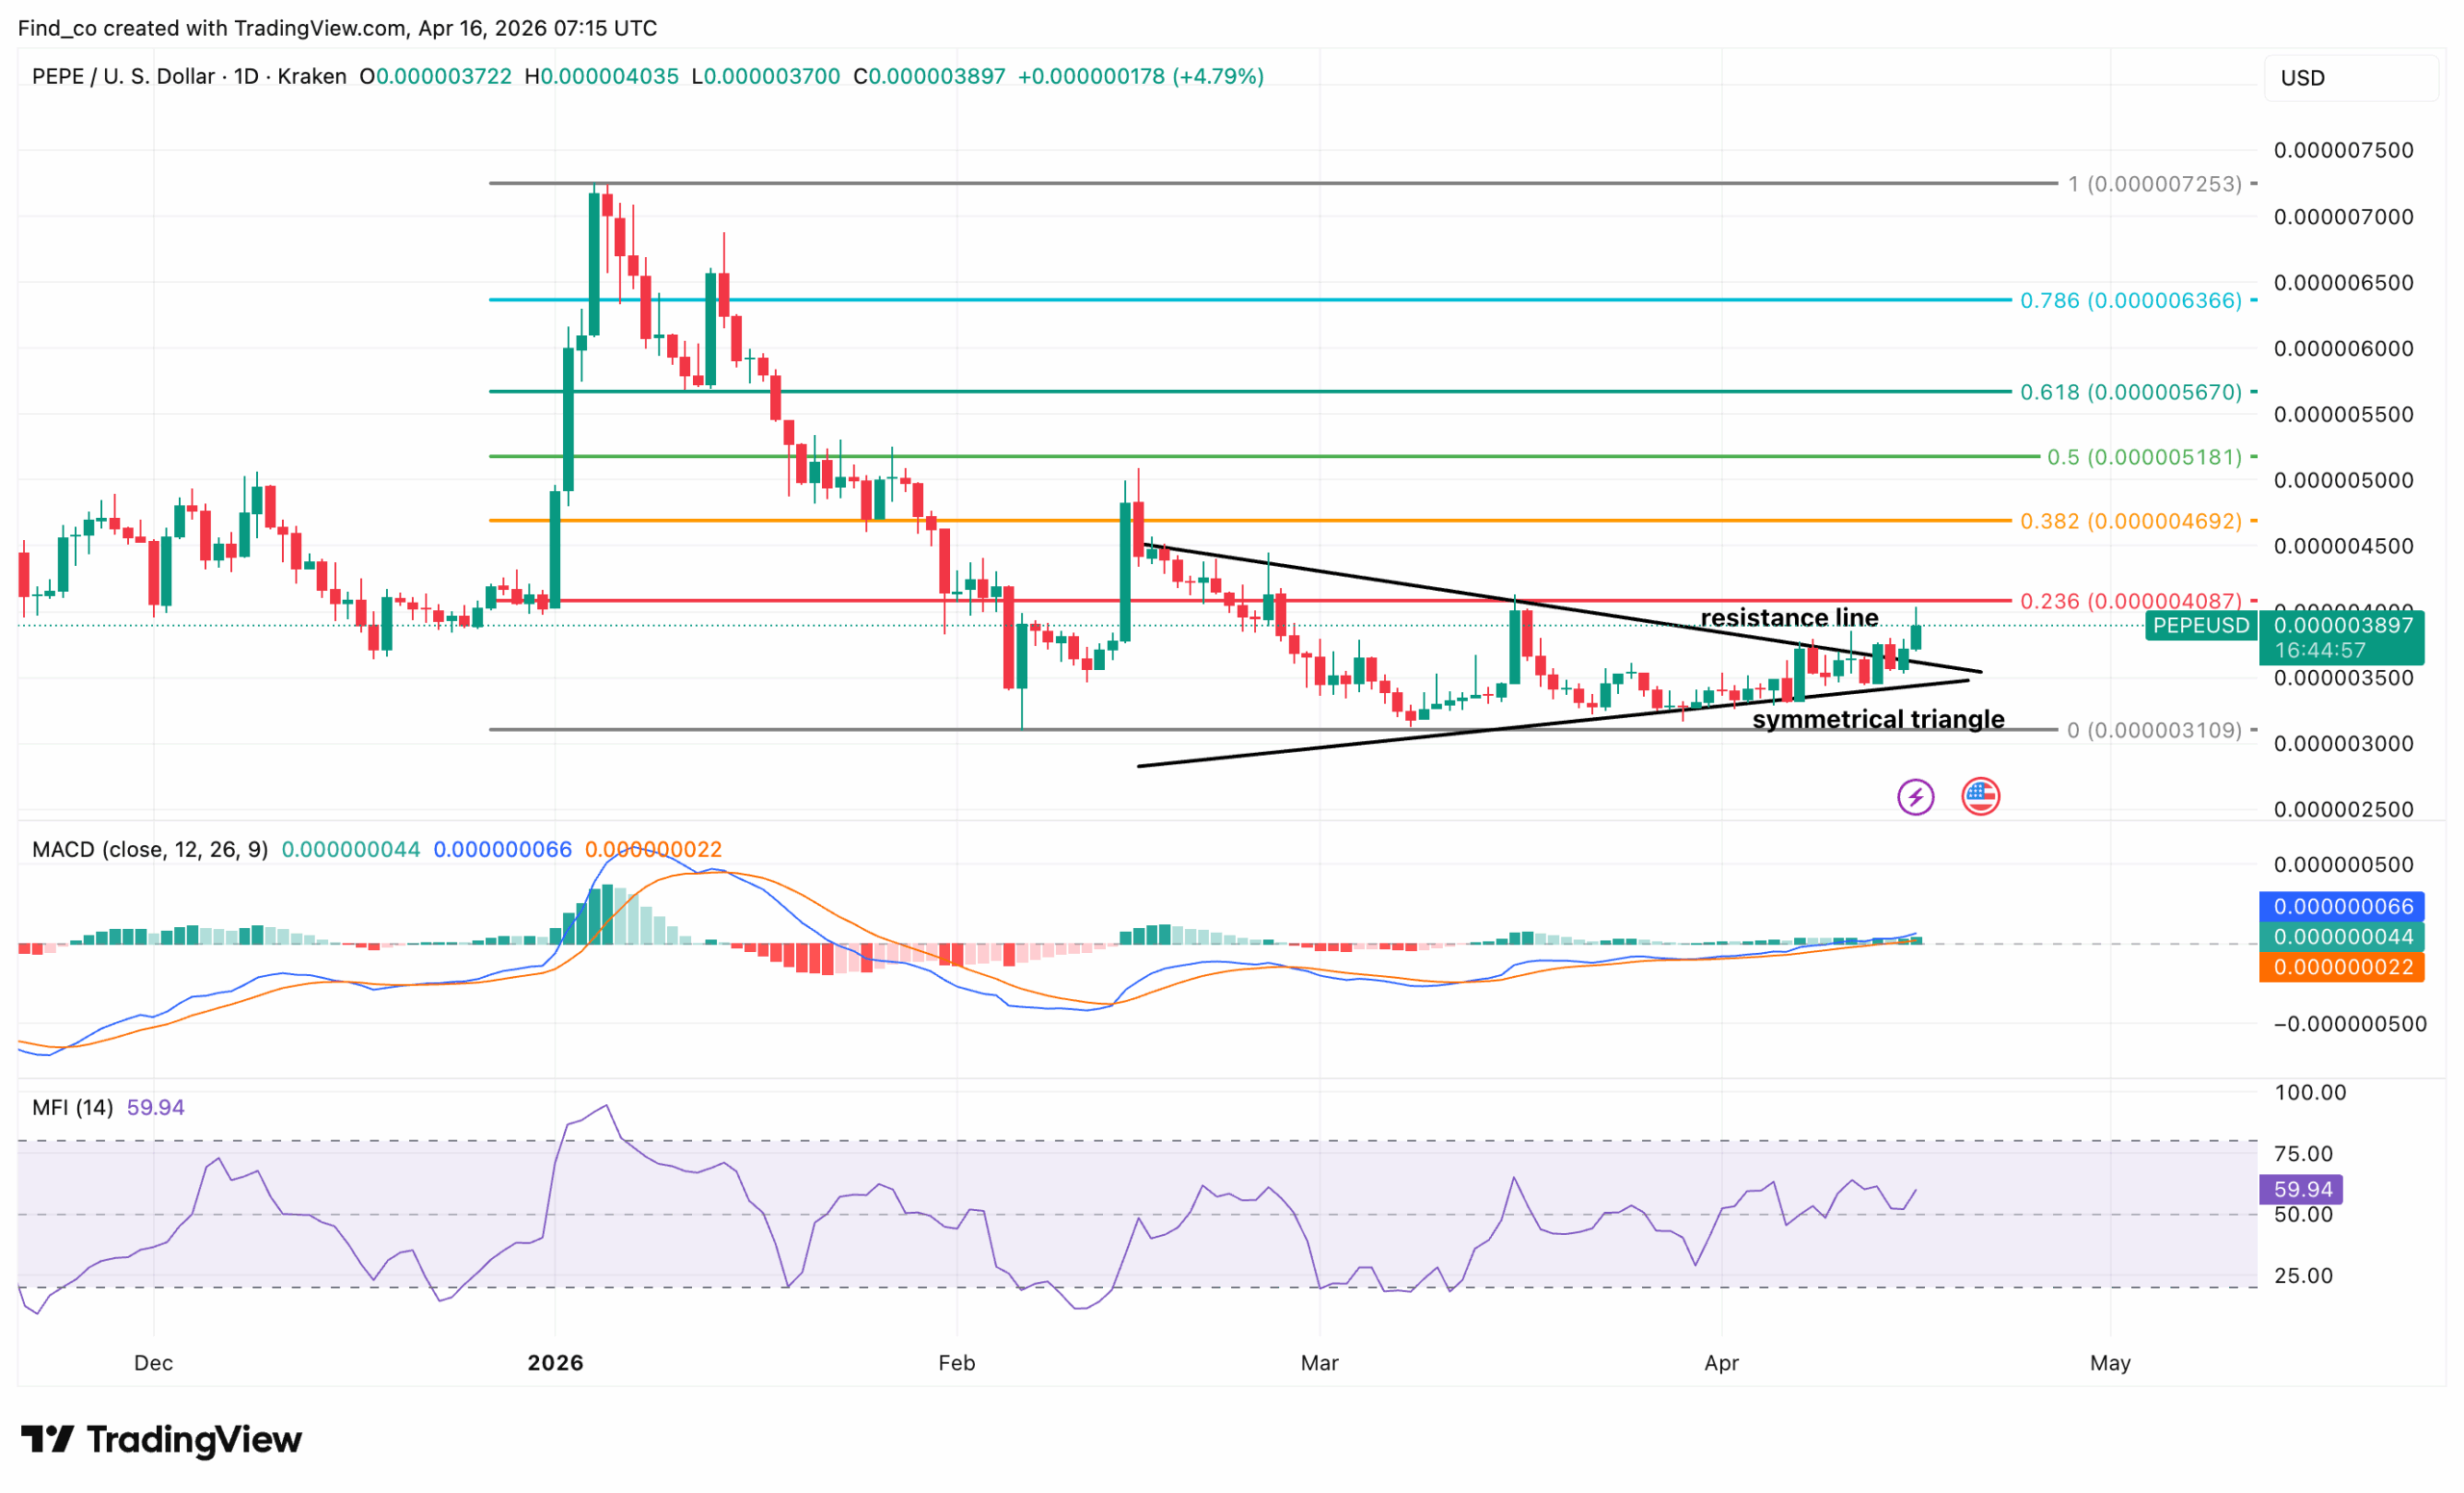
However, at the time of writing, the price has formed lower highs and higher lows, breaking the upper-level resistance.
This tightens the structure between clear support and resistance lines amid rising volatility.
Currently, PEPE’s price sits just below the 0.236 Fib near $0.00000408, which acts as immediate resistance.
However, multiple rejections here confirmed that sellers are still active. Meanwhile, momentum begins to shift.
Amid this, the Moving Average Convergence Divergence (MACD) shows a mild bullish crossover, with the histogram turning slightly positive.
This suggests early momentum recovery. At the same time, the Money Flow Index (MFI) holds near 60, indicating steady capital inflow without overbought conditions.
However, the move lacks strong conviction so far. The price remains capped within the triangle, and no breakout confirmation has occurred yet.
If bulls break above the resistance trendline and reclaim the 0.236 level, upside toward 0.382 at $0.0000047. becomes likely.
In a highly bullish scenario, the token might rise to $0.0000055.
On the other hand, a breakdown below the triangle support would expose the range lows again. In that scenario, PEPE might slide to $0.0000031.
Disclaimer:
The information provided in this article is for informational purposes only. It is not intended to be, nor should it be construed as, financial advice. We do not make any warranties regarding the completeness, reliability, or accuracy of this information. All investments involve risk, and past performance does not guarantee future results. We recommend consulting a financial advisor before making any investment decisions.
Victor Olanrewaju is a crypto analyst and reporter at CCN with deep roots in on-chain research and technical analysis. His crypto journey began in 2017, but it was the 2020 Uniswap airdrop that sparked a full-time pivot into the space.
With a foundation in copywriting, Victor honed his craft creating high-converting content for leading crypto brokers — most notably an XRP price prediction that ranked #1 on Google during the 2021 bull run.
He later joined AMBCrypto in 2022, where he combined storytelling with technical and on-chain analysis to cover key market narratives.
In 2024, he expanded his expertise at BeInCrypto, collaborating with analysts and using tools like Glassnode, Santiment, and IntoTheBlock to break down Bitcoin and altcoin trends.
At CCN, Victor covers the top cryptocurrencies, memecoins, macro shifts, blending real-time insights with deep-dive metrics.
He holds a Bachelor’s degree in Physics from the University of Ibadan, equipping him to simplify complex data for a wide audience. Follow his work or connect on LinkedIn or X.